


RSI Indicator Explained
In short
The Relative Strength Index (RSI) is a momentum indicator developed by J. Welles Wilder Jr. that measures the speed and change of price movements. It displays as an oscillator from 0 to 100, helping identify overbought or oversold conditions in the market by comparing average gains and losses over a set period.
The Relative Strength Index (RSI) is a popular technical indicator among crypto traders of all classes. Many successful crypto traders make use of the indicator to identify possible market trends and to draw rational trading decisions that translate into huge profit.
This guide will discuss what RSI is, how it works, and how you can use it effectively in your trading strategy.
What is the Relative Strength Index (RSI)?
The Relative Strength Index (RSI) is a momentum indicator that measures the strength of a security’s price action over a specified period. The RSI was developed by J. Welles Wilder Jr. and was first introduced in his 1978 book “New Concepts in Technical Trading Systems”. The RSI is a popular tool used in technical analysis to help identify overbought or oversold conditions in the market.
You can calculate the RSI using a formula that takes into account the average gain and loss of a security over a specified period. You can usually adjust the parameters to suit your trader’s preferences. The RSI displays as an oscillator that ranges from 0 to 100.
How Does RSI Work?
The RSI is a momentum indicator that compares the average gain and loss of a security over a specified period. The RSI is calculated using the following formula:
RSI = 100-[100 / (1 + RS)]
Where RS is the average of the closing price of up days divided by the average of the closing price of down days over the specified period.
The RSI is plotted as an oscillator that ranges from 0 to 100. The RSI is typically displayed as a line chart, with an upper boundary at 70 and a lower boundary at 30. When the RSI reaches these boundaries, it is said to be overbought or oversold.
When the RSI is over 70, the asset used in trading is in an overbought situation. This indicates that the security may be due for a correction. Conversely, when the RSI is below 30, it is in the oversold condition. This indicates that the security may be due for a bounce.
How to Use RSI in Your Trading Strategy
The RSI is useful in a number of different ways in your trading strategy. Here are some of the most common uses of RSI in trading:
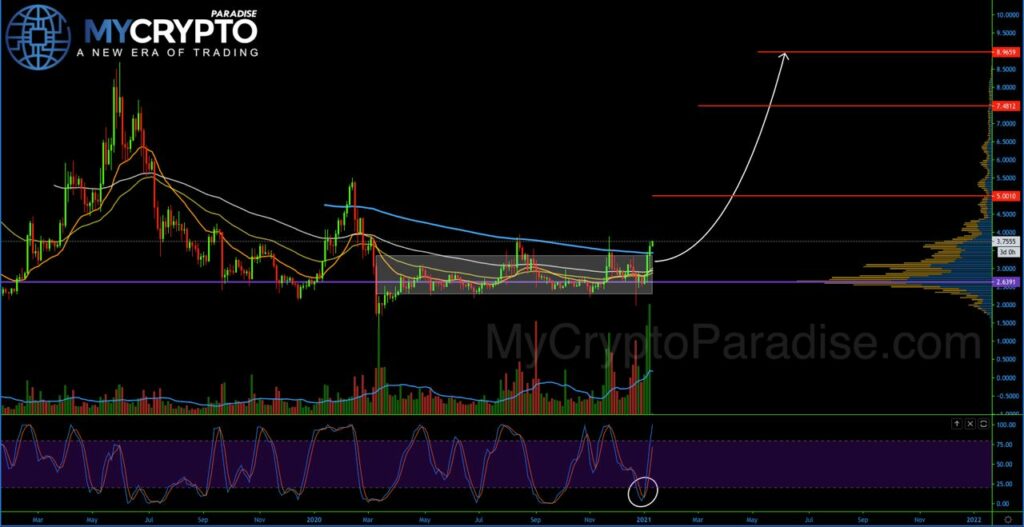
Identify Overbought and Oversold Conditions
The RSI can easily identify overbought and oversold conditions in the market. When the RSI is above 70, that asset is in the overbought region, and when the RSI is below 30, that is an oversold condition. Traders can use these levels to identify potential market reversals and adjust their trading strategy accordingly.
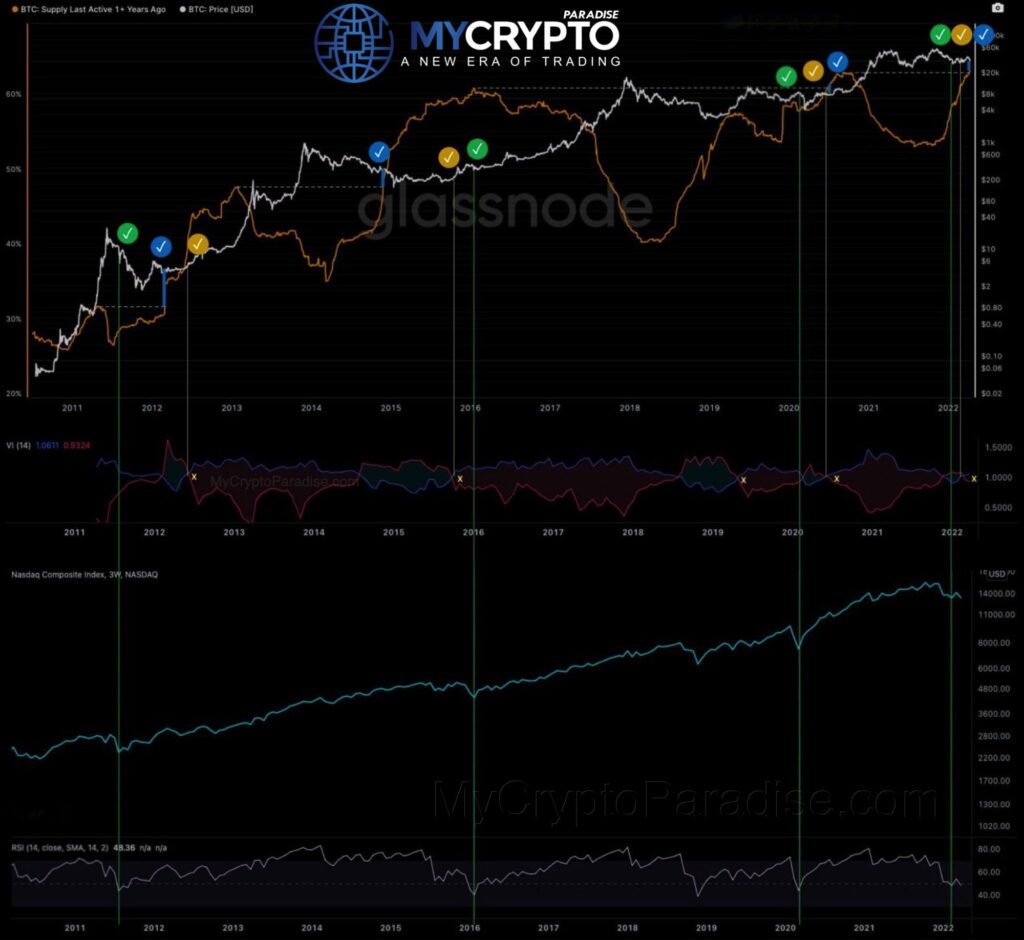
Confirm Trends
Traders use RSI to confirm trends in the market. When the RSI is trending higher along with the price of the security, it indicates that the trend is strong and likely to continue. Conversely, when the RSI is trending lower along with the price of the security, it indicates that the trend is weak and may be due for a reversal.
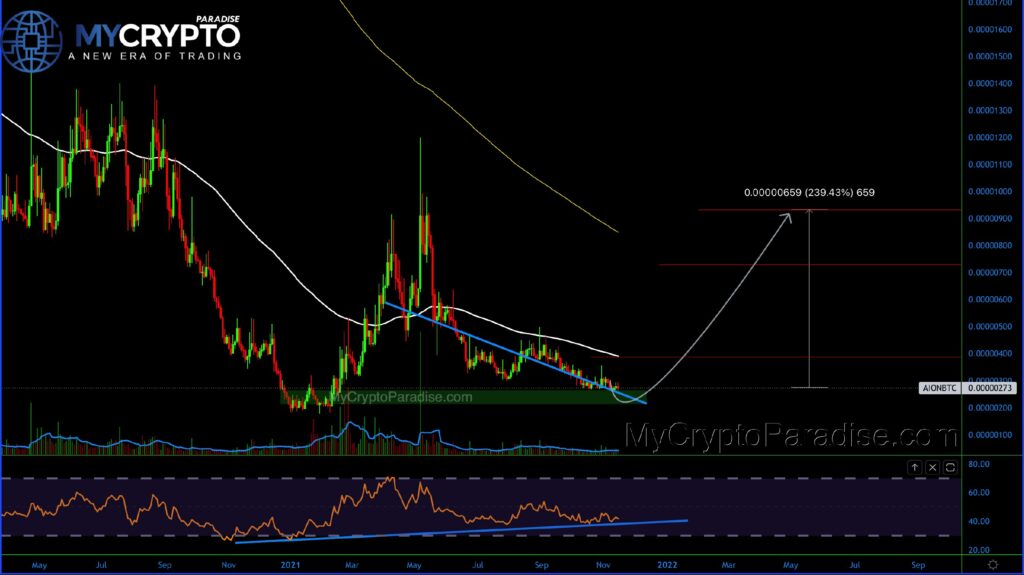
Divergence Trading
Divergence trading is a popular strategy that involves looking for divergences between the RSI and the price of the security. A bullish divergence occurs when the price of the security is making lower lows, but the RSI is making higher lows. This indicates that the momentum of the price action is shifting to the upside, and traders can use this information to enter long positions. Conversely, a bearish divergence occurs when the price of the security is making higher highs, but the RSI is making lower highs. This indicates that the momentum of the price action is shifting to the downside, and traders can use this information to enter short positions.
Use with Other Indicators
The RSI also works well in conjunction with other technical analysis indicators to refine your trading strategy. For example, you can use the RSI alongside moving averages or trendlines to identify potential support or resistance levels. This can help you make more informed trading decisions and improve the accuracy of your trades.
Tips for Using RSI Effectively
While the RSI can be a valuable tool for traders, it is important to use it effectively to avoid false signals and losses. Here are some tips for using RSI effectively in your trading strategy:
Use Multiple Timeframes
Using RSI across multiple timeframes can help you get a better understanding of the overall market trend and identify potential trading opportunities. For example, you can use a longer-term RSI to identify the overall trend, and a shorter-term RSI to time your entries and exits.
Combine with Other Indicators
The RSI is just one of many technical analysis indicators available to traders. Using it in combination with other indicators, such as moving averages or trendlines, can help you get a more comprehensive view of the market and improve the accuracy of your trades.
Avoid Overtrading
The RSI can generate a lot of signals, but not all of them will be valid. Avoid overtrading by waiting for confirmation from other indicators or waiting for the RSI to reach extreme levels before entering a trade.
Use Stop Losses
Like with any trading strategy, it is important to use stop losses when trading with RSI. This will help limit your losses and protect your capital in case the market moves against you.
Conclusion
The Relative Strength Index (RSI) is a valuable tool for traders. It can help identify potential market trends and make more informed trading decisions. Knowing how the RSI works and how to use it effectively in trading strategy, can improve accuracy of trades. Also, and increase your chances of success in the market. Remember to use the RSI in combination with other indicators. Also, avoid overtrading, and always use stop losses to protect your capital.
What is different here
Most guides stop at the theory. The MyCryptoParadise team shares the live trades, and the reasoning behind each one, inside ParadiseFamilyVIP. Everything here is education, not financial advice.
Crypto trading involves substantial risk and is not suitable for everyone. Nothing here is financial advice; it is education only. Never risk more than you can afford to lose.


Join the discussion
No comments yet. Pro Paradiser members, share how you are reading this.