


Pattern Confirmation
In short
Combining the head and shoulders pattern with other technical indicators enhances signal reliability by using tools like moving averages. Traders look for a neckline break confirmed by a volume surge, price closing below key moving averages (e.g., 50-day or 200-day), bearish RSI or MACD divergence, a rising ADX, and Fibonacci resistance aligning with the neckline to validate the reversal.
Combining the head and shoulders pattern with other technical indicators in crypto trading can provide additional confirmation and enhance the reliability of your trading signals. The head and shoulders pattern is a popular reversal pattern that indicates a potential trend reversal from bullish to bearish. Here’s how you can combine this pattern with other technical indicators:
Moving Averages
Moving averages are widely used to identify trends and provide support and resistance levels. When combining moving averages with the head and shoulders pattern, you can look for the price to break below key moving averages, such as the 50-day or 200-day moving average, after the completion of the pattern. The moving averages can act as additional confirmation of the bearish trend reversal signaled by the head and shoulders pattern.
Volume Analysis
Volume analysis can provide valuable insights into the strength of price movements. When observing the head and shoulders pattern, pay attention to the volume levels during the formation of each shoulder and the head. Typically, the volume tends to be higher during the formation of the head compared to the shoulders.
Additionally, when the price breaks below the neckline of the pattern, a surge in volume can further confirm the bearish trend reversal. High volume during the breakdown adds credibility to the pattern and indicates increased selling pressure.
Oscillators
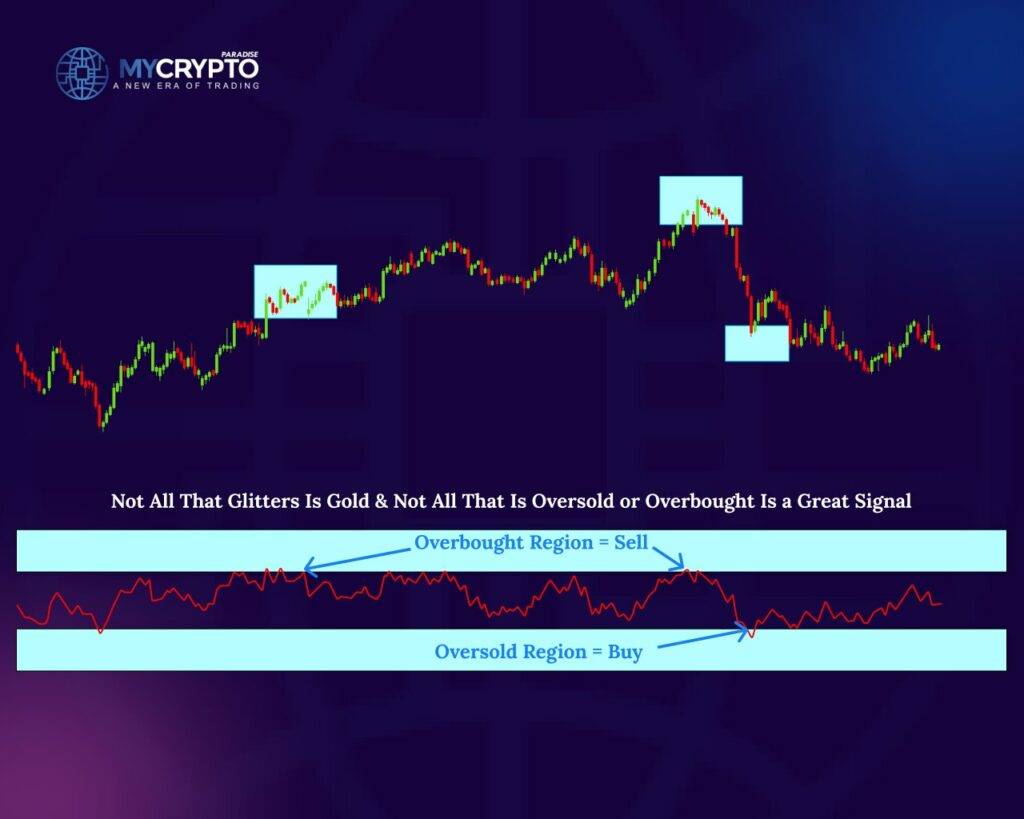
Oscillators, such as the Relative Strength Index (RSI) or Stochastic Oscillator, can help identify overbought or oversold conditions and potential trend reversals. When combining these oscillators with the head and shoulders pattern, look for bearish divergences.
A bearish divergence occurs when the price forms higher highs while the oscillator forms lower highs. This indicates weakening bullish momentum and can provide additional confirmation of the impending bearish reversal suggested by the head and shoulders pattern.
The most commonly used oscillators that can be used in conjunction with the head and shoulders pattern are moving averages and the RSI. We will also cover other oscillators in this section.
Moving Average Convergence Divergence (MACD):
The MACD is a popular oscillator that measures the relationship between two moving averages. It consists of a MACD line and a signal line. When combining the MACD with the head and shoulders pattern, you can look for bearish divergences between the MACD and the price.
If the price forms higher highs while the MACD forms lower highs, it suggests weakening bullish momentum and provides additional confirmation of the bearish reversal indicated by the head and shoulders pattern.
Relative Strength Index (RSI):
The RSI is a momentum oscillator that measures the speed and change of price movements. When using the RSI with the head and shoulders pattern, look for bearish divergences. If the price forms higher highs while the RSI forms lower highs, it indicates a loss of bullish momentum and reinforces the bearish reversal signaled by the head and shoulders pattern.
Stochastic Oscillator:
The Stochastic Oscillator is another momentum oscillator that compares the closing price of an asset to its price range over a specified period. When combining the Stochastic Oscillator with the head and shoulders pattern, watch for bearish divergences. If the price forms higher highs while the Stochastic Oscillator forms lower highs, it suggests weakening bullish momentum and supports the bearish reversal indicated by the head and shoulders pattern.
Average Directional Index (ADX):
The ADX is a trend strength indicator that measures the strength of a trend, regardless of its direction. When using the ADX with the head and shoulders pattern, look for rising ADX values. An increasing ADX indicates a strengthening downtrend, which aligns with the bearish reversal suggested by the head and shoulders pattern.
Commodity Channel Index (CCI):
The CCI is an oscillator that measures the deviation of an asset’s price from its statistical average. When combining the CCI with the head and shoulders pattern, watch for bearish divergences. If the price forms higher highs while the CCI forms lower highs, it signals weakening bullish momentum and adds confirmation to the bearish reversal indicated by the head and shoulders pattern.
Fibonacci Retracement:
Fibonacci retracement levels can be used to identify potential support and resistance levels during price corrections. After the completion of the head and shoulders pattern, you can apply Fibonacci retracement levels to the previous bullish trend leading up to the pattern.
Look for the price to retrace and find resistance near these Fibonacci levels before continuing the downtrend. When the retracement aligns with the neckline of the head and shoulders pattern, it provides further confirmation of the bearish reversal.
Trendline Analysis:
Trendlines can help identify key support and resistance levels and validate the head and shoulders pattern. Draw trendlines connecting the peaks of the shoulders and the head. These trendlines should act as resistance levels for the price. When the price breaks below the neckline of the pattern and the trendline, it provides additional confirmation of the bearish reversal.
Combing Head and Shoulders with Trendlines and Price Actions
Trendlines
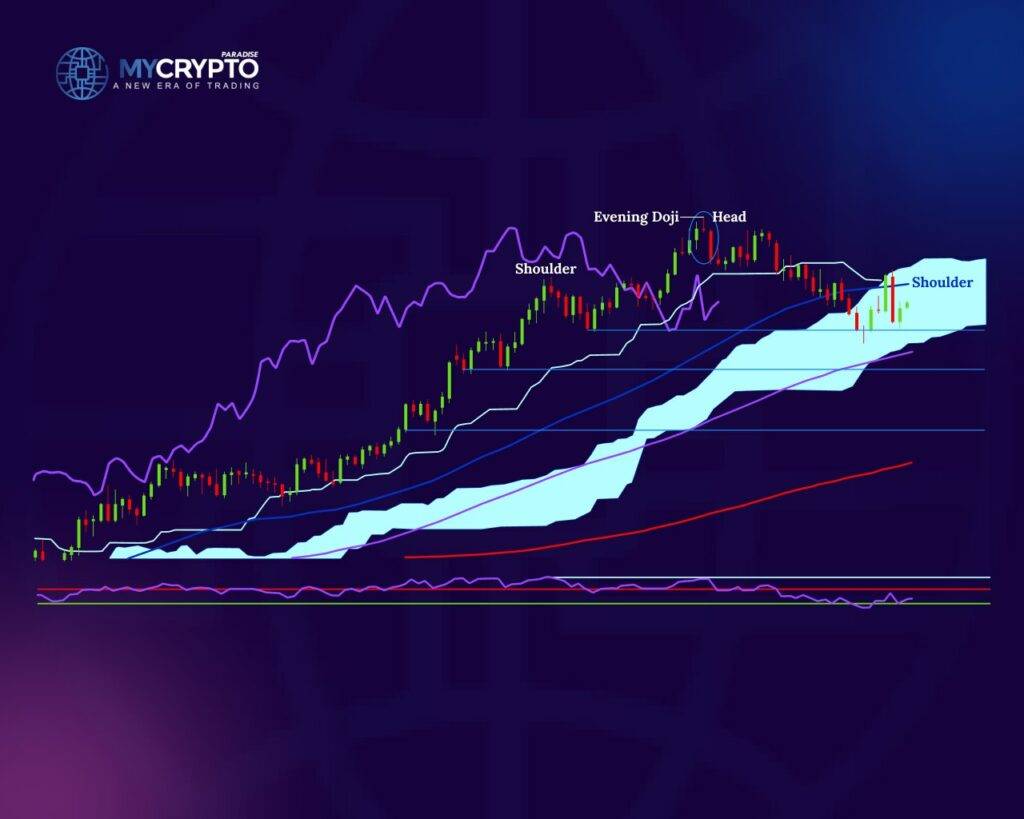
Trendlines are lines drawn on a price chart to connect important swing highs or lows. They help identify the overall trend and provide additional confirmation of the head and shoulders pattern. In the case of a head and shoulders top pattern, you can draw a trendline connecting the peaks of the shoulders, forming a “neckline.”
The break of this neckline acts as a trigger for the bearish reversal. Additionally, trendlines can be used to identify support and resistance levels that align with the pattern, further strengthening the analysis.
Price Patterns
Look for other price patterns that align with the head and shoulders pattern. For example, a double top pattern or a descending triangle pattern formed within the head and shoulders structure can provide stronger confirmation of the impending trend reversal. Combining multiple patterns can increase the reliability of your trading signals.
In ParadiseFamilyVIP🎖️, we send crypto signals which you get from our team of professional traders.
Conclusion
It is reasonable to note, however, that no single indicator or pattern guarantees accurate predictions in trading. It’s essential to use a combination of indicators and patterns to increase the probability of successful trades. Additionally, always practice proper money management techniques, such as setting stop loss levels and adjusting position sizes based on your risk tolerance.
The knowledge you’ve gained from this article is a strong starting point, but on its own it won’t make you a consistently profitable trader. To build on it over the long term, you need to pair it with disciplined strategy, risk management, and consistent practice.
At ParadiseFamilyVIP🎖️, we blend technical analysis, on-chain insights, sentiment monitoring, and whale psychology with effective strategies to provide professional, risk-managed crypto signals and portfolio guidance. These tools are built to help you trade with more structure and discipline. Outcomes vary and no result is guaranteed.
👉To check availability in ParadiseFamilyVIP🎖️ (Click it)
With full visibility into our trading activities, we provide you with the knowledge to grow as a trader. If you’re ready to step up to professional trading, our inner circle is the best option.
Pattern Confirmation FAQ
What confirms a head and shoulders breakdown?
A close below the neckline on rising volume is the core trigger. Adding a break below the 50-day or 200-day moving average and bearish momentum divergence on RSI or MACD strengthens the signal.
How does volume validate the pattern?
Volume usually peaks during the head and fades on the right shoulder. A clear surge in volume as price breaks the neckline signals increased selling pressure and adds credibility to the bearish reversal.
Which oscillators pair best with this pattern?
RSI and MACD are the most common. Look for bearish divergence, where price makes higher highs while the oscillator makes lower highs, signalling weakening bullish momentum ahead of the reversal.
Does any single indicator confirm a reversal on its own?
No. No single indicator or pattern is reliable alone, so traders stack several confirmations and apply money management such as stop losses and position sizing to raise the probability of a sound trade.
Crypto trading involves substantial risk of loss. This article is educational and is not financial advice. Past performance does not guarantee future results. Always do your own research.
What is different here
Most guides stop at the theory. The MyCryptoParadise team shares the live trades, and the reasoning behind each one, inside ParadiseFamilyVIP. Everything here is education, not financial advice.
Crypto trading involves substantial risk and is not suitable for everyone. Nothing here is financial advice; it is education only. Never risk more than you can afford to lose.


Join the discussion
No comments yet. Pro Paradiser members, share how you are reading this.