


Chart Pattern Analysis
In short
A triple top pattern is a bearish reversal formation that occurs when an asset's price attempts to surpass a resistance level three times but is unsuccessful. This pattern indicates that buyers are losing momentum and that a downward trend may be imminent. Confirmation of the pattern occurs when the price breaks below the neckline, which is the support level connecting the lows between the three peaks.
- The Triple Top Pattern is a bearish reversal setup that signals buyer exhaustion after a prolonged uptrend. Specifically, it forms when price tests the same resistance level three times but fails to break above it.
- Always wait for a confirmed neckline break before entering short positions. A valid breakdown should be accompanied by a clear expansion in volume, thus confirming that sellers are gaining control.
- The stop-loss placement is subjective. Conversely, the target is calculated by measuring the height between the resistance and the neckline, then extending that distance downward from the breakdown point.
The triple top pattern is one of the most reliable reversal patterns in crypto markets. However, many traders still struggle to trade it effectively.
In many cases, this happens because they lack an in-depth understanding of both the pattern and the psychological aspect behind it. In particular, traders often fail to recognize how market behavior and behavioral bias influence their decisions.
For example, during a strong uptrend, traders tend to expect the resistance level to break. As a result, they overlook important signs such as weakening momentum and declining volume footprints. Therefore, this leads to missed opportunities and poor trade execution.
At MCP University FREE, this guide is part of our precision trading series developed for disciplined, structure-focused crypto traders. After reading the full article, you will be able to identify, confirm, and trade the bearish flag pattern with expert accuracy and confidence.
Introducing the Triple Top Pattern
The Triple Top pattern is a powerful and reliable reversal pattern that helps traders identify potential market tops. In simple terms, it signals buyer exhaustion after a sustained uptrend.
Specifically, the pattern forms when the price tests the same resistance level three times but fails to break above it. As a result, this repeated rejection shows weakening buying strength.
Finally, the pattern is only confirmed when the price breaks below the support level, known as the neckline. At this point, it indicates a higher probability of a downward move.

Key characteristics of a triple top include:
- Clear uptrend beforehand: The market must be in a sustained uptrend for this pattern to form.
- Three distinct peaks: Each high reaches approximately the same resistance area before dropping.
- Neckline support: The lows of the pullbacks between peaks create a support line that later becomes a critical confirmation point (neckline).
- Breakdown below support: A decisive close below the neckline confirms the pattern, signaling that bullish momentum has faded and bearish control has taken over.
This pattern is crucial because it reflects a shift in market control. Large holders, or “smart money,” often begin selling after repeated failed attempts to break through resistance. In volatile crypto markets, triple tops frequently precede sharp corrections.
How to Identify the Triple Top Pattern?
Spotting a reliable triple top requires patience and careful observation. These are the steps you should follow:

- Confirm the prior uptrend. Without a strong, prolonged bullish move, a triple top setup lacks context.
- Identify three peaks at similar levels. Peaks should hover near the same resistance zone. A single high that exceeds the others may indicate a different pattern.
- Draw the neckline. Next, connect the two pullback lows between peaks. This line represents prior buyer support and serves as your confirmation trigger.
- Confirm with volume: Typically, volume decreases with each successive peak, indicating weakening buying pressure. Then, during the breakdown, volume rises, which shows sellers are taking control.
- Wait for a breakdown. A strong close below the neckline confirms that we can trade this pattern now.
Anatomy of the Triple Top Pattern:
Here’s how a classic triple top forms:
- First Peak: Initially, the price rallies to a new high before finding support, thereby marking the first test of resistance.
- Second Peak: Then, during the second attempt, resistance holds, and the price fails to break through. The pullback tends to be shallower, signaling early weakness.
- Third Peak: Buyers struggle on the final rally, which stalls at resistance and shows clear exhaustion. Selling pressure increases as bullish momentum fades.
- Neckline & Breakdown: Next, support is tested again, and once bears push the price below the neckline with a decisive close, the pattern is confirmed. This shift indicates that bearish control has taken over, often leading to a downtrend.

In the chart above, each peak shows repeated rejection at resistance. As a result, the breakdown below support signals a shift from bullish dominance to bearish momentum.
A surge in volume indicates increased institutional participation (“smart money”). As a result, it reflects heightened activity and competition between bulls and bears.
Following a neckline breakdown, sustained volume expansion provides strong confirmation, reinforcing bearish continuation and increasing conviction in holding the position.
Market Psychology Behind Triple Tops
The market psychology behind the triple top pattern reflects a gradual shift from bulls to bears. Initially, buyers are confident as the price pushes higher during a strong uptrend. At this stage, market participants expect the resistance level to break.
However, during the second peak, the failure to break resistance begins to reduce confidence. Consequently, early sellers start entering the market, while buyers become more cautious. This signals the first signs of weakening momentum.
By the third peak, buying pressure significantly diminishes, and the market shows clear signs of exhaustion. Moreover, experienced traders and institutional participants begin distributing their positions. As a result, bullish momentum fades and selling pressure increases.
Finally, when the price breaks below the neckline, it confirms a shift in control from buyers to sellers. Therefore, this breakdown often triggers strong bearish movement. Ultimately, the pattern reflects a transition from optimism to bearish dominance.
How to Trade the Triple Top Pattern
Trading a triple top requires patience and a clear plan. First, you should wait for confirmation. Only enter a trade after the price closes below the neckline, because entering too early often leads to failure. This step ensures that the market is truly shifting from bullish to bearish.
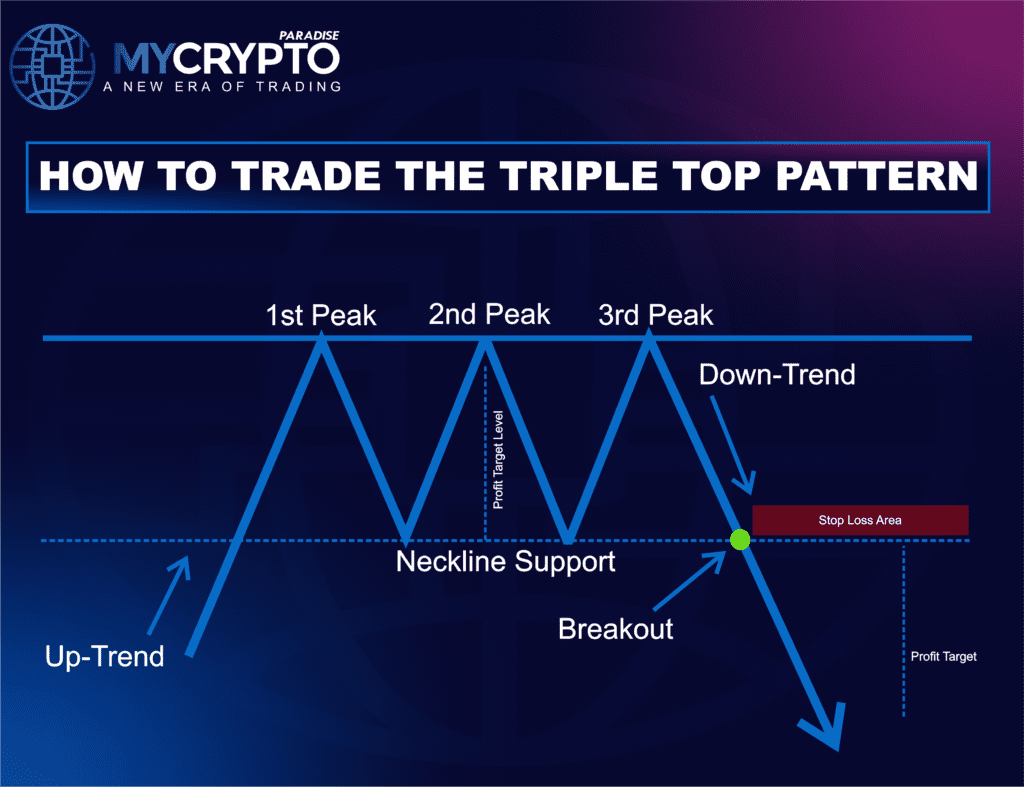
Short entry (or sell): You can enter a short position or sell when the price breaks and closes under the neckline. Also, if you are holding a long position, this is a good time to take profits and reduce risk. Waiting for the proper signal helps you avoid losses from false moves.

Stop-loss placement: Stop-loss placement can be handled in different ways depending on the pattern and market volatility. Ideally, the stop-loss should be placed just above the highest of the three peaks.
However, there are situations where the price gets rejected at the neckline, and using a very wide stop-loss can significantly reduce your position size; therefore, in such cases, placing the stop-loss just above the neckline may be a better option.
Profit target: Measure the distance between a peak (resistance) and the neckline (support). Project that same distance downward from the breakout point. This gives a reasonable downside target.
Volume & other Confirmation guide
Understanding the triple top pattern is crucial for traders who want to spot potential reversals. Moreover, confirmation from volume and technical indicators makes the pattern more reliable. Therefore, when these signals align, traders can make more confident trading decisions.
1. Volume Patterns to Watch in a Triple Top Pattern
Decreasing Volume on Peaks: In a valid Triple Top, volume usually drops with each rally. The first peak has the highest volume; the second is lower; the third is the lowest.
Breakout Confirmation: A breakdown below support should be accompanied by a surge in volume. Weak volume breakdowns are often false signals.
2. Additional Confirmation Signals in a Triple Top Pattern
Bearish Divergence: Look for RSI or MACD readings forming lower highs while price makes three peaks.
Resistance Zones & Trendlines: Peaks aligned with strong resistance or trendlines strengthen the pattern.
Market Context: Triple Tops formed during a bear market are generally more reliable than those that occur in a strong bull trend.
Other Tools: Fibonacci retracements or moving averages can add extra confirmation.
Triple Top Pattern vs. Other Patterns
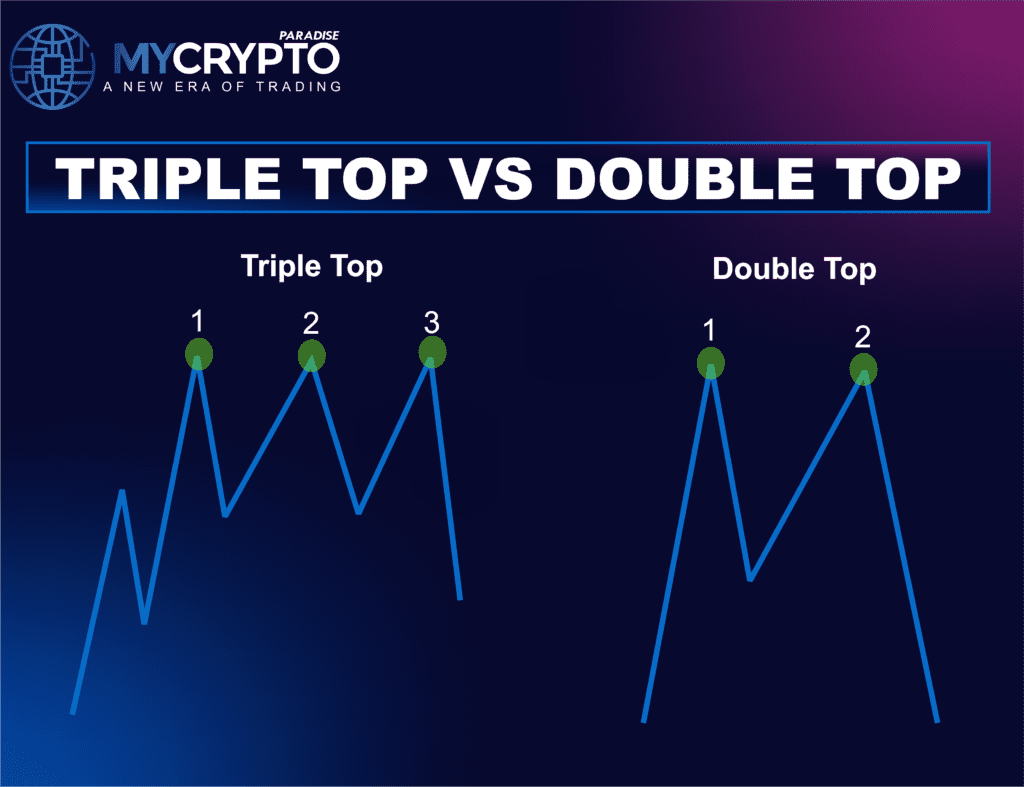
Triple Top vs. Double Top: A Double Top forms when the price reaches the same resistance level twice, whereas a Triple Top forms after three peaks at the same level. Importantly, the Triple Top generally provides a stronger bearish signal because the price was rejected three times instead of two.
Although both patterns require a breakdown below support to confirm the reversal, the additional failed attempt in a Triple Top therefore builds greater confidence in the pattern’s reliability.
Want to learn more about? Double Top Pattern: How to Spot Market Tops Before a Crash
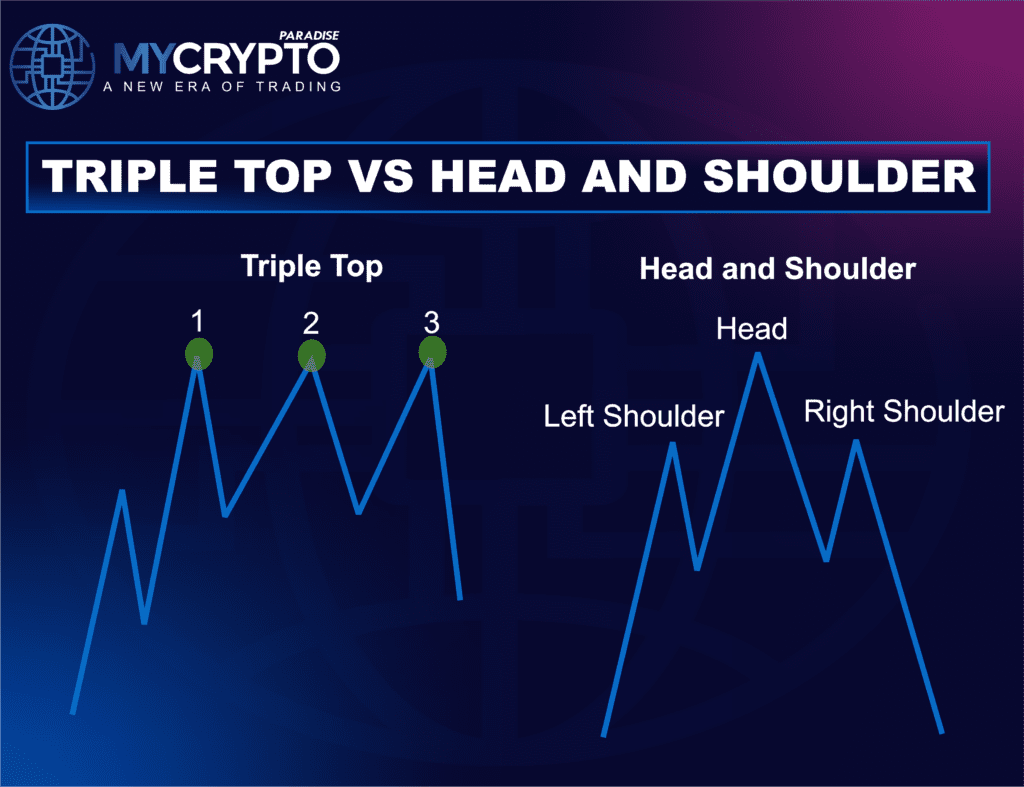
Triple Top vs Head & Shoulders: A Head & Shoulders pattern also forms with three peaks; however, the middle peak (the head) is higher than the other two. In contrast, a Triple Top features three peaks that are roughly equal in height. Therefore, if the middle peak is noticeably taller, it is likely a Head & Shoulders pattern rather than a Triple Top.
The Triple Top Pattern is often considered more reliable than Head & Shoulders because it reflects repeated rejection at a defined resistance level. Consequently, it signals deeper buyer exhaustion and a clearer supply zone, offering lower-risk entry opportunities.
Want to learn more about? Head and Shoulders Pattern in Crypto Trading: A PRO’s Guide
Pattern Strength: The Triple Top Pattern, Double Top, and Head & Shoulders are all bearish reversal patterns, but they differ in structure and reliability. A Double Top forms after two failed attempts at resistance, while a Triple Top requires three rejections, making it a more confirmed sign of exhaustion. In contrast, the Head & Shoulders pattern features a higher middle peak (the head), indicating a final push before reversal. Although all three patterns require a neckline breakdown for confirmation, the Triple Top often reflects a more prolonged struggle at resistance.
Comparative Table of patterns:
| Feature | Triple Top | Double Top | Head & Shoulders |
| Number of Peaks | 3 peaks at roughly equal highs | 2 peaks at roughly equal highs | 3 peaks (the middle peak is higher than the other two) |
| Peak Structure | All highs are approximately equal | Both highs are approximately equal | Left shoulder < Head > Right shoulder |
| Pattern Type | Bearish reversal | Bearish reversal | Bearish reversal |
| Market Psychology | Repeated failure at resistance (three rejections show a strong supply) | Two failures at resistance | The final strong push (head) fails, signaling exhaustion |
| Confirmation Trigger | Close below the neckline/support | Close below the neckline/support | Close below the neckline |
| Neckline Formation | Horizontal support level | Horizontal support level | Can be horizontal or sloping |
| Reliability | Generally higher (if fully formed and confirmed) | Moderate | High (widely regarded as one of the most reliable reversal patterns) |
| Failure Scenario | A break above the resistance invalidates the pattern | A break above the resistance invalidates the pattern | Break above the right shoulder invalidates the pattern |
| Stop-Loss Placement | Above the highest peak | Above the highest peak | Above right shoulder (conservative: above head) |
| Target Projection | Height (peak to neckline) projected downward | Height (peak to neckline) projected downward | Height (head to neckline) projected downward |
| Time to Form | Longer (requires 3 rallies) | Shorter | Medium |
| Strength of Bearish Signal | Strong (multiple rejections) | Medium | Strong |
Common Mistakes When Trading the Triple Top Pattern
Entering Before Confirmation of the Breakdown: One of the most common mistakes beginners make when trading the Triple Top Pattern in crypto is entering too early. Simply identifying three peaks is not enough. The pattern is only confirmed once the price breaks and closes below the neckline. Failing to confirm this often leads to incorrect entries and unnecessary losses.
Ignoring Volume During Breakdown: Furthermore, ignoring volume is a critical mistake in trading. Specifically, a valid breakdown requires strong selling pressure for confirmation. However, low-volume breakdowns indicate weakness and significantly increase the probability of false moves.
Trading Without Proper Risk Management: Many beginners execute trades without a stop-loss, leaving their positions vulnerable to substantial downside risk. A well-defined stop-loss above the peaks establishes the invalidation level and preserves capital. Therefore, trading without a structured risk plan is unacceptable in professional crypto trading.
Conclusion
The Triple Top Pattern can give you a clear edge, but only if you trade it with discipline and proper confirmation. Most traders fail because they ignore volume, risk management, and market structure. If you’re serious about improving your results, start applying these principles and trade with a structured approach, like a professional.
At ParadiseFamilyVIP🎖️, crypto traders dive deep into setups like the triple top, learning exact entry rules, how to spot momentum, and how to handle risk like a pro.
👉 Join ParadiseFamilyVIP🎖️ to trade with confidence, structure, and precision. Limited slots are available, so secure your place or join the waiting list to stay ahead of high-momentum market moves.
Triple top pattern FAQ
What is a triple top pattern in crypto?
It is a bearish reversal pattern that appears after a sustained uptrend, formed by three peaks at roughly the same resistance level. The repeated rejection shows buying strength is fading and control is shifting from buyers to sellers.
How do you confirm a triple top?
Wait for a decisive close below the neckline, the support line connecting the pullback lows between peaks. A breakdown backed by a clear rise in volume confirms the pattern, while a weak-volume break is often a false signal.
How is the triple top price target calculated?
Measure the vertical distance from the peak resistance down to the neckline. Then project that same distance downward from the breakdown point to estimate a reasonable downside target.
Is a triple top stronger than a double top?
A triple top generally gives a stronger bearish signal because price was rejected at resistance three times instead of two. Both patterns still require a confirmed close below support before the reversal is valid.
Crypto trading involves substantial risk of loss. This article is educational and is not financial advice. Past performance does not guarantee future results. Always do your own research.
What is different here
Most guides stop at the theory. The MyCryptoParadise team shares the live trades, and the reasoning behind each one, inside ParadiseFamilyVIP. Everything here is education, not financial advice.
Crypto trading involves substantial risk and is not suitable for everyone. Nothing here is financial advice; it is education only. Never risk more than you can afford to lose.


Join the discussion
No comments yet. Pro Paradiser members, share how you are reading this.