

In short
A liquidation is a forced exit: when a leveraged position runs out of margin, the exchange closes it at market, and that forced order pushes price the same way the trader feared. Our MCP Insights liquidation data recorded a lopsided flush on 4 September 2026: $7.1 billion of Bitcoin short positions closed against $2.7 billion of longs, a 2.6 to 1 skew toward squeezed shorts. We read that as neutral with a defensive lean, explicitly not a bullish signal: forced short-covering is spent fuel, not fresh demand. Base rates for cascades this size are not wired into our data yet, so we claim no historical frequency and no target. The observation is the asymmetry itself, dated and sourced. This piece shows you how to read a liquidation cascade yourself, and which level would flip the lean.
Key facts
- BTC spot at the reading
- $79,617
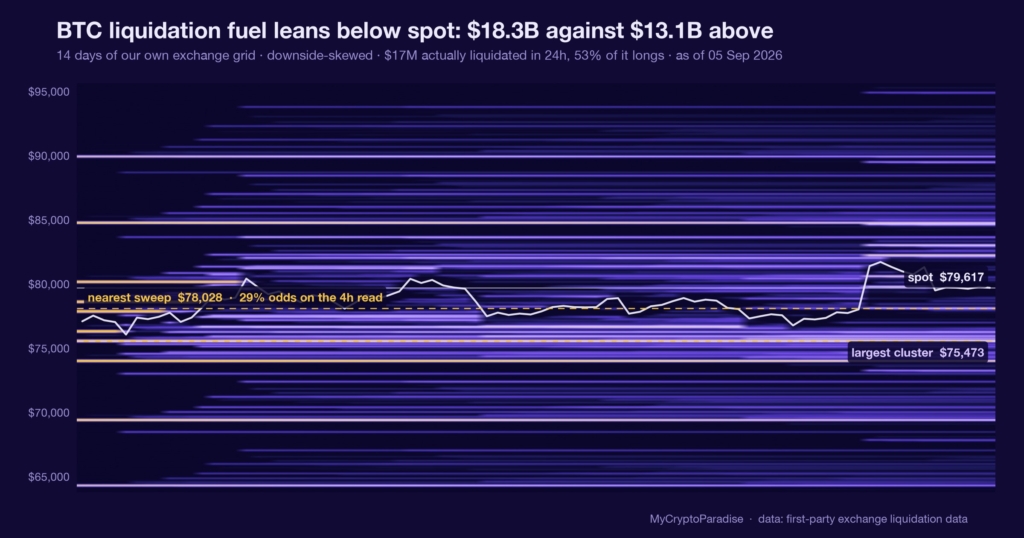
- Estimated BTC liquidation fuel above spot
- $13.11B
- Estimated BTC liquidation fuel below spot
- $18.27B
- Fuel balance
- downside-skewed, -16 points toward the heavier side
- What would prove this read wrong
- A daily BTC close back above the 4 September squeeze high, which would show fresh chosen demand replaced the forced short-covering and rebalance the liquidation skew.
- Reading taken
- 05 September 2026
- Source
- Our MCP Insights tools, from first-party exchange data
Forced exits move price, not opinion
A liquidation is not a trade anyone chose to make. When a leveraged position runs out of margin, the exchange closes it at market, and the direction of that forced order is fixed by which side was caught: a squeezed short must buy, a stopped-out long must sell.
That distinction is the whole of the read. Short liquidations are forced buying. Long liquidations are forced selling. A session where one side dwarfs the other is telling you which crowded, over-leveraged bet just got run over, and in which direction the forced flow had to point.
Forced flow is the least emotional buyer in the market. It buys because it has to, not because it believes. Fuel that buys under duress is fuel that does not come back.
The 4 September flush ran the shorts
Our MCP Insights liquidation data recorded the cascade at 18:30 UTC on 4 September 2026: $7.1 billion of Bitcoin short positions were force-closed against $2.7 billion of longs, a combined $9.8 billion cleared in a single window.
Shorts were 72 percent of that liquidated notional and longs 28 percent, a 2.6 to 1 skew against traders positioned for a fall. The feed flags max pain to the downside, which is the tell that the up-move was powered by covering rather than by conviction.
One caveat sizes everything under it: these are feed figures we could not re-verify against the live grid this window, so we attribute them to the source and read the shape, not the decimal. A number you cannot re-verify is an asymmetry, not a precise price.
What is different here
The ParadiseTeam does not treat a liquidation headline as a verdict. We separate forced flow from chosen flow, weigh the short-against-long skew beside funding and open interest, and refuse to quote a frequency we have not measured. The method is subtraction: what the number cannot support gets dropped.
A short squeeze is not a green light
The obvious misreading is that $7.1 billion of dead shorts means capitulation is finished and only upside remains. Read it the other way: that buying already happened, at market, under margin calls. The positions that might have chased higher are the positions that were just closed.
This is one input, and today it is the input that disagrees with the tape’s optimism. It sits alongside funding, open interest (OI) and spot absorption, and when a squeeze this size leaves funding still positive, longs are paying to hold a move that its forced buyers have stopped supporting.
A cascade that only quotes its bullish half is marketing. The half that decides the next move is what happens once the forced buyers are gone.
We have one event, not a distribution
Base rates for liquidation cascades of this magnitude are not wired into our data yet. That means we cannot tell you how often a 2.6 to 1 short flush has resolved lower within a week, because we have not measured it, and we do not recall numbers from memory.
So this stays an observation, not a probability: the asymmetry is real and it is large, and that is the entire claim. What converts it is stated plainly in the invalidation below, not buried inside a forecast dressed up as certainty.
One event is an anecdote with a timestamp. We publish the shape honestly and let the invalidation level, not our confidence, decide whether the read was right.
Reading a liquidation cascade yourself, step by step
- Split the total into short and long liquidations: the larger side names who was forced, and that names the direction of the forced flow.
- Compute the skew as a ratio, not a raw dollar figure, so a busy day and a quiet day stay comparable.
- Check funding at the same moment: if shorts were squeezed yet funding stays positive, longs are still paying to hold the move.
- Read open interest alongside it: falling open interest during the flush means positions closed, rising means fresh leverage replaced them.
- Mark the invalidation level before you form a lean, so a single reclaim of that level ends the read cleanly.
Most skip the funding cross-check and stop at the headline dollar figure. The squeeze size tells you what happened; funding tells you whether anyone still believes it.
Every number above is checkable against the live data. Start with the crypto liquidation heatmap, then cross-read the Bitcoin max pain tracker and the MCP Insights hub.
Act and invalidate
| Scenario | What confirms it | What kills it |
|---|---|---|
| Squeeze exhausts, price fades | Funding cools, no new highs | Daily close above the squeeze high |
| Fresh demand takes over | Rising open interest, higher low holds | Funding flips negative on a drop |
| Chop, no edge either way | Range holds both directions | A clean break on rising volume |
Posture: Defensive while the forced-buying high caps price. This is a lean worth one line of risk, not a position: size small, and stand down entirely if that high is reclaimed on a daily close.
Frequently asked questions
What does a short liquidation actually mean?
It means a trader betting on a fall ran out of margin and the exchange bought to close the position for them. That forced purchase pushes price up mechanically, regardless of whether anyone chose to buy at that level.
Does a big short squeeze mean price goes higher?
Not on its own. The buying a squeeze produces is forced and finite: once the trapped shorts are closed, that specific demand is gone. Whether price holds depends on fresh, chosen buyers arriving after the cascade, which the liquidation figure alone cannot show.
Why do you not give a probability here?
Because we have not measured one. Base rates for cascades this large are not wired into our data yet, and quoting a frequency from memory would be invented. We state the asymmetry we can see and attach a level that would prove us wrong.
What is max pain in this context?
Here it is the feed’s shorthand for the price zone where the largest cluster of leveraged positions would be liquidated next. It points to where forced flow is most likely to accelerate, not to a target price anyone is promising.
How should a trader use this reading?
As one risk input, not an entry. It argues for a defensive posture while the squeeze high caps price, and it stands down the moment that level is reclaimed. Pair it with funding and open interest before it changes how you size anything.
Crypto trading involves substantial risk and is not suitable for everyone. Nothing here is financial advice; it is education only. Never risk more than you can afford to lose.
The private Extras feed, where the liquidation cascade, the short-versus-long skew and the funding cross-check update intraday with invalidation levels attached, is part of PRO Paradiser, the intelligence layer behind the ParadiseFamilyVIP strategies.














Join the discussion 4
Yeah, I saw that spike... been glued to the charts all week. 📊 So is the idea that we can use this to anticipate the next dip? 🤔
The asymmetry here is quite telling, but where is the liquidity coming from to even support this much forced buying? It feels thin.
Forced buying on thin books means greater slippage risk. Where is that factored in?
Exactly. The more interesting question is who has size on the other side when it goes the other way..