

In short
Overhead supply is the stack of coins held by wallets whose cost basis sits just above the current price: latent sellers who tend to unload near break-even, which caps rallies. The 19 August 2026 short squeeze pushed Bitcoin above $80,000, then stalled beneath the $83,000 to $86,000 long-term-holder supply zone and slid back to roughly $76,000. With price near $78,000, the share of supply in profit had climbed to 68 percent from 65 percent in May, which means more coins are eligible to sell. We call this range-bound and defensive, not a top: $62,000 to $65,000 is the floor that matters. The August squeeze already graded as a failed breakout, so the level held. This piece shows you how to read overhead supply yourself, before it caps the next attempt.
Key facts
- BTC spot at the reading
- $77,785
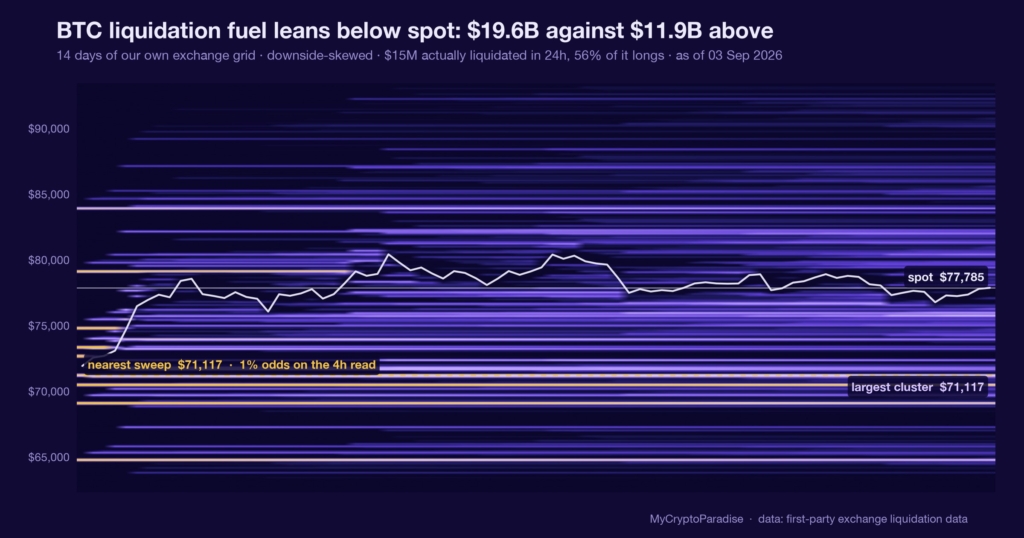
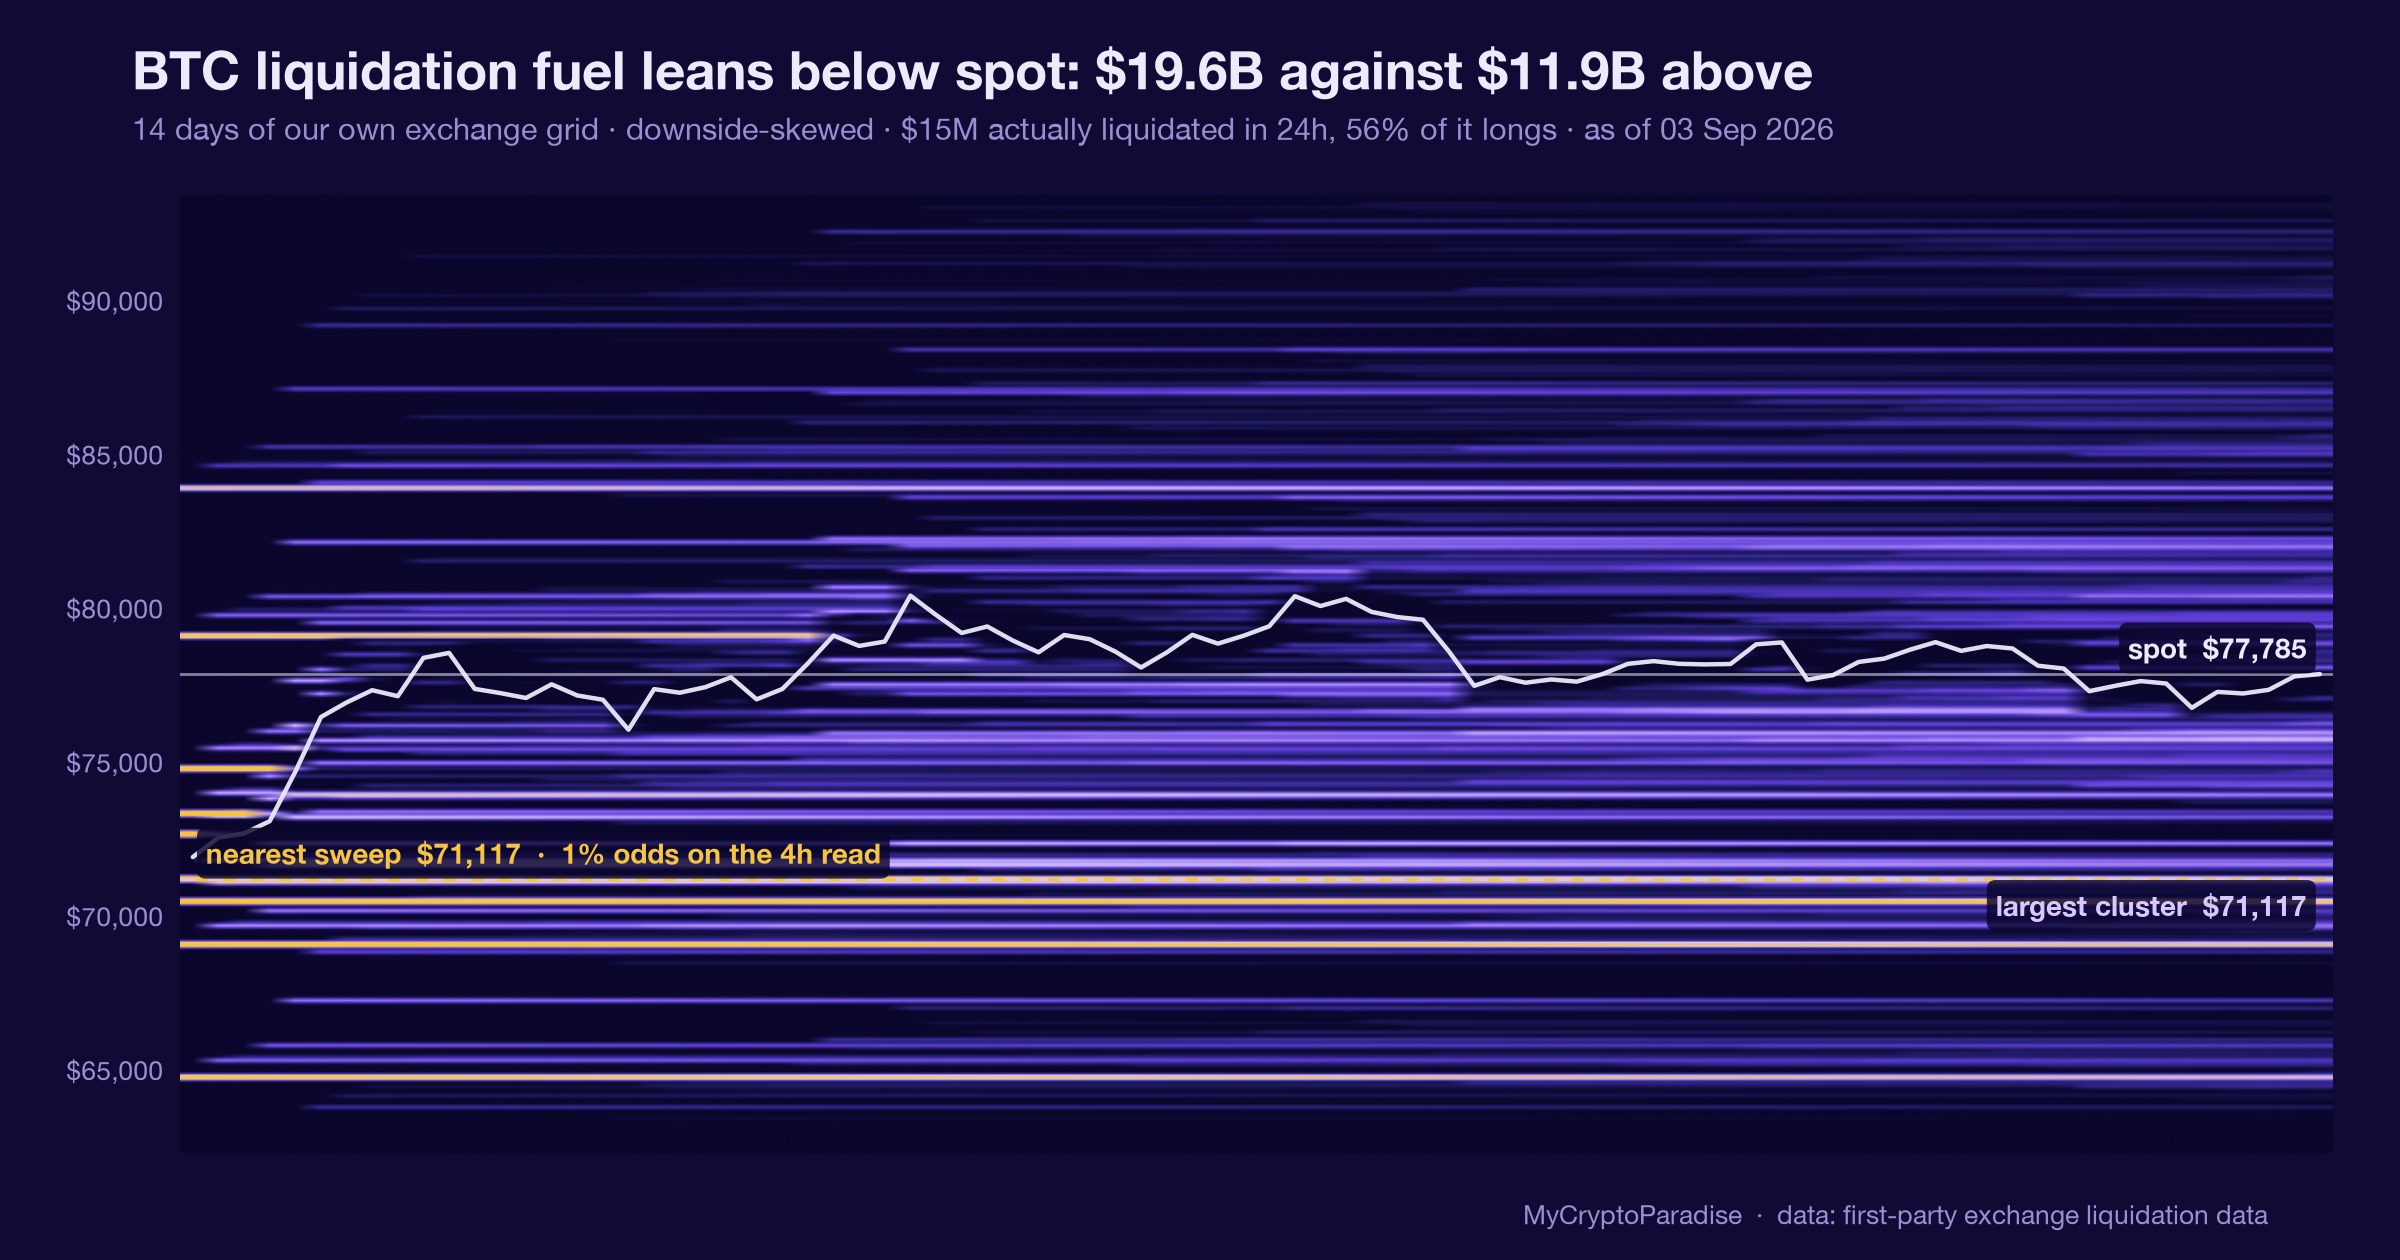
- Estimated BTC liquidation fuel above spot
- $11.92B
- Estimated BTC liquidation fuel below spot
- $19.61B
- Fuel balance
- downside-skewed, -24 points toward the heavier side
- What would prove this read wrong
- A daily BTC close above $86,000 that absorbs the long-term-holder supply zone and lifts price out of the $62,000 to $86,000 range, flipping the read from capped to breakout.
- Reading taken
- 03 September 2026
- Source
- Our MCP Insights tools, from first-party exchange data
Overhead supply is a wall of break-even sellers
Every coin has a cost basis: the price its current holder paid. When a large band of holders bought just above where price trades now, they sit at a small loss and wait. The moment price returns to their entry, many sell to escape flat, and that selling is mechanical rather than emotional.
This is why resistance is rarely a single line. It is a zone thick with supply that changes hands, and price has to absorb every seller inside it before it can move on.
A ceiling made of other people’s regret is heavier than one drawn on a chart. It moves only when the sellers behind it are exhausted.
The August squeeze stalled at the supply zone
The 19 August 2026 short squeeze drove Bitcoin above $80,000 before it stalled under the $83,000 to $86,000 long-term-holder supply zone and retreated to about $76,000.
As price traded near $78,000, the share of supply in profit rose to 68 percent, up from 65 percent in May: more coins above water means more hands able to sell into strength. On-chain cost-basis data marks $62,000 to $65,000 as the support that matters and $83,000 to $86,000 as the resistance.
In options, the 7-day 25-delta skew spiked as traders chased upside calls during the squeeze, then reverted toward neutral, while the 180-day skew held steady. The 25 September 2026 quarter-end expiry carries roughly $14 billion in open interest (OI) across Deribit and IBIT, much of it positioned above $80,000.
Two gauges cooled at once: spot rejected the supply, and short-dated options gave back their squeeze premium. A rally that loses both its buyers and its call demand at the same wall is telling you where the sellers live.
What is different here
The ParadiseTeam does not treat a resistance zone as a line to guess at. We read the supply behind it: how many coins sit in profit, where their cost basis clusters, and whether options and liquidation data agree the wall is real before we weight any bias toward it.
Supply in profit is pressure, not a sell trigger
The easy misread is that 68 percent of supply in profit means a top is in. It does not. That figure counts coins able to sell, not coins that will, and profit-taking accelerates only when price fails at resistance, which is exactly the test underway now.
This is one input. Our MCP Insights liquidation-heatmap data shows the same range structure, and it sits alongside funding and open interest rather than overriding them: today all of them point to a market grinding through overhead supply before it can trend.
A metric that tells you where sellers are able to act is not a timer. It is a map of the resistance, and the map is only useful next to the level that confirms it.
The range holds until the supply is absorbed
Since the August rejection, Bitcoin has done what a supply-capped market does: it has ranged, not trended. On the cost-basis read, it stays range-bound until the overhead supply zone is absorbed, and nothing in the options term structure argues otherwise yet.
The heavier tell is positioning into quarter-end. With roughly $14 billion in open interest concentrated above $80,000 for the 25 September 2026 expiry, a push into the supply zone would meet both spot sellers and dealers hedging that strike.
Range-bound is not a failure to have a view. It is the view: the higher-probability path is sideways until one edge breaks, and edges that are defended by real supply break last.
A breakout must absorb the whole zone
The bullish case is not dead; it is deferred. For the range to resolve up, price must not merely tick above $86,000 but close there and hold, absorbing the long-term-holder supply rather than borrowing momentum from another squeeze.
The options data is the caution flag. The 7-day skew that spiked during the squeeze has already reverted toward neutral while the 180-day skew barely moved, which reads as fading short-term enthusiasm on top of unchanged longer-term demand.
A rally that needs a squeeze to reach resistance, and loses its call bid on arrival, is not the same as demand strong enough to eat through supply. The distinction is the whole trade.
Reading overhead supply yourself, step by step
- Pull up the long-term-holder cost-basis bands and mark the price zone where the largest cluster of holders sits just above spot.
- Check the share of supply in profit: a rising figure into resistance means more coins are able to sell, not that they must.
- Overlay the liquidation heatmap to see whether resting leverage sits above or below price, and which side holds more fuel.
- Read the short-dated options skew: chased upside calls that revert to neutral signal a squeeze fading, not fresh trend demand.
- Set your invalidation at the far edge of the supply zone, and treat a daily close beyond it as the level being absorbed.
Most skip the skew step: they see price at resistance and assume conviction, when reverting call demand often means the move was short-covering that has already run its course.
Every number above is checkable against the live data. Start with the crypto liquidation heatmap, then cross-read the Crypto Fear and Greed Index and the MCP Insights hub.
Act and invalidate
| Scenario | What confirms it | What kills it |
|---|---|---|
| Range holds under supply | Rejection near $83,000 on rising sell volume | Daily close above $86,000 |
| Downside test of the floor | Break below $65,000 support | Reclaim of $65,000 to $70,000 |
| Breakout absorbs supply | Daily close above $86,000 holds | Fade back under $80,000 |
Posture: Defensive into the supply zone, patient at the floor: the higher-probability stance is no new risk until price closes beyond one edge of the range.
Frequently asked questions
What is overhead supply in Bitcoin?
Overhead supply is the amount of Bitcoin held by wallets whose cost basis sits just above the current price. These holders are latent sellers who often exit near break-even, so their coins form a resistance zone that price must absorb before it can climb.
Why does supply in profit matter here?
A high share of supply in profit means many coins are trading above what their holders paid. On-chain cost-basis data puts that share at 68 percent near $78,000, which raises the pool of holders able to sell into strength, though it does not force them to.
Is 68 percent supply in profit bearish?
Not on its own. It measures selling capacity, not intent. Profit-taking tends to accelerate only when price is rejected at resistance, so the figure matters most as confirmation once the $83,000 to $86,000 zone turns a rally back, not as a standalone signal.
What levels define the current Bitcoin range?
On-chain cost-basis data marks $62,000 to $65,000 as the support that matters and $83,000 to $86,000 as the main resistance, the long-term-holder supply zone. Bitcoin is range-bound between them until the overhead supply is absorbed by a decisive daily close beyond either edge.
How does the September expiry affect this?
The 25 September 2026 quarter-end expiry carries roughly $14 billion in open interest across Deribit and IBIT, much of it positioned above $80,000. A push into the supply zone would meet both spot sellers and dealers hedging those strikes, adding friction to any breakout.
Crypto trading involves substantial risk and is not suitable for everyone. Nothing here is financial advice; it is education only. Never risk more than you can afford to lose.
The private Extras feed, where the overhead-supply map, supply-in-profit share and liquidation-heatmap reads update with their invalidation levels attached, is part of PRO Paradiser, the intelligence layer behind the ParadiseFamilyVIP strategies.














Join the discussion
No comments yet. Members, share how you are reading this.