

In short: In this Thursday breakdown, Simon turns bearish on Bitcoin’s daily chart after BTC hit his $79,000 target and printed a shooting star. He tracks a mysterious whale shorting $40M against BTC and ETH, expects a move toward the $55,000 to $44,000 exchange-of-hands zone. And waits for confirmation before a big short.
Why did Simon turn bearish on Bitcoin after $79,000?
Track it live: our live crypto funding rates updates in real time, so you can watch this shift for yourself.
Bitcoin hit Simon’s $79,000 target, then printed a shooting star on the daily chart. The bears are defending $79,000 hard, and bulls have not closed a single daily candle above it. After weeks bullish, the ParadiseTeam flipped bearish and stopped reaccumulating.
Simon had been reaccumulating Bitcoin near $61,000 with Paradise VIPs. With the target reached and the shooting star at the top of the uptrend, he is no longer interested in reaccumulation. He noted no bearish engulfing candle followed, but the signal still stands.
What is the mysterious whale doing at $40 million?
A mysterious whale opened roughly $40 million in short positions against Bitcoin and Ethereum. Simon frames it as the whale absorbing retail buying pressure just as retail returns. On the spot cumulative volume delta, buyers keep pushing while price prints lower highs, which suggests that pressure is being absorbed.
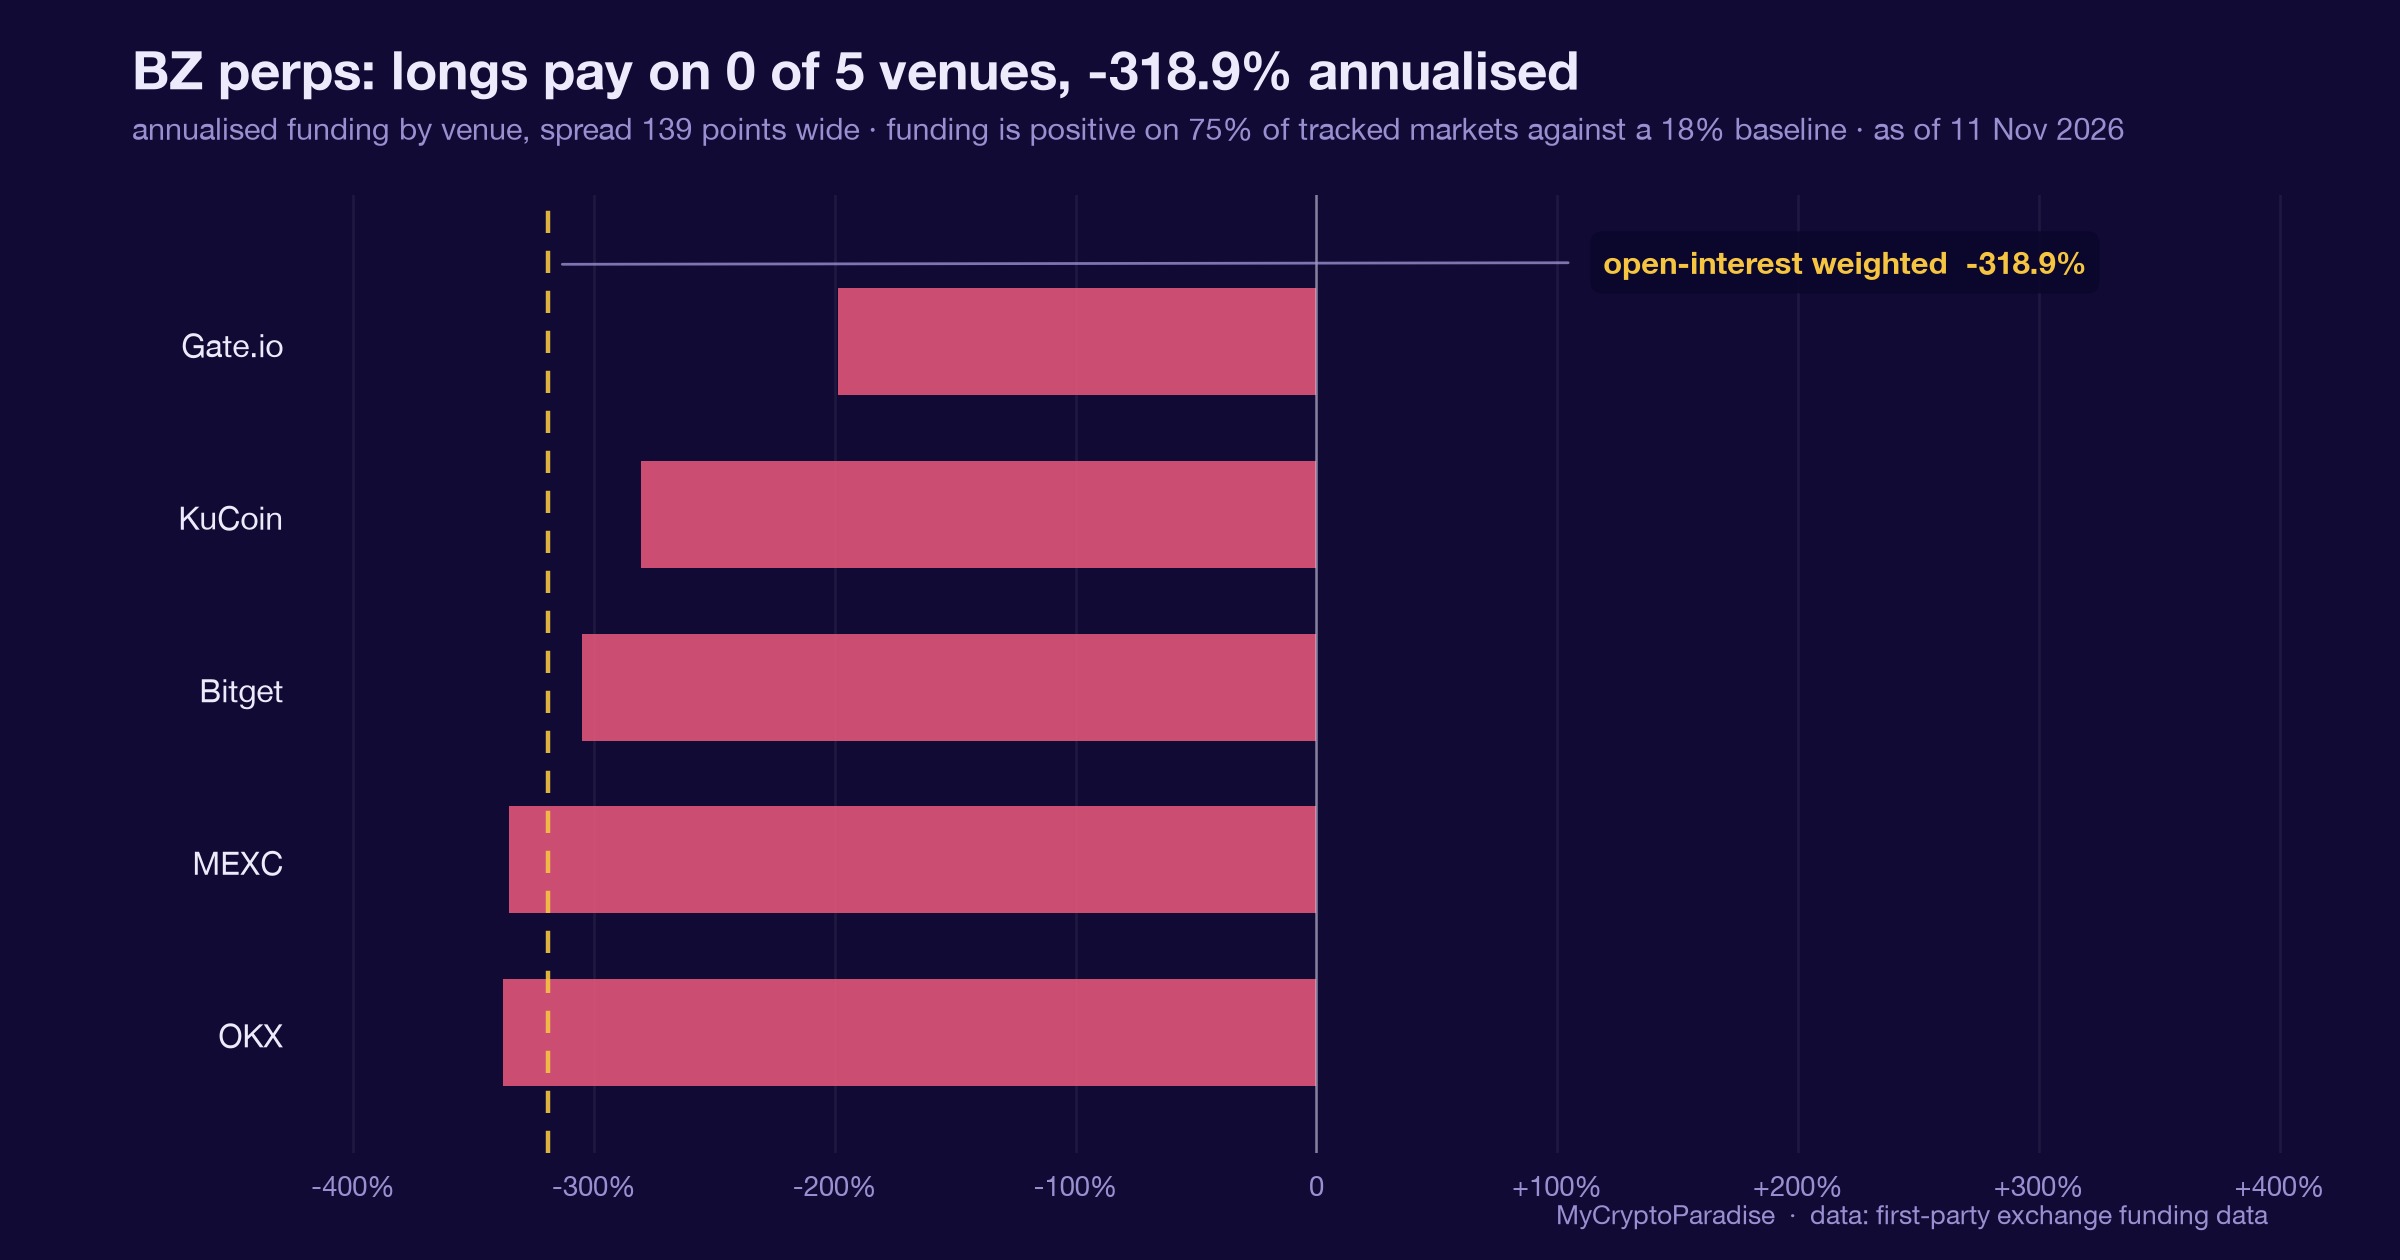
Volume is fading into higher highs and the stochastic RSI shows a bearish cross. Simon reads this as bulls losing participation. You can see this positioning play out on the funding board, where positive funding shows the long side getting crowded.
Where does Simon think Bitcoin is heading next?
Simon expects Bitcoin to work toward the next magical number, $44,000, inside a wider $55,000 to $44,000 zone he calls the exchange of hands. He compares it to the 2022 capitulation zone around $24,000 to $16,000, where bad risk managers realized losses and smart money absorbed the supply.
He distributed near $121,000 with VIPs, anticipating this reversal. The structure is a bearish ending diagonal subdividing into five waves. For the bigger picture across calls, the ParadiseTeam keeps the running Bitcoin analysis updated.
What would invalidate the bearish setup?
The setup invalidates if Bitcoin reclaims the previous high at $82,600 and turns that resistance into support. Simon marks a resistance zone around $79,000 to $82,000, with the ending diagonal void above $82,600. A clean reclaim would shift him from bearish tactics to bullish ones.
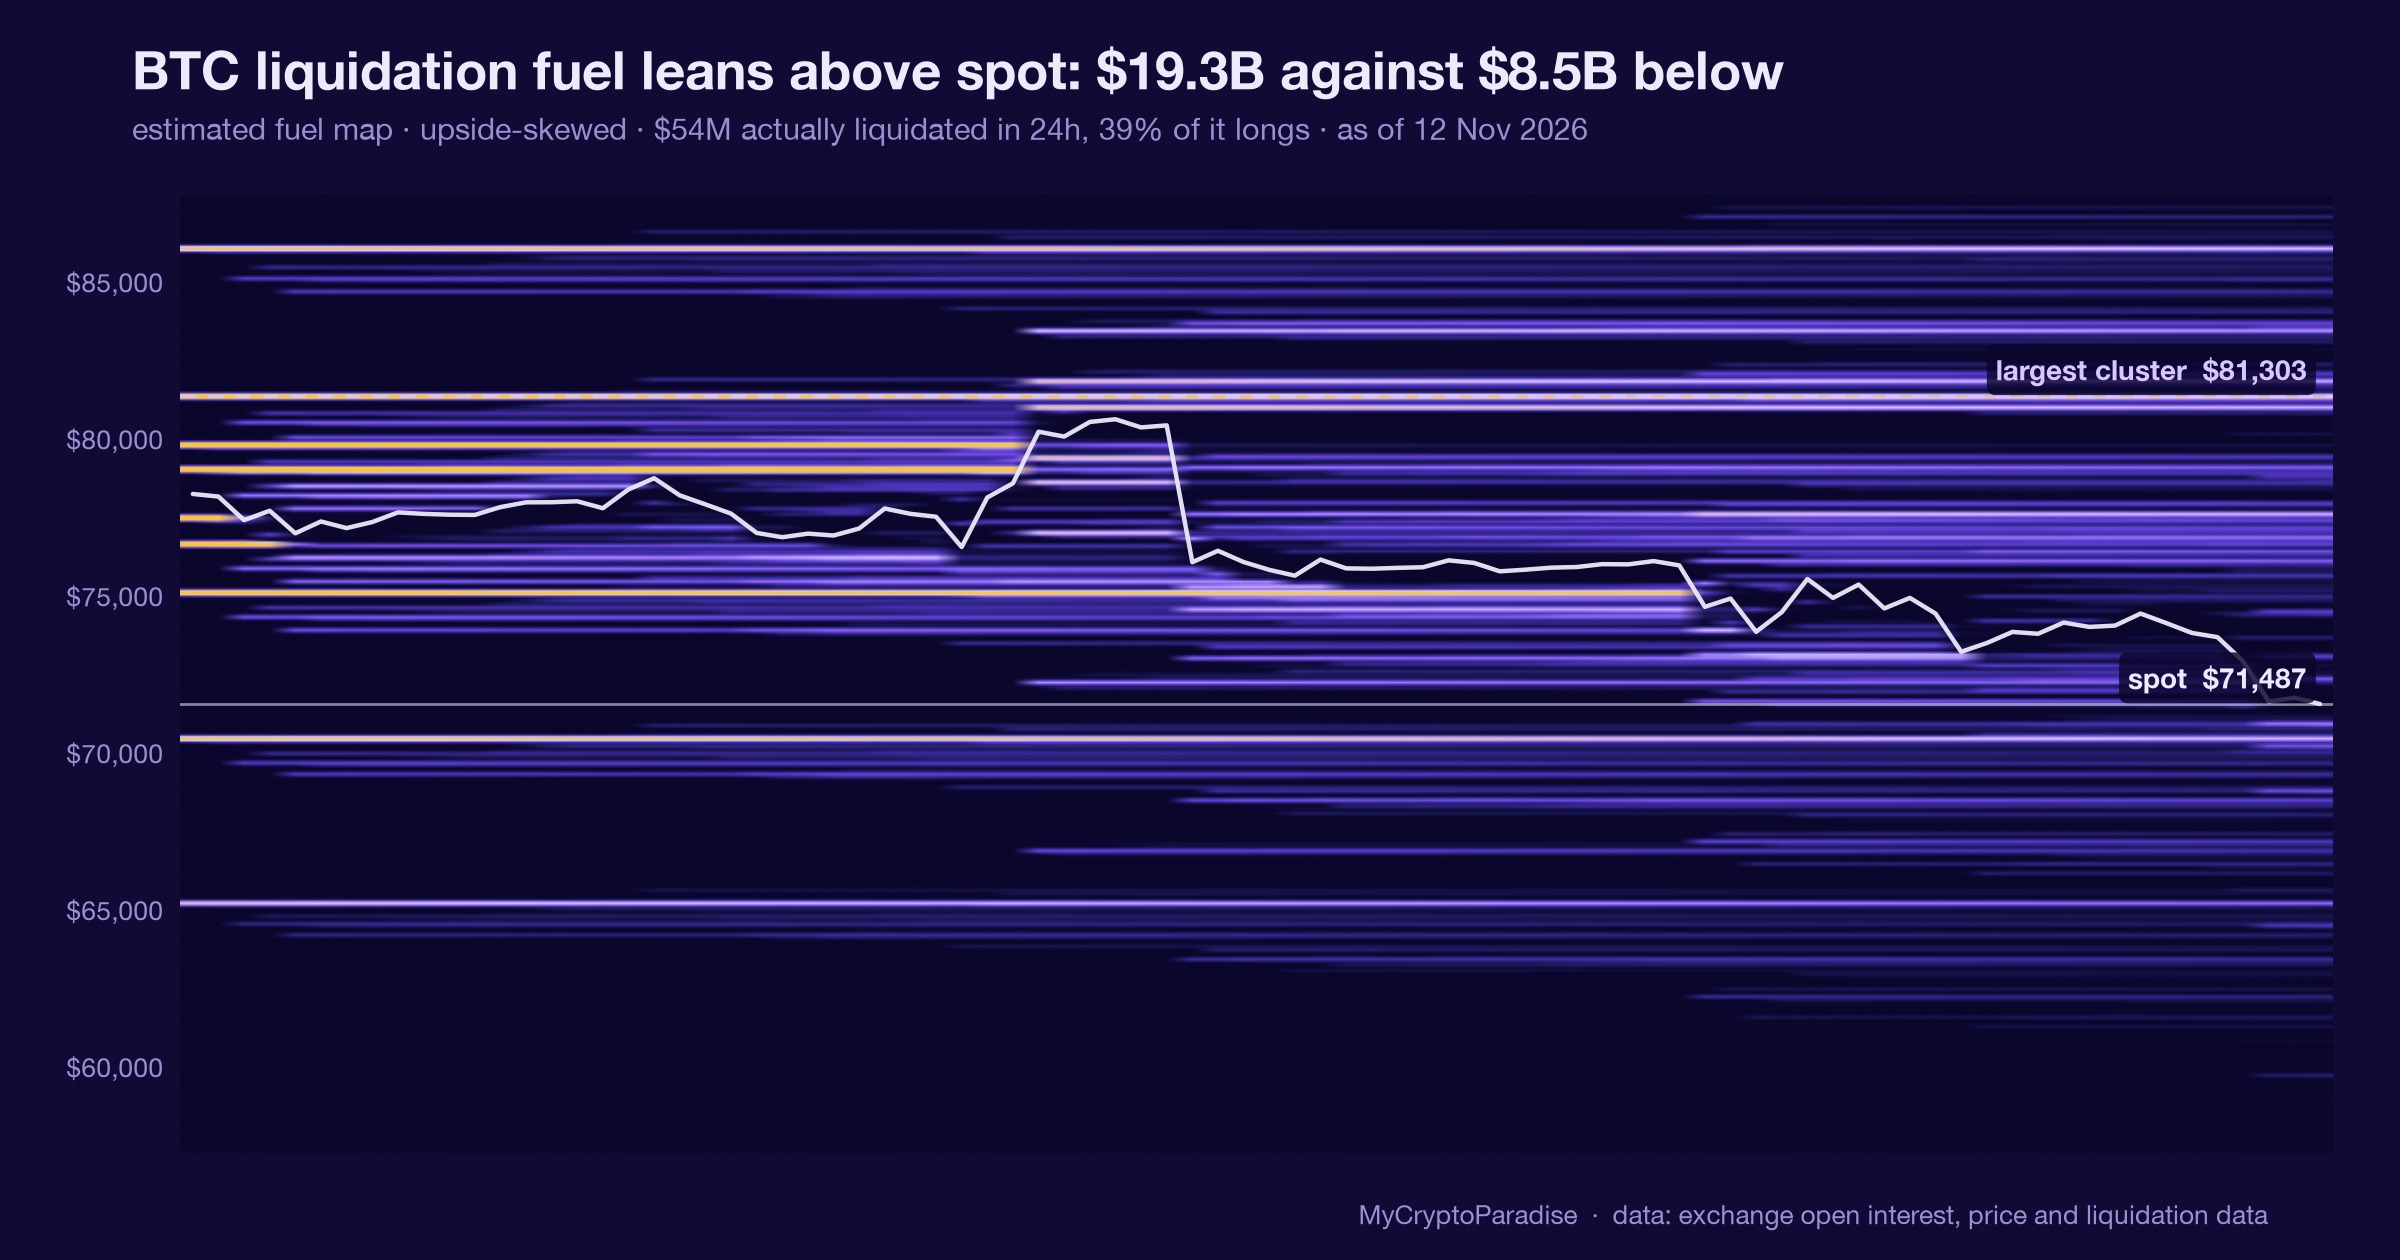
He also flags the $83,000 liquidation cluster. A push there would liquidate about $3.7 billion in shorts, versus roughly $2 billion on the downside. He warns traders who parked stops at $83,000, since a wick could hit them without breaking the bearish structure. Sizing around levels like this is why he stresses capital preservation.
What is Simon watching before he shorts?
Simon wants confirmation before entering a big short targeting prices below the previous low of $57,000. He believes the daily C wave is finishing, with the fourth wave forming and a truncated fifth to come. Only then does he expect a clean reversal.
Context supports patience. Fear and greed sits at 80, open interest is flat, and funding rates are positive with a 30% long squeeze probability. A move back to $61,000 would liquidate around $19 billion in longs. He repeats his rule: focus on process, not outcome.
Frequently asked questions
What is the Bitcoin whale doing?
Simon says a mysterious whale opened about $40 million in short positions against Bitcoin and Ethereum, absorbing retail buying pressure as retail returns. He does not claim the whale is right or wrong, only that the positioning aligns with the fading volume and spot absorption he sees on his charts right now.
Why is $79,000 important for Bitcoin?
$79,000 is the level Simon called for from $61,000, and it has now been hit. Bears are defending it strongly, printing a shooting star, and bulls have failed to close a single daily candle above it. The VPVR shows heavy activity there, making it a key battleground.
Where does Simon think Bitcoin goes next?
Simon expects a move toward the $55,000 to $44,000 exchange of hands zone, with $44,000 as the next magical number. He compares it to the 2022 capitulation zone and waits for weak holders to realize losses so smart money can absorb supply before a new cycle.
What would invalidate the bearish view?
A reclaim above the previous high of $82,600 that turns into support would invalidate the ending diagonal structure. Simon would then drop his bearish tactics and look for long setups. He also notes an $83,000 wick could liquidate shorts without breaking the daily bearish structure he is watching.
Is Simon shorting Bitcoin right now?
Not yet. Simon is waiting for confirmation before taking a big short below the previous low of $57,000. He wants the daily C wave to finish first. With the ParadiseTeam he watches for setups with clear entry and exit targets, favoring process over chasing the outcome.
MyCryptoParadise has run a professional crypto signals and trading-education service since 2016, led by founder Simon Mach and the ParadiseTeam. Simon records these sessions three times a week, and every episode lands on the Bitcoin video analysis hub.
Video transcript
Auto-captioned from the video audio and lightly cleaned, so it can contain transcription errors; the video itself is the record. It is speech, not a written article; for the structured breakdown read the sections above.
This mysterious whale bets 40 million dollars against Bitcoin and Ethereum. Just when retail is finally coming back to the market, the whale is absorbing that buying pressure and opening short positions. Is this whale onto something or will he get liquidated? Let's analyze. Hello ladies and gentlemen, this is Simon from MyCryptoParadise.
Welcome back, it's great to be here. Today is Thursday and that means that you're watching the second video of this week. so previously we talked about multiple weeks ago that from $61,000 Bitcoin will pump towards $79,000 with the highest probability. $79,000 has been hit and as you can see market participants are trying to push above our magical number $79,000 for multiple days right now.
In the previous video we were looking at this candlestick pattern and we assumed that with the highest probability we will will close it as a shooting star candlestick pattern, which happened and as you remember, this is usually visible, the shooting star candlestick pattern at tops of an uptrend.
So usually it's working as a reversal signal, because you see it at the top of the uptrends, but why? Because the bears showcase an extreme strength, ok? so that's why, because they are defending our level 79,000, there's as you can see, they are extremely strong, the bears on the daily timeframe are extremely strong and they have created this textbook, shooting star candlestick.
It is even a stronger signal if after it's shooting star, the next candle be bearish engulfing, alright, that then creates this beautiful candlestick pattern, bearish engulfing candlestick pattern, which it has not happened, alright. but still this shooting star candlestick is there and as you can see the body of that candle precisely they have pushed below our level $79,000 ladies and gentlemen and on the VPVR you can see that we are having
an extreme activity around this level it's extremely important level the $79,000 and so far for multiple days the bulls are trying to push above it but but as you can see they have been unsuccessful to close even a single daily candle above it just yet.
So that's bearish, right? That is also why I have turned after many weeks, you remember, for multiple weeks I was bullish on the daily timeframe, right? Remember that I've been bullish for multiple weeks on the daily timeframe and on the daily the time frame, I right now have turned after we have hit our target $70,000 actually turned bearish.
So I'm no longer interested into re-accumulation, I have been re-accumulating with ParadiseFamilyVIP's Bitcoin right here at $61,000, I'm no longer re-accumulating and if you are in ParadiseFamilyVIP, you exactly know what we have done with our re-accumulation at this level, right here at this zone.
and right now the probabilities just suggest that the weekly time frame is showing the thing that we are expecting since 109 and 121 thousand dollars. And that is that we are going down towards the next magical number 44 thousand dollars. So as you remember back when Bitco was trending around 121 thousand dollars with Paradiser and EIPs that we have taken that as another opportunity to distribute, distribute our Bitcoins, because we have
anticipated that with the highest probability Bitcoin will actually have a reversal, alright, and will no longer continue to the upside, but will have a reversal and we will start shifting towards this zone 55 to 44 thousand dollars, which is an extremely important zone.
In my opinion, it's the same zone as we have had back in 2022 that we have called an Exchange of Hands zone in 2022 that was around $24,000 to $16,000. That was the zone where the capitalization happened, right? That was the zone where the capitalization happened and basically as we can see on our for net unrealized profit and loss back in 2022.
The institutions and traders that were not able to manage their risk well, they needed to capitulate mostly the Bitcoin mining companies in order for them not to go bankrupt and to survive and they've capitulated and sold all of their Bitcoins in a loss.
We already know that right now multiple companies they They are holding their Bitcoins in a loss, and we have went close to the capitulation number below zero, but we still see that even though the pressure was high for multiple weeks on them, they have naturalized their losses.
So they are holding their losses still, but they have naturalized their losses. And for the exchange of the hands, we really need those bad risk managers to realize their air losses in order for the smart money to absorb that selling pressure, accumulate, re-accumulate and then we can start the bull market.
Since 2011, this exchange of hands magic always happened during the bear markets and it was the key event before we could have a new bull market cycle. So from a technical perspective, from price action perspective development, this is nicely playing to what we are expecting since that $121,000.
And that is a wave structure that is subdividing itself into 500-degree waves that will take us towards that exchange of the hand zone that will with the highest probability be around $55,000 to $44,000. So so far, as you as you know, because you are watching these videos to three times a a week, actually Tuesday, Thursday and Saturday I'm recording for you these videos here on YouTube exclusively on YouTube for free and
you know that we are expecting those five waves so one, two, create it, three, fourth wave create it and right now we are having the extended fifth wave since the third wave has not been the extended one which usually is but sometimes it is not and from the guidelines of Alio Wave we know henceforth that the last motive wave wave structure should be the extended one, right?
So that is why you can see beautifully the sub-waves of the 5th wave and as you already know it will from the perspective of what we are seeing on the on-chain be an ending diagonal alright and it will nicely give the opportunity for the market makers to re-accumulate safely that exchange of the hands zone.
So far, we know that the ending diagonal is subdivided itself into 5 smaller waves, right? So let me show you right here, ending diagonal, this is a bullish ending diagonal but the same structure is when it is bearish ending diagonal, 5 sub-waves, all of them, corrective wave structures, so this was a corrective wave zigzag structure that was the first wave of the ending diagonal.
Right now, we are touching beautifully our resistance right here as you can see and we we are creating the secondary wave which was the ABC Expanded Flat structure, so this was a zigzag, this is the expanded flat with the highest probability which is not yet finished, we will talk about it and once this one is finished and if we can defend this resistance on the weekly timeframe at around 79 to that
82,000, because the invalidation is extremely in the close right now. And it's very simple. If we will start reclaiming above the previous high $82,600, then the ending diagonal structure will be invalidated, right? That is why we have this resistance zone right here. We counts are passable and actually might happen because if we take a look right now at the Bitcoin exchange liquidation map, some of the people, not a lot of them,
like minority of people, but there's a cluster of people that actually starting to short and as you can see they have their liquidation levels structured around 83,000 dollars. If you will actually push towards that 83,000 dollars, 3.7 billion dollars worth of short positions will be liquidated.
So from the short-term perspective there is this kind of imbalance on the upside because the similar length 30 downside, we will not liquidate that much, only 2 billions, but take a look at this. So if you are having a short position on right now, without confirmation, I don't know if you have it, it depends on what kind of trader are you, it depends really on what kind of trading tactics, what kind
of trading strategy you have, but for some reason, you might have such a short position where you have placed your stop loss at this weird number, $83,000, which is not above my resistance, right? It's exactly at that resistance, so I don't know, but some people think like it's a smart level to get liquidated or to put their stop losses.
So if you are having their stop losses or your stop losses or your liquidation level at that $83,000, I would be careful. Okay, Paradiser, I would be careful. I think like you are much I don't think you are being at this cost right now, but the people that are there should be careful, should be quite worried to be honest, because they might get liquidated and it wouldn't break the battery structure that
we are watching on the daily time frame, ok? So there might be a really weak like this and it wouldn't invalidate this battery structure that we are watching, if however we will start reclaiming the resistance and it will will start turning into a support that will be reclaim of this previous high, successful one, it won't be a fake out, and I will not be scared on looking into some long positions.
Okay, so I will change from my bearish trading tactical thinking, which I have right now, I'm focused on bearish trade setups upon confirmations into bullish trading setups, right? So, you know, as a professional trader, we have strategy, we have our system, that's what we are playing based on and then once we have our bias then we need to implement our trading tactics.
So if we have bullish bias which I would have once we reclaim this resistance into support I will start implementing my bullish trading tactics. I have a lot of them in my arsenal and those bullish trading tactics help me to get nicely positioned in my long setups, right, in order for me to be catching only the highest probability trade setups and with the highest risk reward possible as well.
There is always this kind of trade-off, sometimes the probability is not that good but the risk reward is excellent so I go into that trade and sometimes the probabilities are extremely perfect but the risk reward is not that great but I will go for that anyway if I I have enough points.
So, however, if the risk card is horrible and the probabilities of the trade are just medium, I'd rather miss a trade than risking my capital and the capital of my clients unnecessarily, right? So, it's always the trade-off and based on your trading system you need to recognize if you're willing to risk on that position or not.
and then if you can successfully follow your process, it's really about process, not the outcome. If you're focusing only on making money, you will lose. You are no better than the gimbler in a casino. But if you are focusing on a process, how you get to that outcome, then you are putting yourself into a position of a professional poker player.
That can be long-term profitable, all right? So, ladies and gentlemen, right now, we can see that the expanded flat pattern, ABC, is trying to get completed, alright, we can assume that the third wave of that higher degree sea wave is already being finished, alright, or is finishing because of already having these kind of bearish signals of that shooting star, Candlestick pattern for example and Momentum already slowing down, we don't have the
bearish cross just yet, we don't even have a bearish divergence, okay, as we can see higher higher on the price section, higher higher on the the momentum indicator, we don't see a bearish divergence on RSI neither, right? So Stochastic RSI is however having bearish cross and what we can see also on the volume is divergence from the price action, so the price action is creating higher highs but the volume you can
see is fading, right, is creating lower highs. So the participation is already of the bulls going down and given that we can see also also on the cumulative volume delta that on the spot they are trying to push, they are still pushing, they are buying on spot, usually spot is a smart money, right, however as we can see there is again this kind of divergence, so if you take for example this
section right here which is such a thing basically that the buying pressure is getting absorbed right now by the sellers, so if I, I don't have the horizontal tool right here anyway, I mean and vertical tool. But take a look at this high and this high right here.
And as you can see, so far we have created a lower high, but on the CVD, on the cumulative volume delta, where we are tracking only spot volume, we have already created a higher high, which suggests that all of this got already absorbed because we are having this divergence.
If nobody would be absorbing this buying pressure, the price action would do higher high as well. But because somebody probably absorbed all of this buying pressure, we can see that the price section so far created a lower high, all right? Which again, given that we also understand that the participation on the volume, we can see the participation of the bulls is decreasing, is actually a warning sign for the bulls, okay?
So still I'm bearish on the daily timeframe and this is just giving me a better conviction to stay bearish on the daily timeframe. So so yeah, open interest, what however is just giving me this kind of doubts that we will have enough liquidity to start pushing to the downside aggressively is the fact that the open interest is not heavily increasing, yeah.
So we can really see that even though the market is greedy, what we can perfectly see on our free and greed index on the daily timeframe, we are at 80, right, usually when we can historically confluence the number 80 with some of important resistance which we are at right now, we are at important resistance.
It's usually working as a top in like a top signal, right? And we are seeing a reversal. However, we don't see an extreme conviction from traders. So they are feeling greedy, but they are not opening extremely high leverage long positions just yet because the open interest we can see is kind of flat.
However, the current market participants that are playing in the market right now, we can see on the funding crates that they are in a long position. We have a long squeeze probability 30%, which is not that high, but we can clearly see that more people that are currently trading are in a long position.
So the funding crates are positive, the longs are getting crowded, definitely there would be a few to start squeezing to the downside, definitely from the longer time frame perspective There is huge imbalance, right? So on the lower time frame, there is imbalance to the upside.
There might be the weak towards 83,000 dollars, but then take a look on the longer time frame, right? If we will start pushing towards back our magical number 61,000 dollars, we will equate 19 billion dollars, ladies and gentlemen, worth of cumulative long positions, all right?
That are the long positions that are for quite a long time in the market and still holding and their longs. So there's a huge imbalance. So from a short-term perspective, I'm not extremely bullish for me at least to take a bullish position, but I understand the risk of that there might be a week towards 83,000 dollars.
It doesn't mean I would create a long position based on that bias, but I understand there is risk. That is how I'm thinking about my training marketing tactics, understanding this, for example, right? So there might be a wake to liquidate those people right here towards that $83,000.
It's nice liquidation event would be nice liquidation event. And then, but however, afterwards, there is not enough fuel to keep on like going up. And the market structure is still heavily bearish. I do believe that the bears would be defending that quite well.
And so that's that means that if you start are pushing here, the higher probability is that we will then see a reversal to the downside, okay? Much lower probability than that we would reclaim this level, this resistance at around $84,300 and start continuing the upside.
So that's also how I am based on what I am right now treating the market based on, okay? So, ladies and gentlemen, right now, still however, I do believe that we are concluding on the daily timeframe, the sea wave, as we know, the sea wave of an expanded flat is a multi-wave structure, that means it subdivides itself into five small waves, one through three, the third wave, in my opinion, already finished
right here, and right now we are already creating the fourth wave, and then we will create the truncated fifth wave, since we have already attached to a key level, and then we will see a reversal, okay? Not for me for a position just yet for some big, big short position that I would be targeting prices below the previous low, $57,000, but I'm really with the ParadiseTeam.
We are watching the market as hawks, and we are waiting for the confirmations for us to create a beautiful big short position, and if you're in ParadiseFamilyVIP, you will know and Yeah, so I will see you back on Saturday, so until then TradeSafe, trade with a professional trading strategy, focus on disciplined process, not the outcome, okay, focus on disciplined process because that's the only way you can actually control, right?
You cannot control the outcome because even with a really great process, sometimes you might lose, right? So you cannot really control the outcome. What you can control, however, is developing a great trading strategy, developing a great system with a nice plan, with a nice trading tactic get into your trading positions, always keep the odds on your side, henceforth, and continue following your process.
So you can follow your, you can control your process, okay, and that's extremely important. A lot of people feel like they are not, they cannot be in control in the crypto markets. I'm telling you, you can, you can be in control. You're not the victim of these market maker manipulators, alright?
you can create a process that exploits the market vulnerabilities, alright, and you can position yourself as the market makers and then do it over and over and over again and in the long run you will be successful, okay? So focus on the process, not on the outcome.
The process is what you can control, the outcome is not, that's random, alright? You can have like on coin, you have 50% chance it's going to be a hat or that it's going to be tail, right? So when you are tossing the coin, however, it's not always 50-50 that sometimes you will, one time you will lose, second time you will win, right?
Sometimes basically you can hit eight times in a row, even more times the same side of the coin. So, like, does it mean that the coin is somehow, like, tricked? Does it mean that the probabilities are actually 80-20, for example? No. It's just randomness.
In short run, it's randomness. But in long run, okay, in long run, in the large number theory, if you will be tossing the coin enough times, for example, 500 times, it starts to even out, all right? So you will start to understand that after those 500 tosses, really, it's around 50-50.
50 times you have hit heads, 50 times you have hit tails, okay? But in the short run, that's random. you can get lucky, you can get unlucky in the short run. That is why in trading even the worst possible, even like your kid, if you have a 3 year old kid and you give him access to your exchange account, in the short run your kid can make money in trading, okay, in
crypto. Does it mean that you should hand him your millions and let him trade? Probably not, right? but some people feel like they win a few times in markets and that they can do it long-term successfully. Like, it's really so random in the short run.
So focus on the long-term, focus on your process and focus on long-term growth, not discount of get rich quick schemes. Ladies and gentlemen, I wish you great focus and discipline and I will see you back on Saturday. day, until then, take care, Cheaters!
Educational content, not financial advice. Crypto trading carries substantial risk; you can lose your capital. Past performance does not guarantee future results.









Join the discussion
No comments yet. Members, share how you are reading this.