

In short
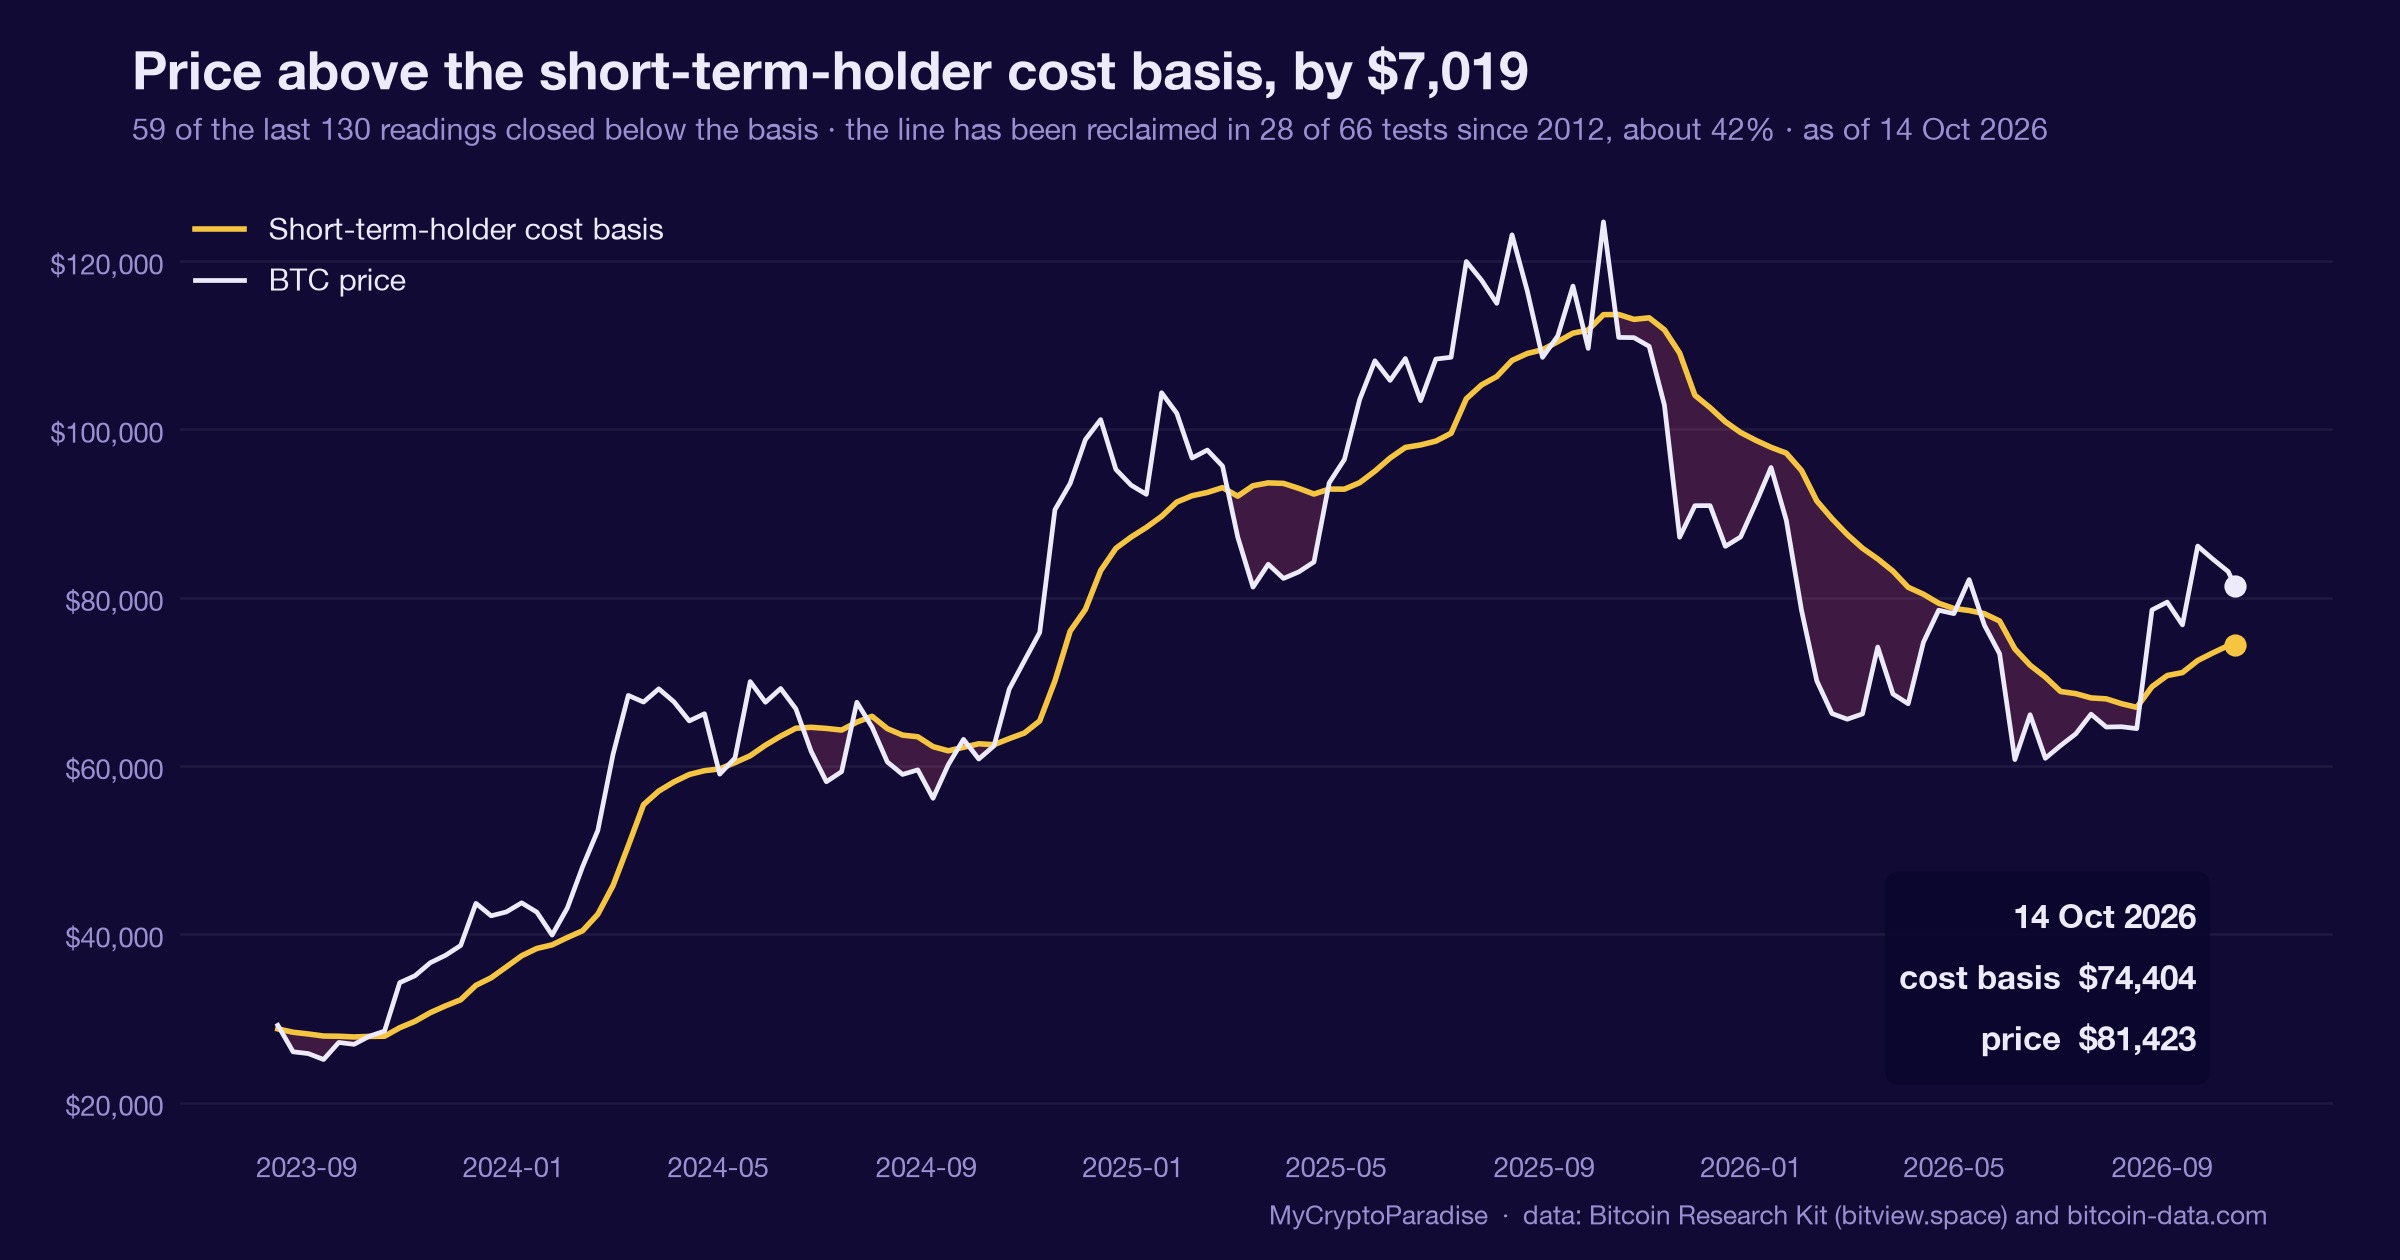
Cost basis is the average price at which a group of coins last moved: it marks where a cohort breaks even. On 16 October 2026, per our MCP Insights cost-basis data, bitcoin trades at $81,253, roughly 51 percent above the whole market’s realized price of $53,846. Comfortable on the surface. Underneath, the cohorts disagree. Long-term holders sit about 65 percent above their $49,246 average, while 34.5 percent of recent buyers, some 1.26 million coins, are underwater, a share that has risen from near 30 percent a week ago. We read it as neutral, constructively tilted, explicitly not a call that the top is in or that recent buyers are trapped. The cushion above the short-term-holder cost basis has thinned from 8.17 to 6.79 daily ranges. This piece shows you how to read the cost-basis split yourself, cohort by cohort.
Key facts
- Bitcoin price at the reading
- $81,253
- Short-term holder cost basis
- $74,479
- Price against that cost basis
- $6,774 above
- Share of short-term holder supply underwater
- 34.5%
- State
- price above the short-term-holder cost basis
- What would prove this read wrong
- A daily close below the short-term-holder cost basis near $74,479, which flips the recent-buyer cohort from comfortable to underwater as a group.
- Reading taken
- 16 October 2026
- Source
- Our MCP Insights tools, from Bitcoin Research Kit (bitview.space) and bitcoin-data.com. Upstream data published by the Bitcoin Research Kit
A cost basis measures who can afford to wait
Every bitcoin has a price at which it last changed hands. Average those prices across the whole supply and you get the realized price, the mean acquisition cost of every coin in existence. Group them by cohort instead and you get a separate cost basis for each group.
The number matters because it separates holders sitting on gains from holders nursing losses. A cohort trading well above its cost basis can afford to wait and does not have to sell. A cohort underwater is the one that offloads into strength to get back to flat, or capitulates into weakness when patience runs out.
A cost basis is not a price target, and it does not promise a bounce. It tells you who in the market can afford to sit still, and who cannot. That is a map of pressure, not a forecast of price.
On 16 October the cohorts stopped agreeing
Per our MCP Insights cost-basis data, bitcoin trades at $81,253 on 16 October 2026, about 51 percent above the market’s realized price of $53,846. Long-term holders sit roughly 65 percent above their $49,246 average cost. On the aggregate, that is a mid-cycle cushion, not the triple-digit premium that has marked past tops.
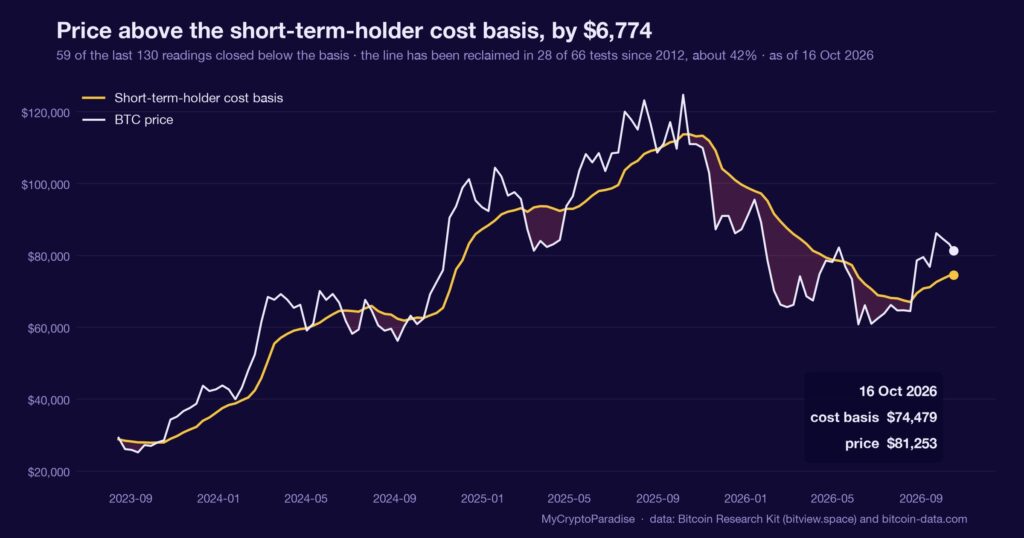
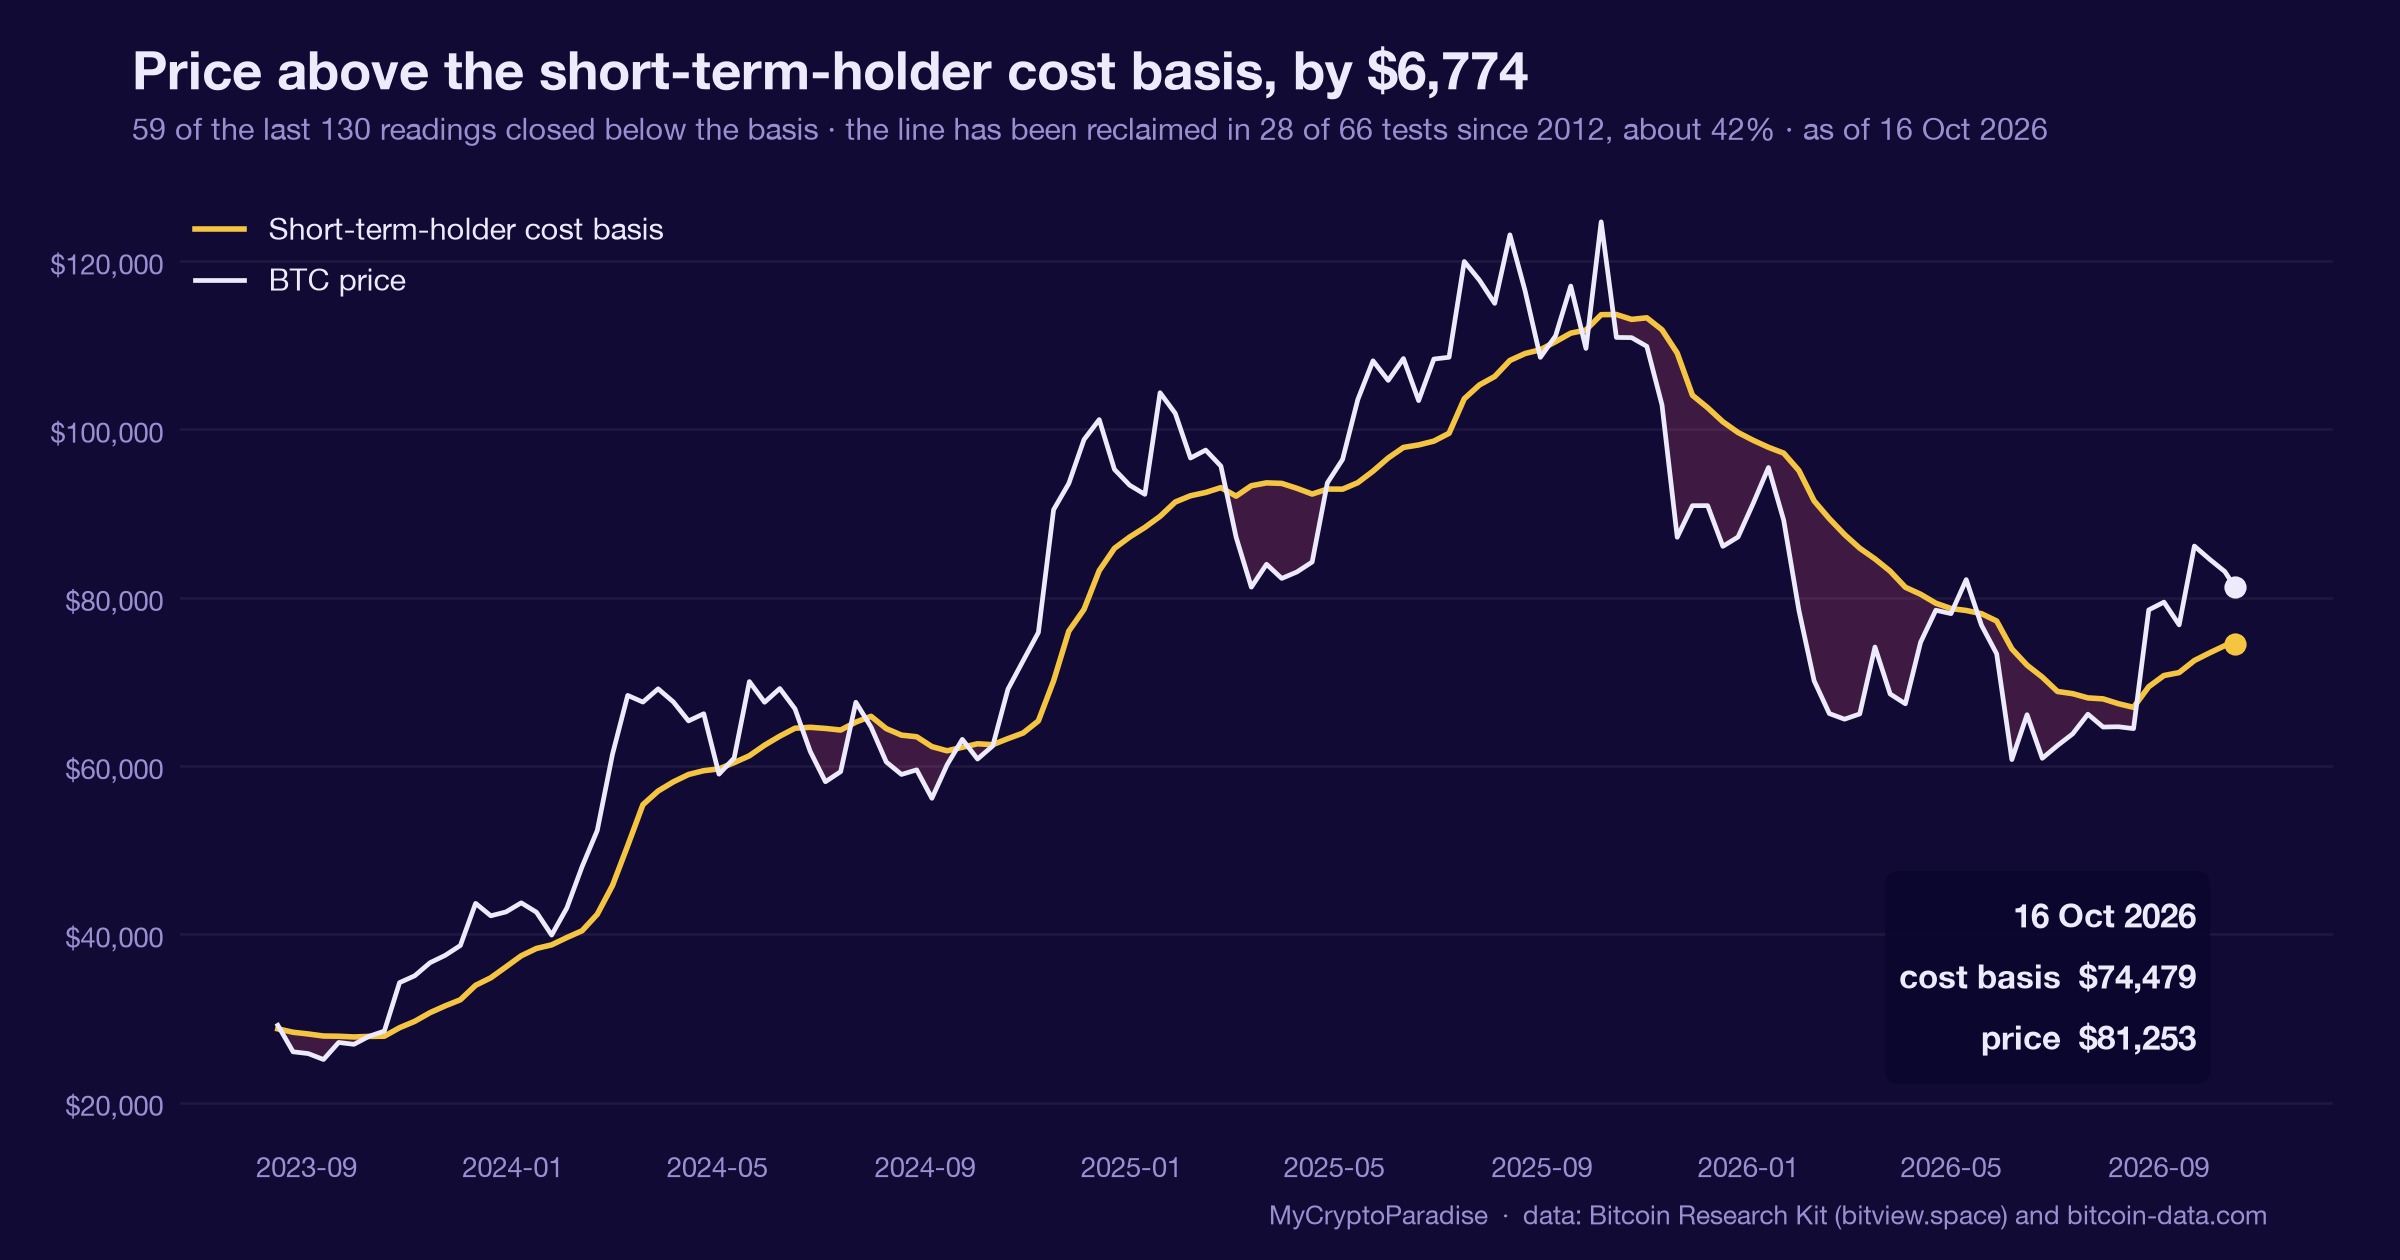
The short-term-holder cohort reads differently. Recent buyers broke even near $74,479, leaving spot $6,774 above them, or 6.79 daily ranges. Yet 34.5 percent of them, about 1.26 million of 3.66 million coins, are underwater. Across all holders the underwater share sits at 32.3 percent.
Spent-output profit (SOPR), the ratio of a coin’s sale price to its acquisition price, reads 1.003 market-wide and 1.0006 for short-term holders, barely above breakeven, while long-term holders realize at 1.1248. These are our model estimates, not calibrated figures.
One aggregate can be comfortable and fragile at once, depending entirely on which coins you weight.
What is different here
The ParadiseTeam does not read the realized-price premium as one number. We split it by cohort, weight the marginal buyer over the dormant long-term holder, and flag when the aggregate and the recent-buyer cushion start to disagree, because the disagreement sizes risk the headline hides.
A comfortable average hides an uncomfortable margin
The easy read of a 51 percent premium is that bitcoin sits nowhere near danger. That read weights every coin equally, and most coins belong to long-term holders who bought far lower and have no reason to sell at these levels.
Price, though, is set at the margin, by the cohort actually transacting. That cohort is recent buyers, and a third of them are now underwater, a share that has climbed from near 30 percent a week ago. Their cost basis near $74,479 is the line that decides whether they hold or fold.
This is one input. It sits alongside funding, open interest and spot absorption, and today it is the reading that cools an otherwise comfortable picture rather than the one that confirms it.
The average coin’s comfort describes the past. The marginal buyer’s stress is what prices the next move.
The cushion is thinning, and the sample is thin too
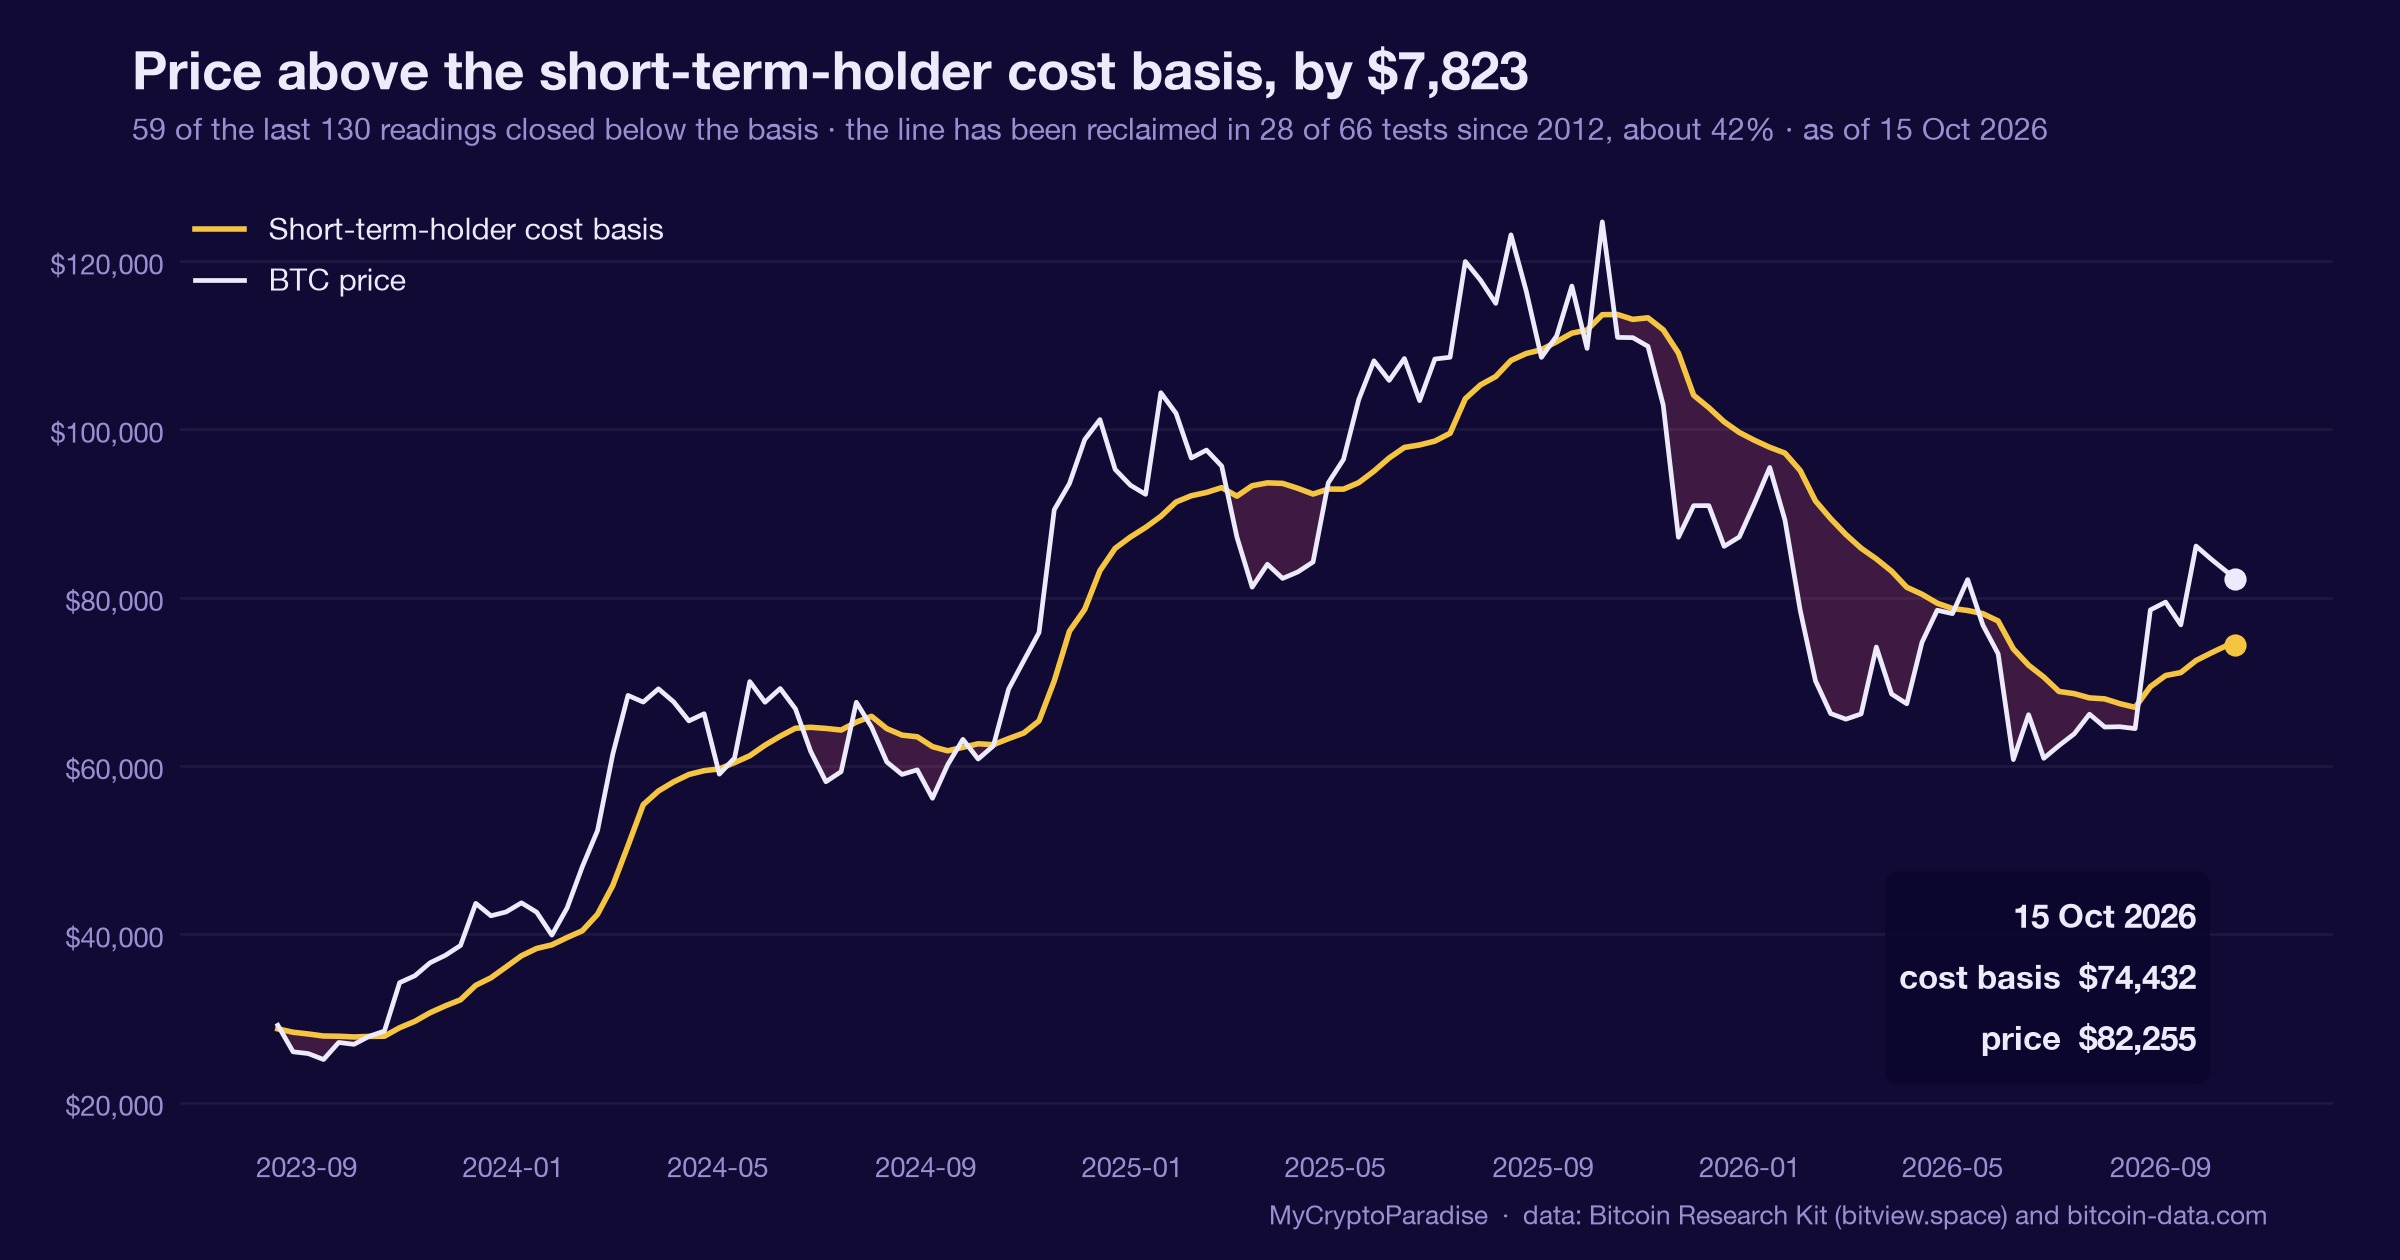
Two things have shifted since last week. The buffer above the short-term-holder cost basis has compressed from 8.17 daily ranges to 6.79, and the share of recent buyers underwater has risen rather than fallen. The aggregate premium barely moved; the cohort beneath it did.
SOPR near 1.003 says seller pressure is thin but unresolved: recent sellers are moving coins a hair above cost, with no capitulation and no euphoria. Our model has logged 66 recon tests of this level since 2012, but only a handful are graded end to end, and none have cleared the calibration gate.
A handful of graded recon episodes is not a base rate. It is an anecdote with a spreadsheet, and we will quote it as exactly that.
Reading the cost-basis split yourself, step by step
- Start with the realized price, the market’s average cost basis, and note how far above or below it spot trades.
- Split the holders: compare the long-term-holder cost basis against the short-term-holder cost basis to see which cohort sits in profit.
- Measure the recent-buyer cushion in daily ranges, not just dollars, so the distance scales with current volatility.
- Check the share of short-term holders underwater, and whether that share is rising or falling week over week.
- Read SOPR alongside it: near 1.0 means sellers are at breakeven, with no capitulation and no euphoria yet.
Most people stop at the aggregate premium. The step they skip is step four: a rising underwater share warns you before the average premium ever does.
Every number above is checkable against the live data. Start with the MCP Insights hub, then cross-read the Crypto Fear and Greed Index and the live crypto funding rates.
Act and invalidate
| Scenario | What confirms it | What kills it |
|---|---|---|
| Cushion holds, premium intact | Spot stays above $74,479, SOPR above 1.0 | Daily close below $74,479 |
| Recent-buyer cohort breaks | Close below $74,479, underwater share rising | Share falls back toward 30 percent |
| Range while cohorts reconcile | Spot drifts near the cushion, SOPR near 1.0 | SOPR above 1.03 with premium expanding |
Posture: Defensive-to-neutral. The aggregate premium still argues against a top, but a thinning recent-buyer cushion and a rising underwater share argue against adding size here. The short-term-holder cost basis near $74,479 is the single line that converts caution into a loss-of-cushion read.
Frequently asked questions
What is bitcoin’s cost basis?
It is the average price at which bitcoin last changed hands. Grouped across every coin it is called the realized price; grouped by cohort it shows what long-term and short-term holders each paid, and therefore which group currently sits in profit or in loss.
Why does 51 percent above realized price not mean a top?
Because that premium is an average dominated by long-term holders who bought far lower. Price is set by the cohort transacting now, mostly recent buyers, and a third of them are underwater. A comfortable average can coexist with a stressed marginal buyer.
What is the short-term-holder cost basis right now?
On 16 October 2026 our model estimate put it near $74,479, with spot about $6,774 above it, or 6.79 daily ranges. That cushion has thinned from 8.17 ranges a week earlier, even though the aggregate premium barely moved over the same stretch.
What does a SOPR near 1.0 tell you?
Spent-output profit ratio compares the price coins sell at to the price they were acquired at. Near 1.0, as now at 1.003, sellers are moving coins at roughly breakeven: pressure is thinning, with neither capitulation below one nor euphoric profit-taking far above it.
Does this reading predict bitcoin’s next move?
No. It is one input among funding, open interest and spot absorption, and it describes where cohorts break even, not where price goes. It sizes risk and flags a thinning cushion; the invalidation level, a daily close below the short-term-holder cost basis, keeps it honest.
Crypto trading involves substantial risk and is not suitable for everyone. Nothing here is financial advice; it is education only. Never risk more than you can afford to lose.
The private Extras feed, where the cost-basis split, short-term-holder loss share and SOPR reset update intraday with their invalidation levels attached, is part of PRO Paradiser, the intelligence layer behind the ParadiseFamilyVIP strategies.











Join the discussion
No comments yet. Members, share how you are reading this.