

Listen: the breakdown
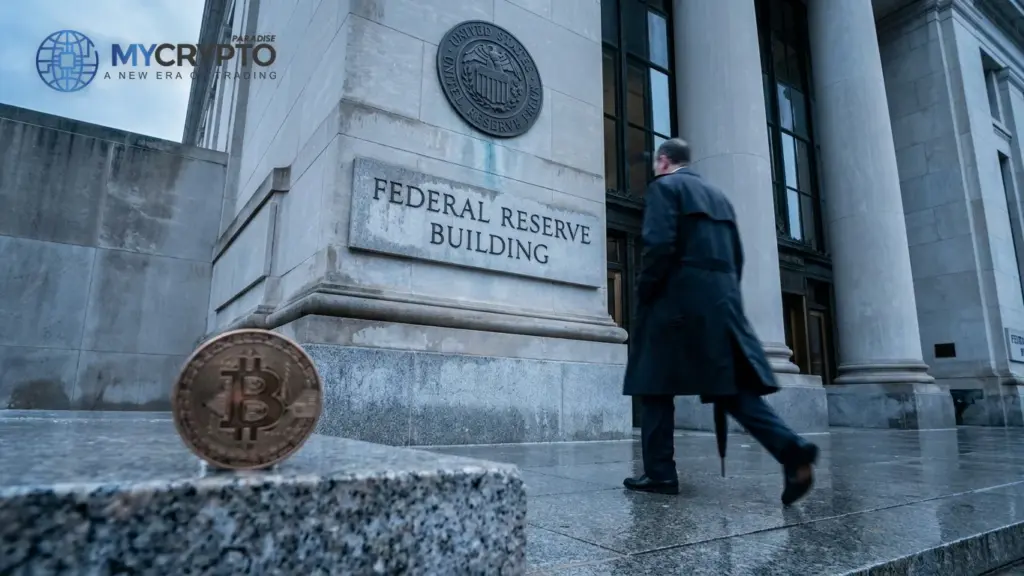
Market briefing: The Federal Reserve raised rates to 3.75 to 4.00 percent, yet Bitcoin climbed to around 81,293 dollars, up over 4 percent on the day. We read this pump into resistance as distribution, not strength.
- The Fed lifted rates 25 basis points to 3.75%-4.00%, yet BTC rose to about $81,293, up 4.3% on the day.
- Crowded longs, positive funding and spot selling on CVD point to smart money distributing into retail greed.
- A push below $74,900 would confirm the trap, opening $58,000 and eventually the $44,000-$55,000 zone.
Source: U.S. Federal Reserve
The Fed hiked rates again, and Bitcoin rallied instead of falling. A rising market into a tightening Fed looks like strength. But is this pump real, or a liquidity grab?
The Federal Reserve raised its benchmark rate by 25 basis points, lifting the range to 3.75% to 4.00%. Higher rates usually pull money out of risk assets. Bitcoin did the opposite. After slipping below $76,000 earlier this week, it climbed back toward $82,000 and was trading near $81,293 as of the latest read, up 4.3% on the day.
A tightening central bank and a rising crypto market do not usually share a chart. That mismatch is the whole story.
Traders are already betting on another hike in October, yet the crowd keeps buying. Funding stays positive, longs are crowded, and the mood reads as greed rather than caution. The market has decided a rate hike is bullish, which is the kind of reasoning that tends to appear late in a cycle.
We do not treat this as strength. When price rises into resistance while borrowed money piles into longs, someone larger is usually selling into that demand. The rally looks less like conviction and more like a supply of eager buyers arriving at exactly the wrong moment.
There is no single confirmed catalyst behind the pump. That is our read, not a reported fact.
The rate hike the market shrugged off
Rate hikes drain liquidity from the system. Borrowing costs rise, and capital that chases risk gets more expensive to hold. In a normal transmission, that pressure hits the longest-duration, highest-risk assets first, and Bitcoin sits at that end of the spectrum.
So the resilience matters. The market has stopped reacting to the hike itself and started pricing what comes after it: future liquidity, policy shifts, and where rates finally peak. That forward-looking behaviour can be genuine, or it can be a crowd talking itself into a story.
Here the story is that tightening no longer matters. History treats that phrase with suspicion.
The danger is that expectation and positioning have run ahead of the actual money. Prices can rise on belief for a while. But belief funded by leverage needs constant new buyers, and rate hikes quietly shrink that pool. When the marginal buyer runs out, the same leverage that lifted price accelerates the fall.
This is why we anchor everything to the hike, not the pump. The hike is the confirmed event. The rally is the market's reaction to it, and reactions can be engineered. A tighter Fed plus a rising, over-leveraged crypto market is not a contradiction to celebrate. It is a situation where the cost of being wrong keeps climbing while the crowd assumes it is falling.
Crowded longs feed the liquidity above
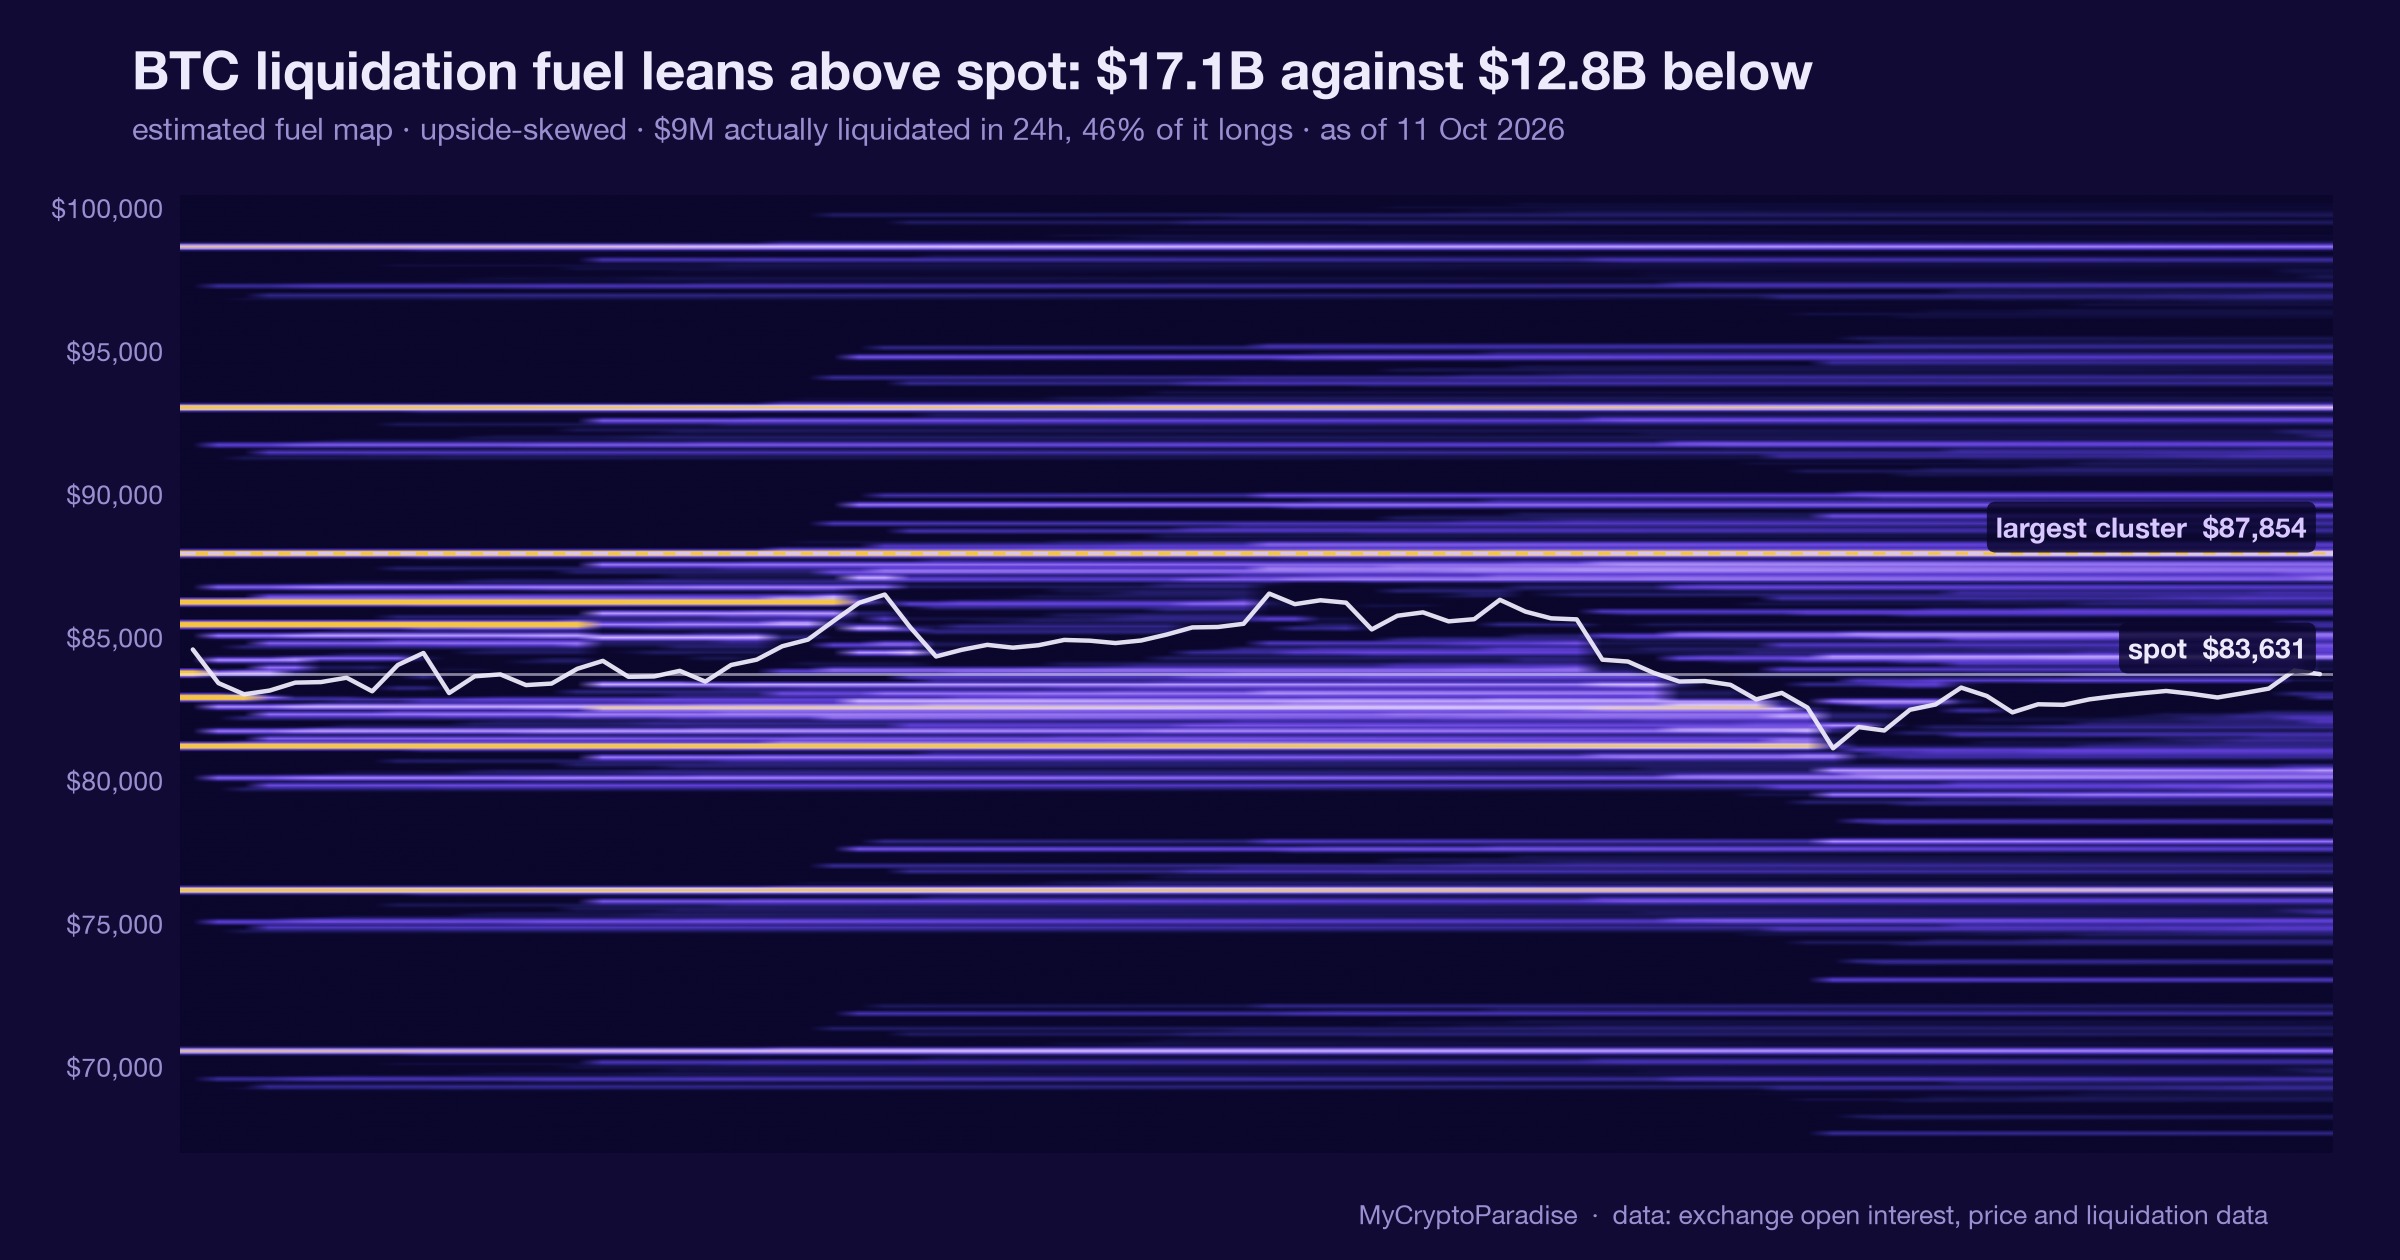
Bitcoin leads, so start there. BTC is pushing into the $82,000 area after reclaiming ground it lost below $76,000. That round number is not just psychological. It is where a lot of stop orders and short liquidations cluster, which makes it a magnet for price and a convenient place to trigger forced buying.
Open interest, or OI, the total value of outstanding derivatives positions, has climbed with price. Rising price plus rising OI plus positive funding means longs are paying to stay long. That is fuel. If price stalls, those longs become the liquidity that a larger seller needs.
Cumulative volume delta, CVD, the running tally of buy versus sell pressure, tells the quieter half of the story: spot selling into strength.
If BTC rolls over, the cascade is familiar. ETH tends to follow Bitcoin one step later and one step harder. Then the smaller alts, where liquidity is thin and leverage is high, take the sharpest hit. A 4% up day in BTC can become a double-digit down day in a mid-cap alt within hours.
That order, BTC then ETH then alts, is not a rule, but it is the way most of these unwinds have rhymed.
Levels that separate trap from trend
Confirmation and invalidation live at specific levels, so watch them, not the headlines. On the upside, a clean break and hold above the $82,400 to $84,200 supply zone would force us to respect the move. Sustained acceptance there, with OI cooling rather than spiking, would suggest real spot demand instead of a leveraged chase.
The bearish case stays intact while BTC keeps rejecting resistance. Repeated failures around $82,000 and the $79,000 shelf, especially on shrinking momentum, point to distribution rather than breakout.
The first real crack is a push below $74,900, the prior local low. Lose that, and the reclaim of $76,000 becomes a failed move, a classic trap where late buyers are left holding the top. Below there, $58,000 is the next structural support that matters.
The deeper zone, $44,000 to $55,000, is not a prediction for this week. It is where the larger downside completes if this whole rally was distribution.
Funding and OI are the tells between levels. If price grinds up while funding turns sharply positive and OI balloons, treat strength as fragile. If a drop comes with OI collapsing, that is leverage flushing out, and it can mark a bottom rather than the start of one.
Where distribution hides inside this rally
BTC near $81,293 sits in an awkward spot, and the ParadiseTeam is treating it with caution, not enthusiasm. Price has pushed back to the $82,000 resistance it struggled with before, still capped by the heavier $82,400 to $84,200 supply band. That is the ceiling this rally has to clear, and so far it has not.
Our lens stays bearish on the daily and weekly. The evidence is in behaviour, not price alone. Momentum is diverging, with price making a higher high while the underlying strength makes a lower one. Longs are crowded, funding is positive, and spot pressure on CVD leans toward selling. That combination reads as smart money handing bags to an eager crowd.
The rate hike is the perfect cover. Nothing distributes bags like a headline the crowd has decided to ignore.
So we frame the levels this way. Above $84,200 on real acceptance, the bearish read is wrong and we step aside. Below $74,900, the trap confirms and $58,000 comes into focus, with $44,000 to $55,000 the deeper target if distribution plays out. Between those, this is a resistance test inside a downtrend, not a fresh uptrend.
Risk-to-reward, or R:R, favours patience here. Chasing green candles into resistance is how retail funds the exit.
The read behind this: we framed this story through our own market analysis, Bitcoin Whale Sells $9M: Is a Drop Next?
Track it live: our live crypto funding rates and the crypto liquidation heatmap both update in real time, so you can watch this shift for yourself.
Related coverage
For exact entries, targets, and stop losses with full risk management, that is what ParadiseFamilyVIP is for. New to reading these moves? Start with our crypto trading strategies guide.
ParadiseTeam is monitoring the market situation closely, and we are taking these developments into consideration while building our trading tactics inside ParadiseFamilyVIP.
Crypto trading involves substantial risk. Prices are volatile and you can lose money. This article is educational and is not financial advice. Past performance does not guarantee future results.
Where does BTC go next after the Fed hike and this pump into resistance?
This is how 14 Paradisers are calling it. Tap your call.
No calls on this one yet. Tap yours to be the first.
Free account, no password. Members just sign in.












Join the discussion 3
watching for the stops on these crowded longs.. sizing off the resistance here is key, but you have to have a plan for the other side of it.
yeah, sizing off the resistance is huge. just gotta pick the right spots before getting chopped up, right? 😅
But the resistance has been broken before... I am wondering if the rate hikes really make a difference for it now, or if it's more about demand.