- The Broadening Triangle Pattern is a high-volatility market structure that reflects increasing uncertainty, where price forms higher highs and lower lows, creating expanding price swings over time.
- This pattern is neutral by nature. However, it becomes highly tradable once a confirmed breakout occurs with strong volume, signaling that one side has finally taken control.
- Because of its aggressive price behavior, risk management is critical. Stop-loss placement is flexible, while targets are typically projected using the widest range of the structure.
The Broadening Triangle Pattern is a high-volatility structure defined by expanding price swings and increasing market uncertainty. It reflects a loss of control for both buyers and sellers, leading to aggressive moves in both directions.
At MCP University FREE, this guide is part of our advanced trading series for disciplined crypto traders focused on market behavior, not just pattern recognition. By the end, you will be able to identify the Broadening Triangle Pattern, understand the imbalance behind it, and trade it with structured precision.
Introducing the Broadening Triangle Pattern
The Broadening Triangle Pattern, often called the Megaphone Pattern, is a chart pattern that shows rising volatility and growing indecision between buyers and sellers. Unlike patterns that show contraction or balance, this structure reflects expansion and unstable market conditions.
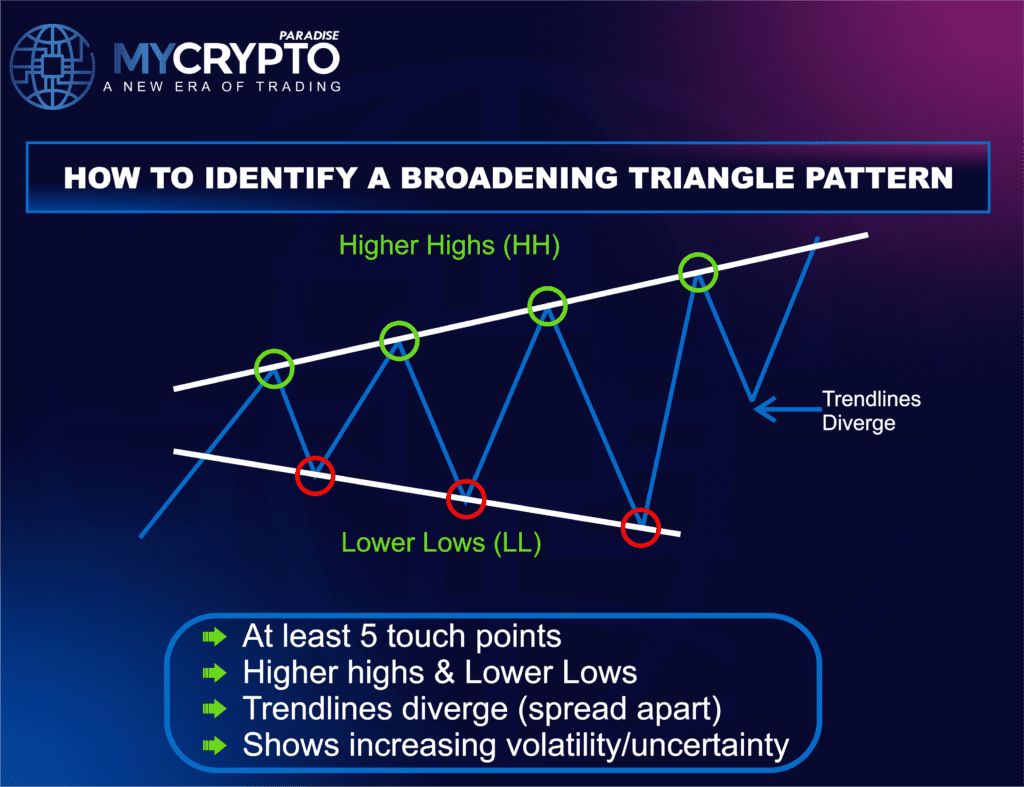
The pattern forms when the price makes higher highs and lower lows. As a result, two diverging lines can be drawn, one joining the highs and the other joining the lows. These lines move apart, creating a widening shape that looks like a megaphone.
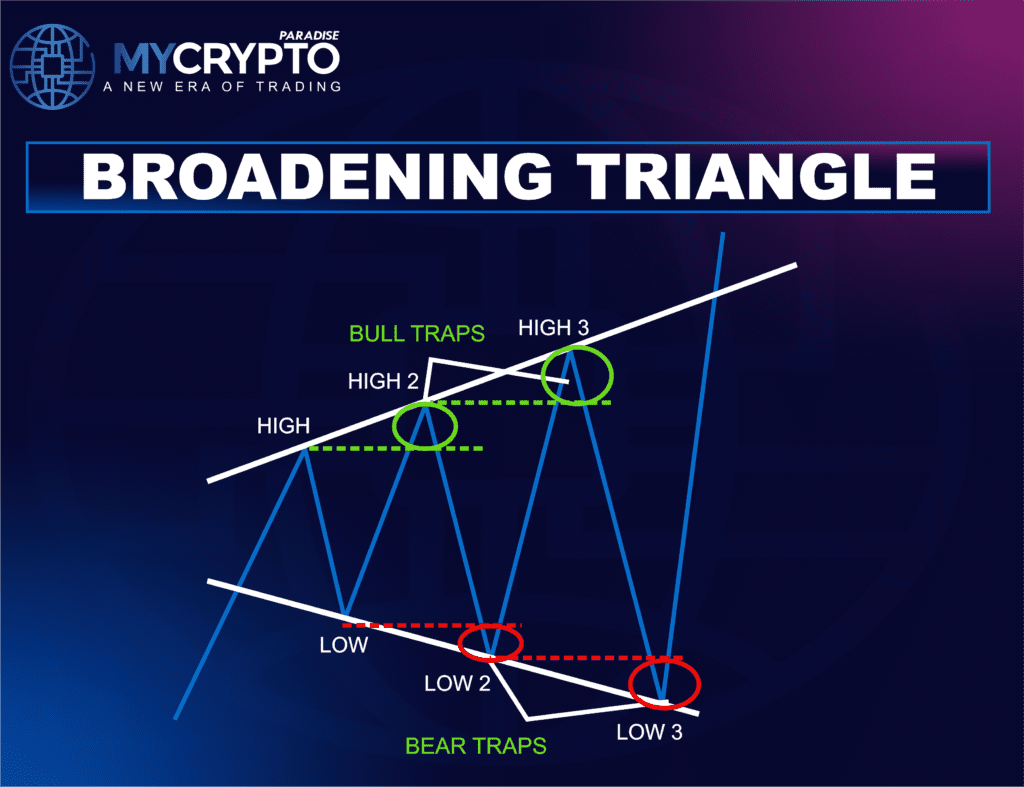
This expansion is not random. Instead, it indicates that both buyers and sellers are becoming more aggressive. Buyers push prices to new highs, while sellers respond by driving prices even lower than before. Consequently, the market becomes increasingly volatile, with larger price swings and more frequent liquidity hunts.
Key characteristics of a Broadening Triangle include:
• Expanding price action: Each new swing becomes larger than the last, showing rising volatility and emotional trading.
• Diverging boundaries: The resistance line slopes upward, while the support line moves downward, forming a widening structure.
• Minimum five touchpoints: A reliable setup usually has at least five touches across both sides, confirming the formation.
• Unstable behavior: Sharp reversals and long wicks make price movement more unpredictable.
• Neutral bias at first: Direction remains unclear until a confirmed breakout takes place.
This pattern is particularly important because it often appears during periods of transition. In many cases, it signals that the market is moving from a controlled trend into a phase of high volatility before a major directional move.
How to Identify the Broadening Triangle Pattern?
Identifying a reliable Broadening Triangle Pattern requires patience and a structured approach. Traders must focus not only on the shape of the pattern but also on the behavior of the price within it.
- Confirm expanding structure
First, observe whether the price is forming higher highs and lower lows. Without this expansion, the pattern is not valid. - Draw diverging trendlines
Next, connect the swing highs with an upward-sloping line and the swing lows with a downward-sloping line. This creates the visual megaphone shape. - Look for multiple touches
A strong pattern requires repeated interaction with both trendlines. Ideally, you should see at least five touches before considering it tradable. - Analyze volatility behavior
Notice how price movements become more aggressive over time. This increasing volatility is a key feature of the pattern. - Wait for confirmation
Finally, avoid entering trades inside the pattern unless you are highly experienced. Instead, wait for a clear breakout supported by strong volume.
Anatomy of the Broadening Triangle Pattern
Understanding the internal formation of this pattern helps traders anticipate potential outcomes and avoid unnecessary risks.
• Initial Phase:
At the beginning, the price moves in a relatively normal trend. However, volatility starts to increase as the first higher high and lower low are formed. This marks the transition from a stable trend to an expanding structure.
• Expansion Phase:
As the pattern develops, price swings become larger. Each rally pushes higher than before, while each drop breaks previous lows. This reflects growing disagreement between buyers and sellers.
• Emotional Phase:
During this stage, the market becomes highly unstable. Retail traders often get trapped in false breakouts, while institutions begin accumulating liquidity from both sides.
• Breakout Phase:
Eventually, one side gains control. A strong breakout occurs, usually accompanied by a surge in volume. This signals that the period of indecision has ended and a new trend is beginning.
Market Psychology Behind the Broadening Triangle
The Broadening Triangle Pattern is deeply rooted in market psychology. It represents a shift from structured behavior to emotional and reactive trading. Initially, buyers are confident and push the price higher. However, sellers quickly respond, forcing the price lower. This creates the first signs of conflict within the market.
As the pattern develops, both sides become increasingly aggressive. Buyers chase higher prices, while sellers push the market lower with equal force. Consequently, volatility increases, and price movements become less predictable.
At this stage, many crypto traders experience confusion. Some attempt to trade breakouts, while others try to fade moves. Unfortunately, both strategies often fail due to frequent false signals.
Finally, after multiple failed attempts on both sides, one group gains dominance. When this happens, the breakout is usually strong and decisive. Therefore, the pattern reflects a transition from indecision to conviction.
How to Trade the Broadening Triangle Pattern
Trading the Broadening Triangle Pattern requires a structured approach, as this formation is driven by expanding volatility and emotional market behavior. Unlike stable patterns, price action here becomes increasingly aggressive, which makes random entries extremely risky. Success comes from waiting for confirmation and executing with precision.
Breakout + Retest Strategy
The most reliable way to trade this pattern is through a confirmed breakout followed by a retest. This approach filters out false moves and aligns you with real market intent.
Entry Levels
Wait for the price to break and close decisively outside the trendline boundaries before considering any position.
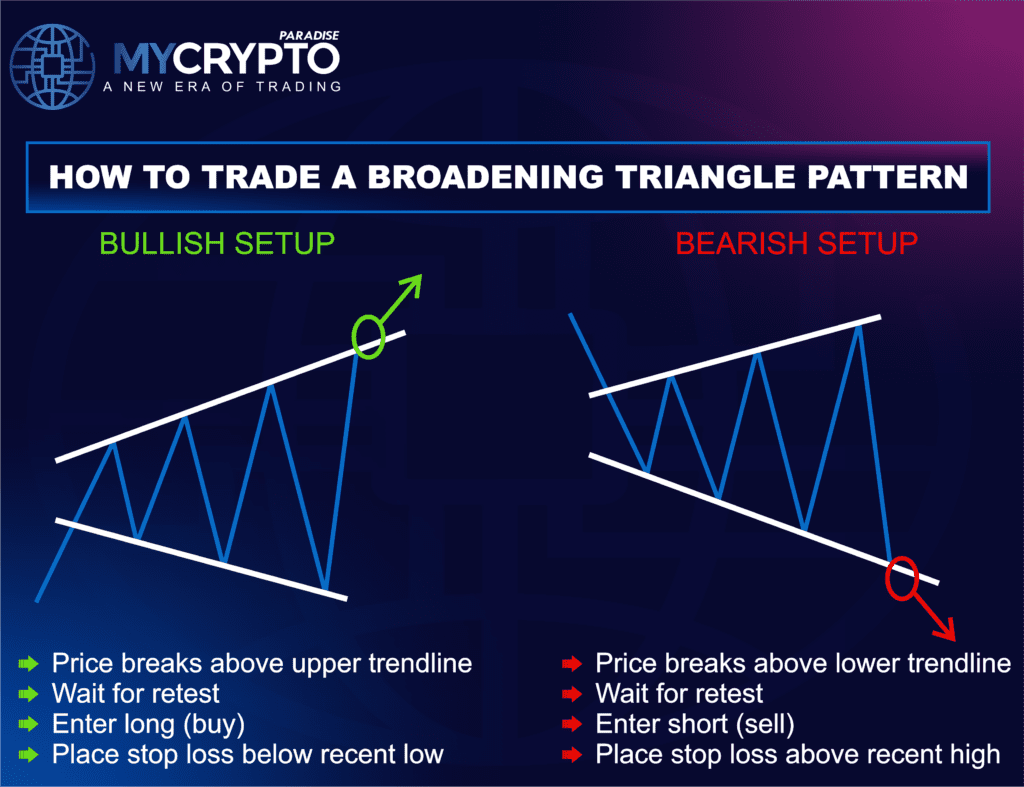
- A close above the upper trendline signals a potential bullish breakout.
- A close below the lower trendline signals a potential bearish breakout.
Do not rush into the trade immediately after the breakout candle forms, as false breakouts are common. Instead, allow the market to pull back and retest the broken trendline. This retest helps confirm that the breakout is genuine and that market structure is shifting.
- In a bullish scenario, previous resistance should now act as support.
- In a bearish scenario, previous support should now act as resistance.
Enter the trade only after the price shows a strong and clear reaction from the retest zone. Valid confirmation may include rejection wicks, engulfing candles, momentum candles, or strong continuation price action in the breakout direction.
Stop-Loss Placement:
Risk management must remain tight and logical:
- Bullish Setup: Place the stop-loss below the recent swing low, ideally just inside the structure
- Bearish Setup: Place the stop-loss above the recent swing high, just inside the structure
This placement protects your trade while allowing enough room for natural price fluctuations during the retest phase.
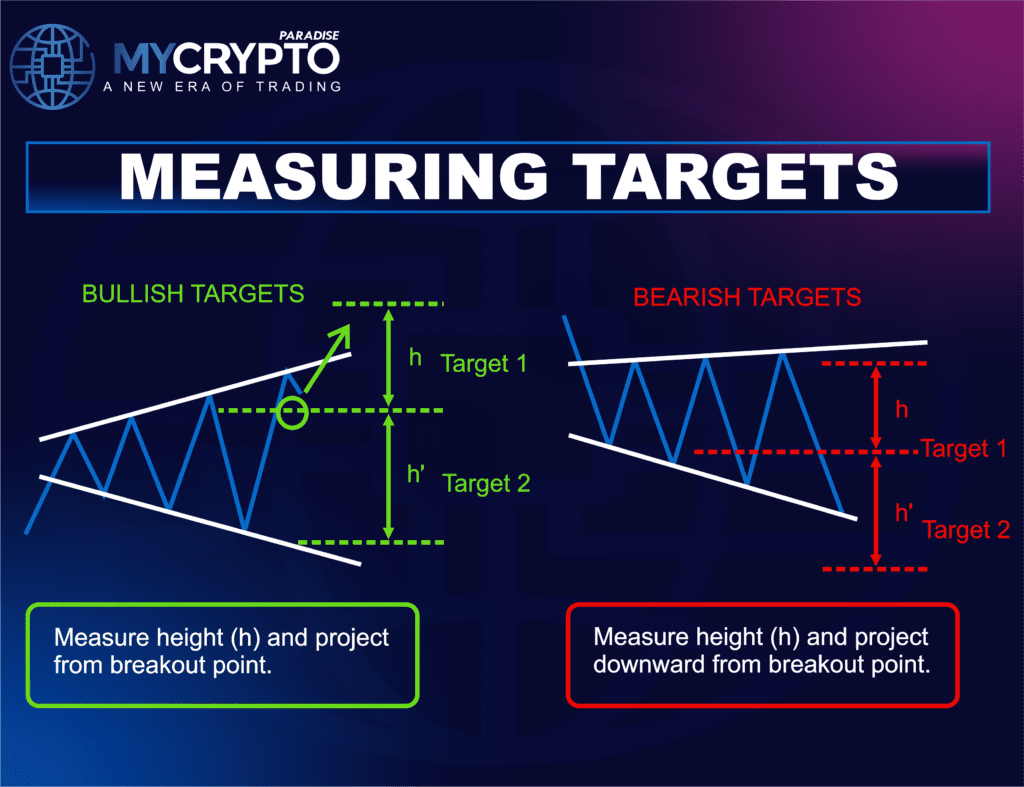
Profit Target:
To set a realistic and structure-based target, measure the widest part of the triangle and project that distance in the direction of the breakout.
This method reflects the pattern’s expanding volatility and provides a logical expectation for price movement, rather than relying on arbitrary targets.
By combining breakout confirmation, retest validation, volume support, and disciplined risk management, you can trade the Broadening Triangle Pattern with clarity and consistency, even in highly volatile market conditions.
Volume & Confirmation Guide
Volume analysis plays a crucial role when trading the Broadening Triangle Pattern, as it helps traders distinguish between genuine breakouts and false signals. Since this pattern is highly volatile, relying on price alone is often not enough; volume provides the necessary confirmation.
Volume Behavior
- Volume is usually inconsistent during the formation phase, reflecting market indecision
- Sudden volume spikes often occur during large price swings within the pattern
- A valid breakout should be accompanied by strong and sustained volume to confirm momentum
Additional Confirmation Signals
- RSI or MACD divergence indicating potential reversal or continuation
- Strong price reactions at key trendlines or boundaries of the pattern
- Clear market structure break (higher high or lower low formation)
- Alignment with the higher timeframe trend to increase the probability of success
Broadening Triangle vs Other Patterns
Unlike most patterns that show price contraction and stability, the Broadening Triangle reflects expanding volatility and market imbalance. Instead of tightening ranges, price swings become wider, signaling indecision and aggressive participation from both buyers and sellers.
Broadening Triangle vs Symmetrical Triangle
An asymmetrical triangle reflects decreasing volatility and tight consolidation as price compresses before a breakout. In contrast, a broadening triangle signals increasing volatility, with expanding price swings and an unstable market structure. Want to learn more about the symmetrical triangle? Click here
Broadening Triangle vs Ascending Triangle
An ascending triangle shows a bullish bias, with higher lows forming rising support against flat resistance, indicating growing buying pressure. In contrast, a broadening triangle is neutral, marked by expanding volatility and no clear direction until a confirmed breakout. Want to learn more about the ascending triangle? Click here
Broadening Triangle vs Descending Triangle
A descending triangle carries a bearish bias with consistent resistance and weakening support. The broadening triangle lacks this structure and instead reflects two-sided aggression without clear directional control.
Broadening Triangle vs Channel Pattern
A channel pattern shows controlled, parallel price movement within a defined range. In contrast, the broadening triangle displays expanding and irregular swings, making it far less stable and harder to trade without confirmation.
Common Mistakes When Trading the Broadening Triangle
Trading Inside the Pattern
Attempting to trade every swing within the broadening triangle often leads to losses. The price action is volatile and lacks clear direction, making intrapattern trades unreliable. It is more effective to wait for a confirmed breakout.
Ignoring Confirmation
Entering before a confirmed breakout increases the risk of false signals. This pattern frequently produces fake moves, so waiting for a strong close, volume support, or a retest is essential.
Poor Risk Management
Wide price swings increase risk. Using large position sizes or weak stop-loss placement can result in heavy losses. Proper risk control and position sizing are crucial.
Emotional Trading
The pattern creates uncertainty, leading to impulsive decisions. Fear and greed often cause overtrading or chasing moves. Discipline and a clear plan are key to avoiding mistakes.
Conclusion
The Broadening Triangle Pattern is not a beginner-friendly setup. Its expanding structure, driven by rising volatility and emotional market behavior, makes it one of the most challenging patterns to trade. However, for crypto traders who understand market psychology, liquidity, and volatility dynamics, it can offer high-probability opportunities.
At ParadiseFamilyVIP🎖️, traders are trained to handle complex structures like the Broadening Triangle with precision and structure. From identifying key liquidity zones to executing high-probability, confirmation-based trades, every step is designed to build a professional trading mindset.
👉 Join ParadiseFamilyVIP🎖️ to trade with confidence, structure, and precision in high-volatility market conditions.
FAQs
What is a Broadening Triangle Pattern in crypto trading?
The Broadening Triangle Pattern is a chart structure where price forms higher highs and lower lows, creating an expanding range. It reflects increasing volatility and market indecision over time.
Is the Broadening Triangle Pattern bullish or bearish?
The pattern itself is neutral. Direction is only confirmed after a clear breakout, either to the upside or downside.
Is the Broadening Triangle Pattern reliable?
Yes, the Broadening Triangle Pattern can be reliable when traded with proper confirmation and disciplined risk management. Without confirmation, it is prone to false signals due to its volatile nature.
What timeframe works best for the Broadening Triangle Pattern?
Higher timeframes tend to produce more reliable signals. On lower timeframes, the pattern becomes noisier and more prone to fakeouts.
How do I avoid fakeouts in the Broadening Triangle Pattern?
You need to wait for a strong breakout confirmation, such as a decisive candle close supported by volume. Also, you need to avoid trading inside the structure, as it significantly increases the risk of false moves.