
Bearish divergences are essential tools in the technical trader’s toolkit which offer key insights into potential trend reversals and shifts in market momentum. These divergences occur when price action moves upward, but underlying momentum indicators suggest weakness to signal that a downturn may be on the horizon. Crypto traders can position themselves to capitalize on falling prices before they gain momentum by recognizing these divergences early.
In this guide, we’ll explore various types of bearish divergences, ranking them based on their strength and reliability. From the highly trusted classic bearish divergence to more complex variations, understanding how to spot and trade these divergences will elevate your trading strategy.
We’ll also provide actionable crypto trading strategies for each type to give you a professional edge in navigating the volatile crypto market. Whether you’re new to crypto trading or looking to refine your skills, this guide will equip you with the knowledge to make informed decisions and improve your trading outcomes.
Introducing Bearish Divergences
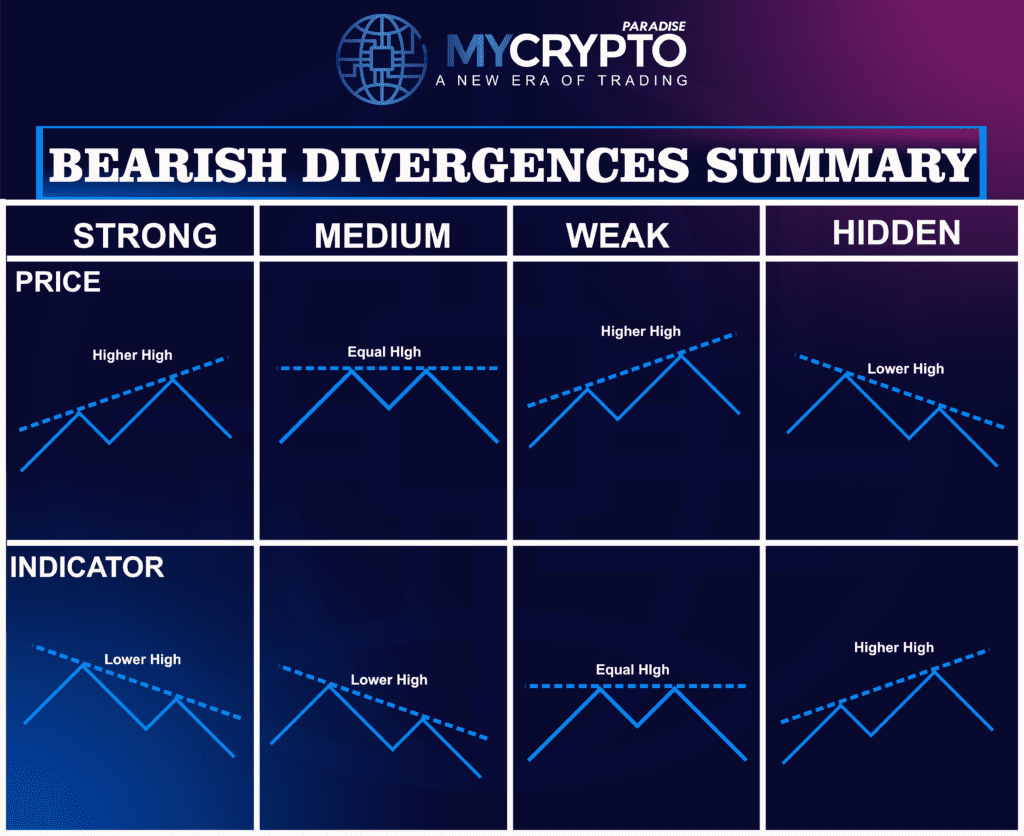
A bearish divergence occurs when the price of an asset reaches new highs. Still, an underlying technical indicator—such as the Relative Strength Index (RSI), Moving Average Convergence Divergence (MACD), or the Stochastic Oscillator—fails to follow suit, instead forming lower highs. This signals a weakening upward momentum and suggests that a reversal could be imminent as the asset may soon shift from an uptrend to a downtrend.
In other words, the price is telling one story, continuing to rise, but momentum indicators tell another, showing reduced strength in the bullish trend. If you want to be a professional trader, bearish divergences can offer a key opportunity to enter short positions or prepare for declining prices.
Types of Bearish Divergences
Bearish divergences are classified based on their reliability and strength, offering a hierarchy that traders can use to determine the level of risk involved in their trades. Let’s dive into the different types of bearish divergences based on their level of strength.
Class A: High-Strength Bearish Divergences
These types of bearish divergences offer the most reliable signals for potential reversals, especially following strong uptrends. Pro Traders prioritize Class A divergences for their clear and decisive signals:
- Classic Bearish Divergence
- Extended Bearish Divergence
Class B: Medium-Strength Bearish Divergences
Class B Bearish divergences provide reliable signals but may require additional confirmation before traders act. These divergences often occur in moderately trending markets, and though they indicate weakening momentum, the price may take longer to reverse.
- Exaggerated Bearish Divergence
- Hidden Bearish Divergence
Class C: Low-Strength
Class C divergences are less reliable and often require additional factors, such as other technical indicators or price action confirmation, to be used effectively. They are usually found in volatile or choppy markets, making them harder to trade without advanced experience.
- Complex Bearish Divergence
Class A: High-Strength Bearish Divergences
As you have understood that bearish divergences have different types, we will move to explain them one by one:
Definition of Classic Bearish Divergence
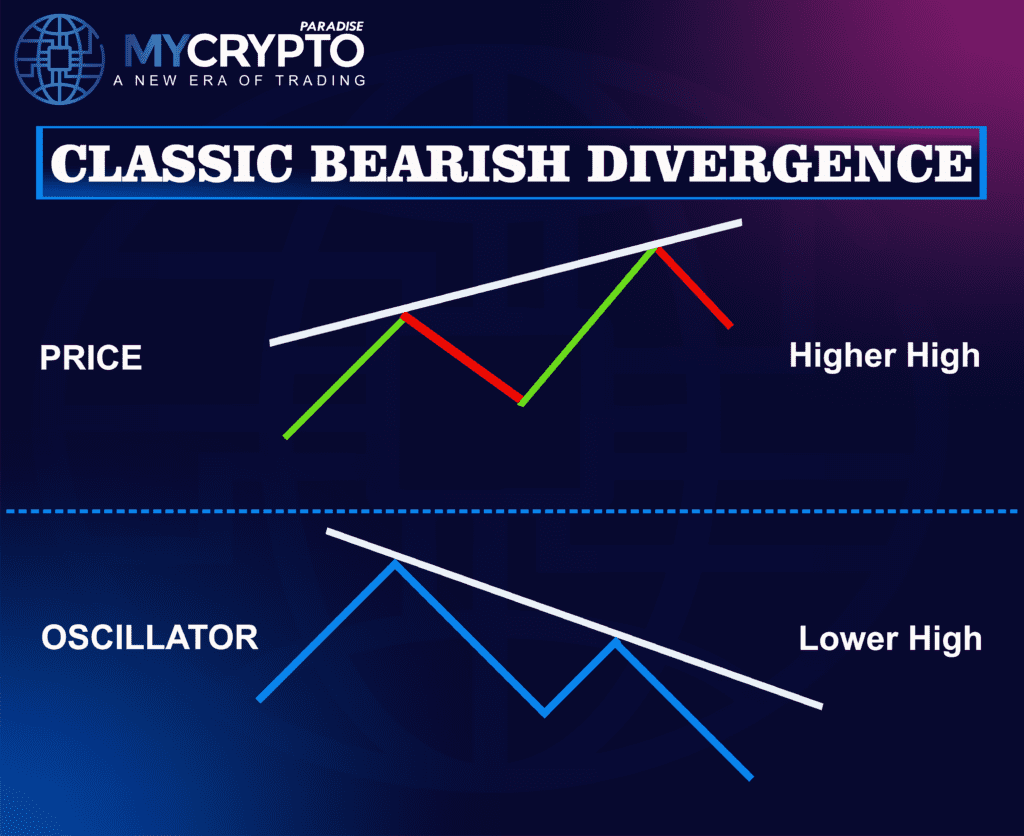
Classic bearish divergence is one of the most reliable signals that pro traders use to identify potential market reversals. It occurs when the price of an asset forms higher highs, but a momentum indicator, such as the RSI (Relative Strength Index), MACD (Moving Average Convergence Divergence), or Stochastic Oscillator, forms lower highs. This divergence between the price action and the technical indicator signals that the upward momentum is losing steam. This sets the stage for a possible downward shift in the market.
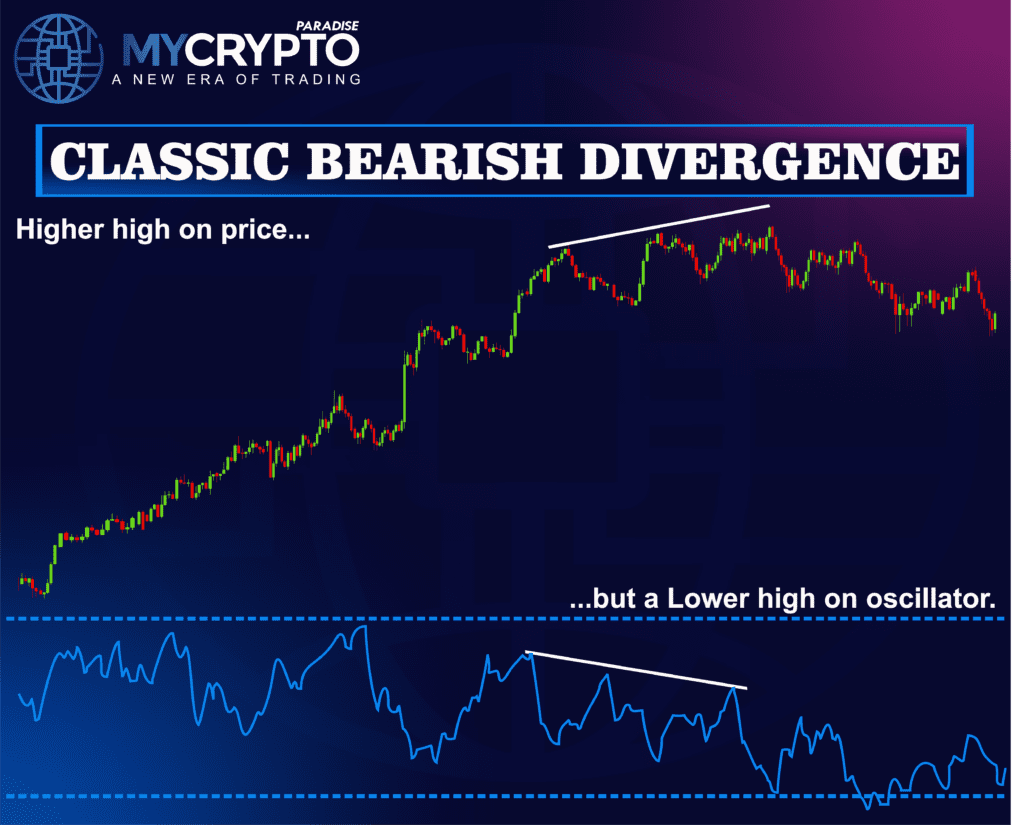
Classic bearish divergence is a powerful tool for serious traders that offers a secure and strategic way to identify market turning points. Recognizing this pattern early allows traders to protect their positions and strategically plan their entry into short trades with greater safety and confidence.
How Pro Traders Spot Classic Bearish Divergence?
Classic bearish divergence is a powerful tool for pro traders which helps them secure trades by recognizing early signs of weakening bullish momentum. Although it might sound complex, with some practice and a disciplined approach, you can strategically spot these divergences using key technical indicators like RSI, MACD, and the Stochastic Oscillator. Let’s break down how you can efficiently spot classic bearish divergence with these technical indicators:
Using the RSI (Relative Strength Index)
The RSI is a momentum oscillator that ranges between 0 and 100, providing insights into the speed and change of price movements. It’s often used to identify overbought or oversold conditions which makes it an ideal tool for spotting bearish divergence.
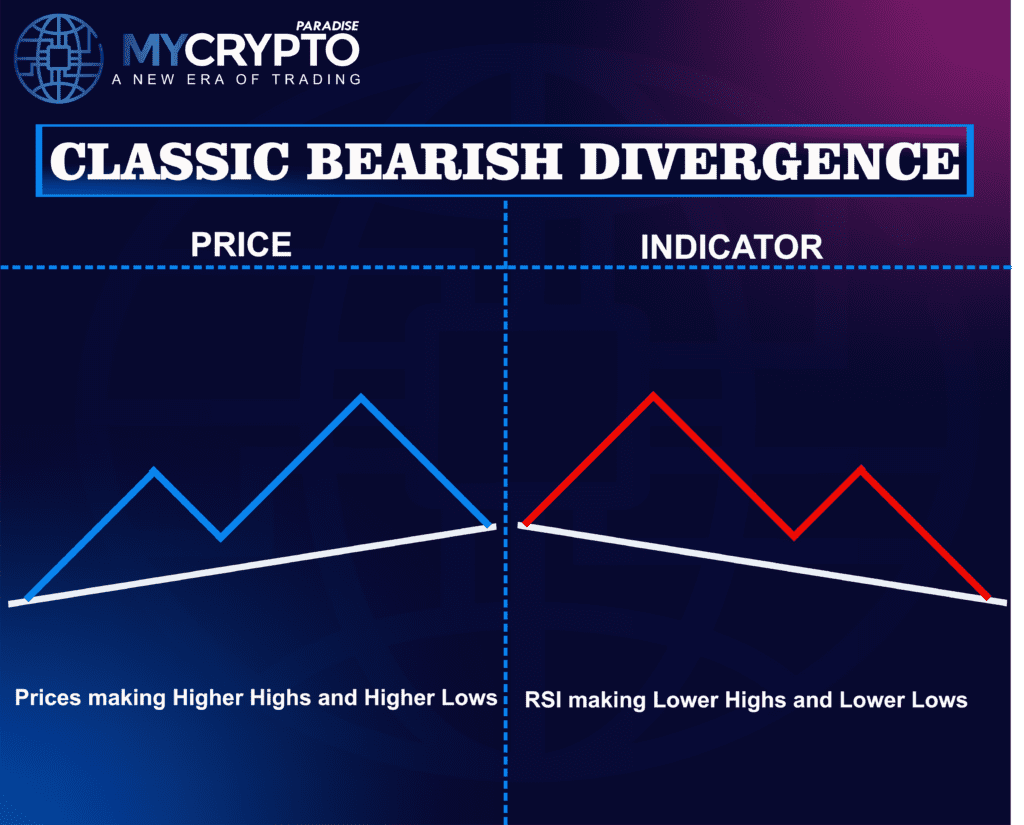
- Look for Higher Highs in Price: You can start by analyzing the price action on your chart. Identify a point where the price makes a higher high compared to a previous high.
- Check the RSI for Lower Highs: While the price is making higher highs, you need to observe the RSI. If it’s forming lower highs, this indicates a divergence between price action and momentum—your classic bearish divergence.
- Wait for Confirmation: Before taking action, you need to ensure that the RSI starts moving downward after forming the lower high. This downward movement serves as confirmation that the divergence is valid, and a potential reversal could be imminent.
Using the MACD (Moving Average Convergence Divergence)
The MACD is a trend-following momentum indicator that illustrates the relationship between two moving averages of an asset’s price. It’s highly favored among professional traders for spotting divergences and gauging market momentum.
- Identify Higher Highs in Price: You can begin by finding a series of higher highs in the price chart. This is the first sign of potential divergence.
- Observe the MACD Line or Histogram for Lower Highs: While the price continues to rise, you need to check if the MACD line or the histogram is forming lower highs. This discrepancy suggests that bullish momentum is weakening.
- Wait for Confirmation: Confirmation comes when the MACD line crosses below the signal line, or when the histogram starts declining. This indicates that the divergence could lead to a bearish reversal.
Using the Stochastic Oscillator
The Stochastic Oscillator is another useful tool to spot classic bearish divergence. It compares a closing price to a range of its prices over a certain period, which makes it effective in identifying weakening momentum.
- Find Higher Highs in Price: As with the previous indicators, start by identifying higher highs in the price action.
- Check the Stochastic Oscillator for Lower Highs: While the price is making higher highs, the Stochastic Oscillator should be forming lower highs. This divergence signals a potential bearish shift.
- Wait for the Oscillator to Move Down: Before entering a trade, wait for the Stochastic Oscillator to start moving downward after forming the lower high. This movement confirms the divergence and the potential for a price reversal.
You can spot classic bearish divergence using these different technical indicators. Spotting classic bearish divergence requires emotional discipline and patience. Pro traders follow a consistent approach and avoid irrational decisions; for example, they wait for confirmation from technical indicators before entering a trade.
How Can You Trade Classic Bearish Divergence?
Trading classic bearish divergence is a strategic approach that pro traders use to capitalize on weakening bullish momentum. This technique offers a safe and reliable way to position yourself for potential reversals. Here’s how you can implement a professional trading plan for classic bearish divergence:
Entry Point:
Your entry point in classic bearish divergence is crucial for maximizing your profits and minimizing risk. Here’s how you can enter the trade:
- Wait for Confirmation: Whether you’re using RSI, MACD, or the Stochastic Oscillator, wait for the indicator to confirm the divergence by moving downward. This could mean the RSI starts declining, the MACD histogram turns negative, or the Stochastic Oscillator begins its downtrend.
- Place a Short Order: Once your indicator confirms the divergence and shows signs of weakening momentum, enter a short position. This is the point where you’re betting on the price to reverse and move lower, based on the bearish signals.
Pro traders ensure they enter trades only when all conditions are met. By being strategic and disciplined with their entries, they avoid jumping into trades prematurely, which enhances their overall success and security.
Stop Loss:
Stop-loss is an essential part of any safe trading strategy. It protects your capital and ensures you’re not exposed to unnecessary risk if the market moves against your position. Here’s where to place your stop-loss for classic bearish divergence:
- Above the Recent High: A common stop-loss placement is slightly above the recent swing high that formed during the price action leading up to the divergence. This ensures you are protected if the price unexpectedly continues upward.
- Use a Fixed Percentage-Based Stop: Another approach is to place a stop-loss based on a percentage of your total account balance. This method allows you to manage your capital systematically by ensuring that you never lose more than a predefined percentage on any given trade.
This aspect of money management is key to secure trading as it allows you to trade with confidence while maintaining the safety of your capital. Pro traders never trade without a stop-loss, as it’s a protective measure for long-term success.
Take Profit:
Now that you’ve entered the trade and set your stop-loss, the next step is to determine your take-profit levels. This is where you’ll exit the trade and lock in profits:
- Target Key Support Levels: Look for key support levels on your price chart. These levels are where the price might reverse again or consolidate, so they make excellent places to secure your profits.
- Risk-Reward Ratio: A professional strategy is to use a risk-reward ratio to determine your take-profit point. For example, if you risk 1% of your account on the trade, aim for a 2% or 3% gain. This tactic ensures that even with some losses, you’re still coming out ahead in the long run.
Successful traders stick to their strategy and avoid greed by setting and adhering to their profit targets. This approach fosters a mindset of emotional control and protective trading. If you’re new to all this, you can consult with the Professional Traders of ParadiseTeam.
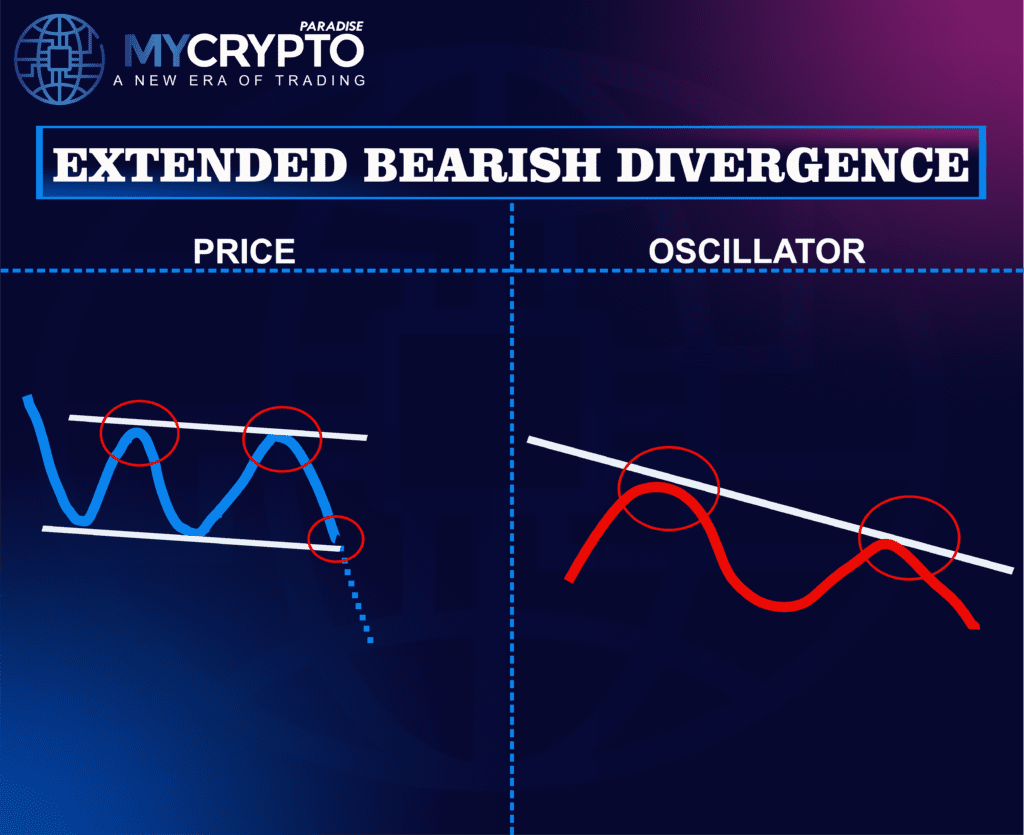
What is Extended Bearish Divergence?
Extended bearish divergence is a more subtle yet important signal in the crypto trading world. It occurs when the price makes a significantly higher high, but the oscillator (like RSI, MACD, or Stochastic) forms only a slightly higher high or even remains flat.
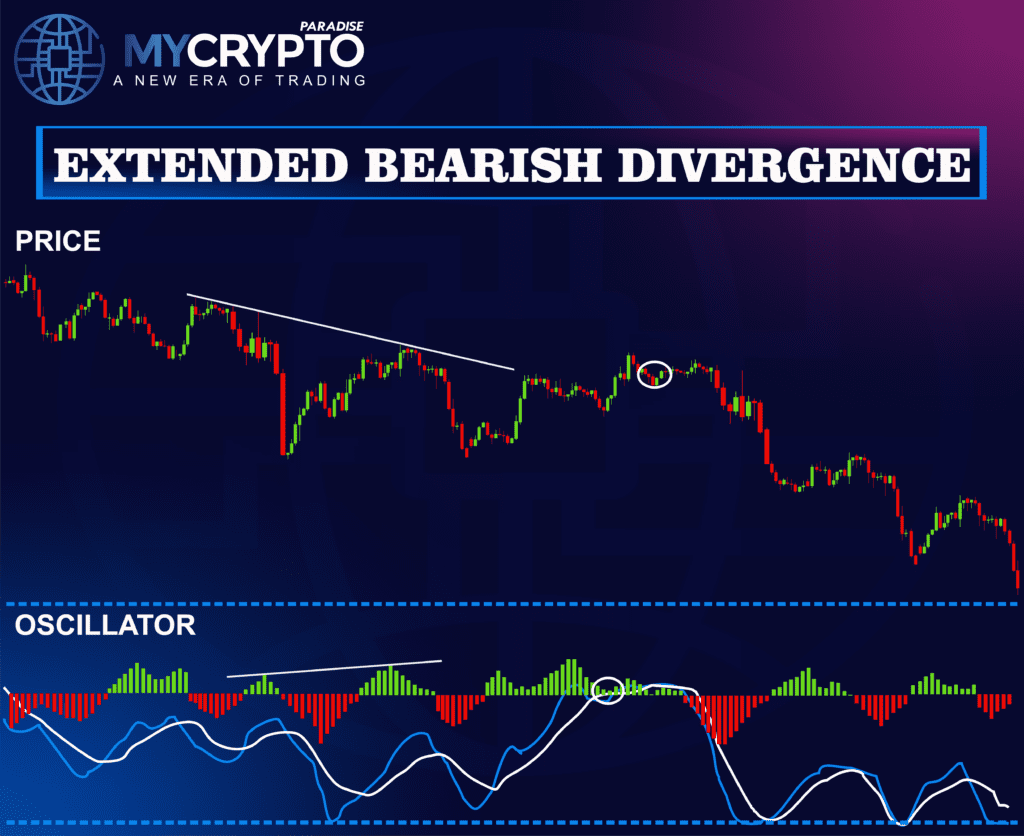
This divergence indicates a weakening of bullish momentum, even though the price is continuing to rise. Professional traders value this divergence because it provides an early warning that the upward trend is losing steam and a potential reversal could be on the horizon.
How Can You Spot Extended Bearish Divergence?
You need a professional understanding of oscillators and price action to spot the extended bearish divergence. Let’s walk through how you can spot this signal using various indicators:
Using the RSI (Relative Strength Index)
The RSI is a trusted momentum oscillator, and when spotting extended bearish divergence, it becomes a powerful tool:
- Look for Higher Highs in Price: Start by observing a series of higher highs in the price action. This is the key to extended divergence, as the price continues to push upward aggressively.
- Check the RSI for Flat or Slightly Higher Highs: While the price is making higher highs, the RSI may only form a slightly higher high or remain flat. This discrepancy between the price and the RSI indicates that the bullish momentum is weakening, even though the price keeps rising.
- Confirmation: Wait for the RSI to turn downward or its movement to slow down after the divergence appears. This serves as confirmation that the extended bearish divergence is valid and could lead to a price reversal.
Using the MACD (Moving Average Convergence Divergence)
The MACD is another excellent indicator for spotting extended bearish divergence:
- Identify Higher Highs in Price: As always, you need to begin by identifying a series of higher highs in the price action to spot the extended bearish divergence.
- Observe the MACD Line or Histogram: While the price climbs, the MACD line may form only a slightly higher high or even stay flat. This divergence shows that bullish momentum is weakening, despite the continued upward movement in price.
- Wait for MACD Confirmation: Confirmation comes when the MACD line begins to cross below the signal line or when the histogram starts moving into negative territory. This indicates that momentum has shifted and provides you with a safe entry for a short position.
Using the Stochastic Oscillator
The Stochastic Oscillator compares the current closing price to its price range over a specified period, making it ideal for spotting extended divergences:
- Look for Higher Highs in Price: First, you need to identify whether the price is making higher highs or not. You need to spot where the price is making higher highs.
- Check for Flat or Slightly Higher Highs in the Stochastic Oscillator: While the price rises, the Stochastic Oscillator will form flat or barely higher highs, showing that the strength of the uptrend is weakening.
- Confirmation: When the Stochastic Oscillator crosses below its signal line, it confirms the divergence and the likelihood of an upcoming reversal. This confirmation is essential for maintaining a secure and professional crypto trading strategy.
How Can You Trade Extended Bearish Divergence?
Trading extended bearish divergence requires patience, discipline, and a focus on protecting your capital. Pro traders often consider this divergence to be a powerful signal, but it’s crucial to approach it with a strategic mindset. Here’s how you can trade extended bearish divergence:
Entry Point:
The best time to enter a trade based on extended bearish divergence is after the divergence has been confirmed by your indicators. Here’s how you can identify the right entry point:
- Wait for Oscillator Confirmation: Whether you’re using RSI, MACD, or Stochastic, always wait for the oscillator to confirm the divergence by moving downward. This ensures you’re entering the trade at a safe point when the probability of a reversal is higher.
- Place a Short Order: Once confirmation is in place, enter a short position. This is when you’re betting on the price to move lower after the bullish momentum weakens.
By following this strategic process, you ensure that your trade is aligned with market conditions while reducing the chances of emotional decision-making.
Stop Loss:
Stop-loss placement is crucial in ensuring protective trading. Here’s where to place your stop-loss when trading extended bearish divergence:
- Above the Recent High: The most common place for your stop-loss is above the most recent high. This ensures that you’re protected if the market continues rising unexpectedly.
- Use a Fixed Percentage-Based Stop: A percentage-based stop loss allows you to manage your risk systematically. This keeps your losses within a predefined limit, ensuring safe trading while still allowing room for the trade to develop.
Remember, pro traders never trade without a stop-loss, as it’s a fundamental part of protective capital management. It safeguards your capital and ensures that any losses are minimized.
Take Profit:
Take-profit levels are essential for locking in profits during trading extended bearish divergence:
- Target Key Support Levels: Use support levels from previous price action as your take-profit targets. These levels are often where the price may bounce or consolidate, making them ideal for securing profits.
- Risk-Reward Ratio: Always maintain a favorable risk-reward ratio. A common professional approach is to aim for at least a 2:1 or 3:1 risk-reward ratio. This ensures that you’re strategically locking in gains even if some trades result in losses.
By using a disciplined take-profit strategy, you can achieve long-term consistency in your trading while enhancing your overall success. If you’re new to all this, you can consult with the ParadiseFamilyVIP 🎖️.
Class B: Medium-Strength Bearish Divergences
As we have discussed the types of Class A Bearish divergences, now let’s discuss the types of medium strength divergences:
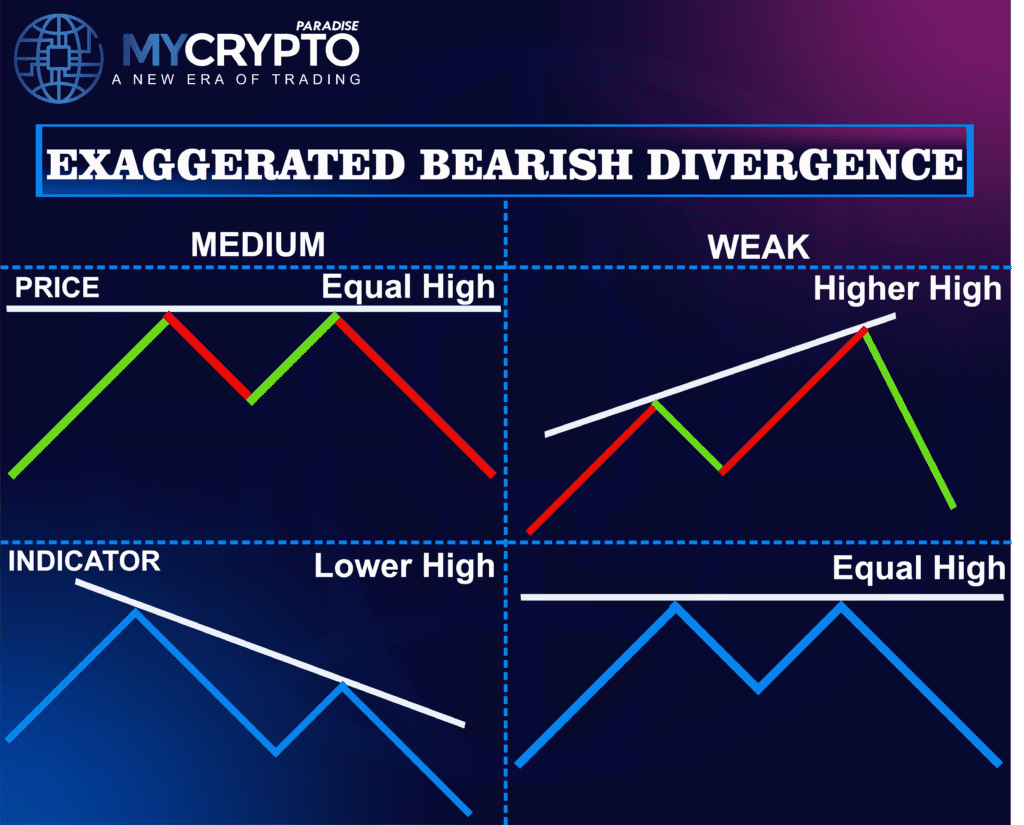
Exaggerated Bearish Divergence
Exaggerated bearish divergence is a less common but highly reliable signal for traders looking to spot an imminent downturn in price. It occurs when the price forms a double top (equal highs), but the oscillator, such as the RSI, MACD, or Stochastic, forms a lower high. Essentially, this divergence shows that while the price has stalled at a previous high level, the underlying momentum is fading, signaling potential weakness in the crypto market.
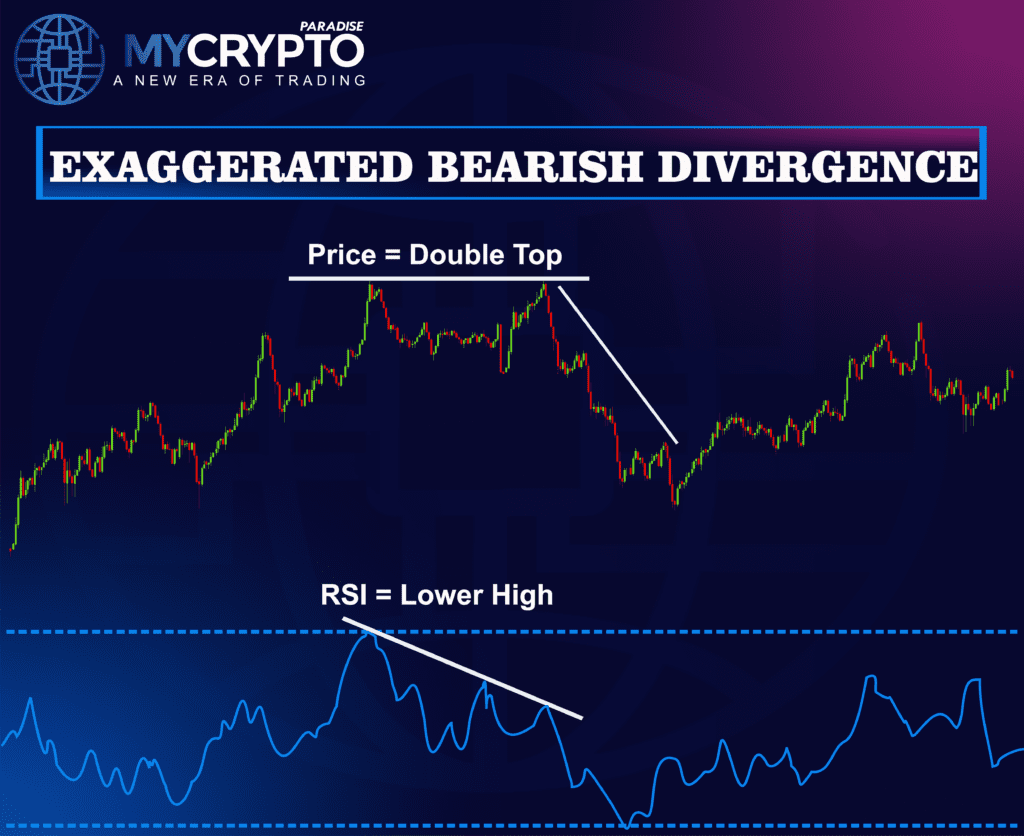
Exaggerated bearish divergence is considered moderately strong. It is not as aggressive as the classic or extended versions but offers a secure opportunity to catch the market shift early. By reading these subtle signs, serious traders can adopt a protective approach. In the realm of emotional discipline, this type of divergence demands that crypto traders avoid getting swept away by market euphoria and instead focus on consistency and patience.
How Can You Spot Exaggerated Bearish Divergence?
Let’s discuss how you can efficiently spot it using popular indicators while maintaining security in your trading strategy:
Using the RSI (Relative Strength Index)
The RSI is an exceptional tool for finding exaggerated bearish divergence, giving you a clear window into momentum shifts:
- Look for Equal Highs in Price: You need to start by observing the price chart. First, identify points where the price forms a double top, with equal highs. This is the key setup for spotting exaggerated divergence.
- Check for Lower Highs on the RSI: While the price remains at the same level, the RSI should be forming a lower high. This shows that the buying strength behind the price is waning, which signals a potential market reversal.
- Wait for Confirmation: For safe trading, ensure the RSI moves downward after forming a lower high. This confirmation allows you to strategically plan your entry without getting caught in a false signal.
Using the MACD (Moving Average Convergence Divergence)
The MACD is a valuable momentum-based indicator for spotting exaggerated bearish divergence:
- Identify Equal Highs in Price: You always need to look for double tops where the price is unable to break through previous resistance.
- Observe Lower Highs on the MACD Line or Histogram: While the price struggles at the same high, the MACD line or histogram should be forming lower highs, indicating reduced bullish momentum.
- Confirmation: You need to wait for the MACD to cross below the signal line or for the histogram to turn negative. This confirmation is essential for ensuring protective risk management and making safe entry decisions.
Using the Stochastic Oscillator
The Stochastic Oscillator provides another layer of insight when it comes to exaggerated bearish divergence:
- Find Equal Highs in Price: As always, begin by spotting a double top in the price action. If you find the double top then you can move to observe the indicator.
- Check for Lower Highs on the Stochastic Oscillator: While the price is forming equal highs, the Stochastic Oscillator should form lower highs, indicating weakening momentum.
- Confirmation: For added security, you need to wait until the Stochastic crosses below its signal line. This movement solidifies the divergence and confirms that a reversal is more likely.
What’s Trading Strategy For Exaggerated Bearish Divergence?
Now that you’ve learned how to spot exaggerated bearish divergence, let’s discuss how you can professionally trade it:
Entry Point:
When you’re trading exaggerated bearish divergence, then you need to wait for the right moment to act and ensure your trades are strategically timed and executed:
- Wait for Oscillator Confirmation: As with any divergence, confirmation from your chosen oscillator is key. Whether it’s the RSI, MACD, or Stochastic, you need to ensure the oscillator is showing a lower high and turning downward before entering.
- Place a Short Trade: After confirmation, you can place a short order. This is when you expect the price to reverse and take advantage of the reduced buying strength.
- Avoid Jumping in Too Early: Patience and emotional discipline are critical here. Jumping into a trade before the divergence is fully confirmed can lead to unnecessary losses.
Stop Loss:
Stop-loss placement is a crucial part of maintaining safe trading and protecting your capital. Here’s how to set an effective stop-loss for exaggerated bearish divergence:
- Above the Recent High: Placing your stop-loss above the double top (recent high) ensures that if the market continues upward, your losses will be contained.
- Fixed Percentage-Based Stop: Using a percentage-based stop-loss is a tactical way to ensure secure risk management. This method allows you to limit potential losses while keeping room for the trade to develop.
Take Profit:
Here’s how you can take profit strategically when you’re trading exaggerated bearish divergence:
- Target Key Support Levels: Use previous support levels from price action as take-profit targets. These levels offer logical places for the price to find a temporary floor, making them ideal for securing profits.
- Risk-Reward Ratio: Always maintain a favorable risk-reward ratio, such as 2:1 or 3:1, ensuring that even if some trades don’t go in your favor, the overall strategy remains profitable. If you’re new to all this, you can consult with the Professional Traders of ParadiseTeam.
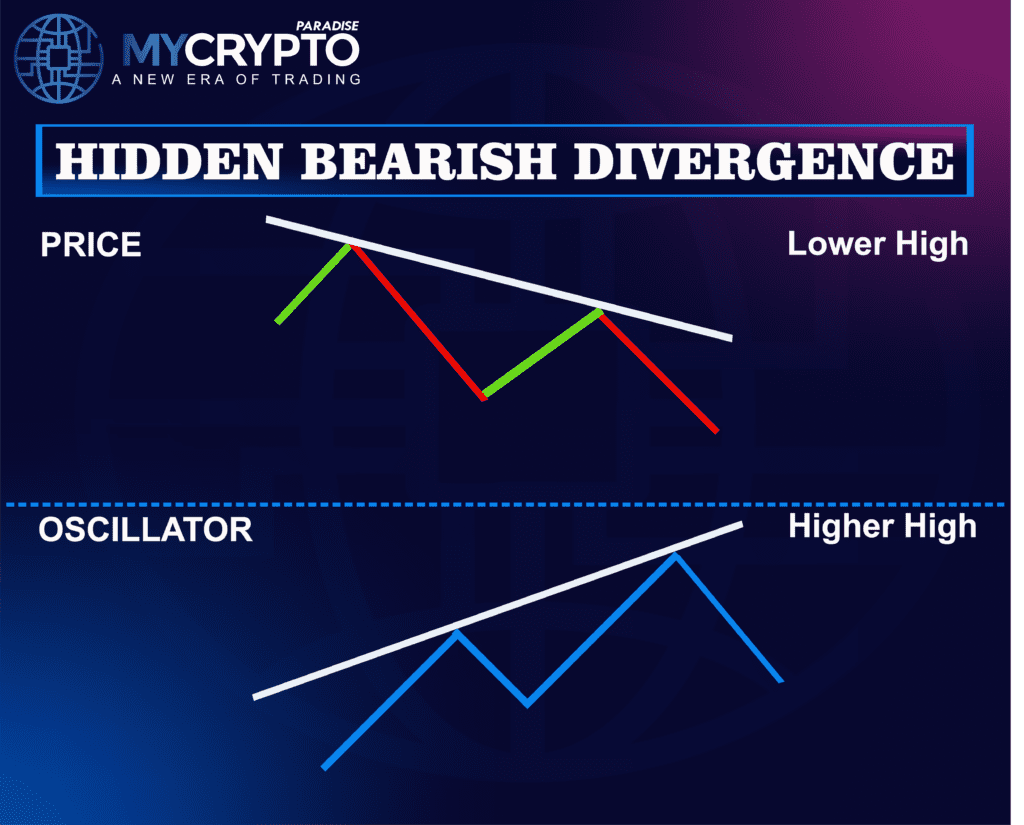
What is Hidden Bearish Divergence?
Hidden bearish divergence is a powerful signal that often goes unnoticed by less experienced traders but is a favorite among pro crypto traders for its ability to confirm trends. Unlike classic divergence, which signals a reversal, hidden bearish divergence indicates the continuation of an existing downtrend. It occurs when the price forms a lower high, while the oscillator (such as the RSI, MACD, or Stochastic) forms a higher high.

This divergence tells serious traders that despite a temporary uptick in momentum, the overall market trend remains bearish. The strength of this type of divergence is moderate to strong, depending on the context, but its true value lies in confirming the continuation of the downward trend. Hidden bearish divergence offers a secure way to trade by allowing you to add positions in a downtrend rather than fighting the prevailing market direction. This makes it a valuable tool for traders who prioritize systematic approaches to crypto trading and money management.
As we have seen the definition of the hidden bearish divergence, let’s see how to spot it:
How Can You Spot Hidden Bearish Divergence?
Spotting hidden bearish divergence may seem subtle but with the right strategy and tools, professional traders can identify this pattern easily. Here’s how you can spot it using popular indicators:
Using the RSI (Relative Strength Index)
The RSI remains one of the most efficient tools for identifying hidden bearish divergence. Here’s how to spot it:
- Look for Lower Highs in Price: You need to start by identifying a lower high in the price action. This is key because it shows that the market is still trending downward, even if there’s a temporary rally.
- Check for Higher Highs in the RSI: While the price forms a lower high, the RSI should form a higher high, signaling that bullish momentum is temporarily increasing but not enough to change the broader trend. This is a classic sign of hidden bearish divergence.
- Confirmation: For secure trading, you should ensure the RSI starts moving downward after forming a higher high. This downward movement confirms that the divergence is valid and that the downtrend is likely to continue.
Using the MACD (Moving Average Convergence Divergence)
The MACD is another valuable tool for spotting hidden bearish divergence:
- Identify Lower Highs in Price: You should begin by locating a series of lower highs on the price chart which indicates that the downtrend remains intact.
- Observe Higher Highs on the MACD Line or Histogram: While the price makes lower highs, the MACD line or histogram should form higher highs, indicating a weakening in bearish momentum but not enough to reverse the trend.
- Confirmation: You should wait for the MACD line to cross below the signal line or for the histogram to start ticking downward. This serves as confirmation that the divergence is valid and allows you to trade in line with the prevailing downtrend.
Using the Stochastic Oscillator
The Stochastic Oscillator is also excellent for spotting hidden bearish divergence:
- Find Lower Highs in Price: You can start by identifying lower highs in the price action to confirm that the downtrend is still in place.
- Check for Higher Highs in the Stochastic Oscillator: While the price makes lower highs, the Stochastic Oscillator should form higher highs, indicating a temporary surge in bullish momentum. This is the hallmark of hidden bearish divergence.
- Confirmation: For secure crypto trading and protective risk management, wait until the Stochastic crosses below its signal line, confirming the divergence and the continuation of the downtrend.
How Can You Trade Hidden Bearish Divergence?
Hidden bearish divergence presents a strategic opportunity to trade in the direction of the trend. Let’s explore how you can capitalize on this signal for success:
Entry Point:
Trading hidden bearish divergence requires discipline and patience to ensure you don’t rush into a trade prematurely. Here’s how to enter a position:
- Wait for Oscillator Confirmation: After spotting the hidden divergence, wait for your chosen oscillator to confirm the signal by starting to move downward. Whether it’s the RSI, MACD, or Stochastic, this confirmation ensures the trade aligns with the prevailing downtrend.
- Enter a Short Position: Once the confirmation is in place, enter a short position. Since this type of divergence signals trend continuation, you’ll be trading in line with the broader market move.
Pro traders understand the importance of emotional discipline. You always wait for the perfect setup and don’t rush into a trade based on temporary market fluctuations.
Stop Loss:
To ensure safe trading and protect your capital, it’s essential to have a well-placed stop loss. Here’s how to do it effectively:
- Above the Recent High: Place your stop loss slightly above the recent high (lower high in price). This protects your position in case the market reverses unexpectedly.
- Use a Percentage-Based Stop-Loss: A fixed percentage-based stop-loss can provide secure and great capital management. Choose a percentage based on your risk tolerance to minimize losses while giving the trade enough room to develop.
You always need to use a stop loss whenever you’re crypto trading. Let’s see how you can take profits:
Take Profit:
When trading hidden bearish divergence, taking profit at the right levels is critical for locking in gains while maintaining safe trading practices:
- Target Key Support Levels: You need to identify previous support levels from price action as potential take-profit zones. These areas are where the price is likely to stall or bounce, making them ideal for taking partial or full profits.
- Risk-Reward Ratio: Aim for a favorable risk-reward ratio, such as 2:1 or higher, to ensure that even if some trades don’t play out, your overall strategy remains profitable.
This is how you can set up your take profit levels when you’re trading hidden bearish divergence. If you’re new to all this, you can consult with the Professional Traders of ParadiseTeam.
Class C: Low-Strength
As we have discussed the types of medium strength bearish divergences of Class B, let’s discuss the Class C types:
Introducing Complex Bearish Divergence
Complex Bearish Divergence, as its name suggests, is more intricate than your standard divergences, demanding a higher level of professional analysis and discipline. This type of divergence involves multiple instances of divergence between price and momentum indicators over a longer period. It often occurs when price moves in a persistent uptrend, forming higher highs, while an oscillator like RSI, MACD, or Stochastic shows inconsistent or weaker highs.
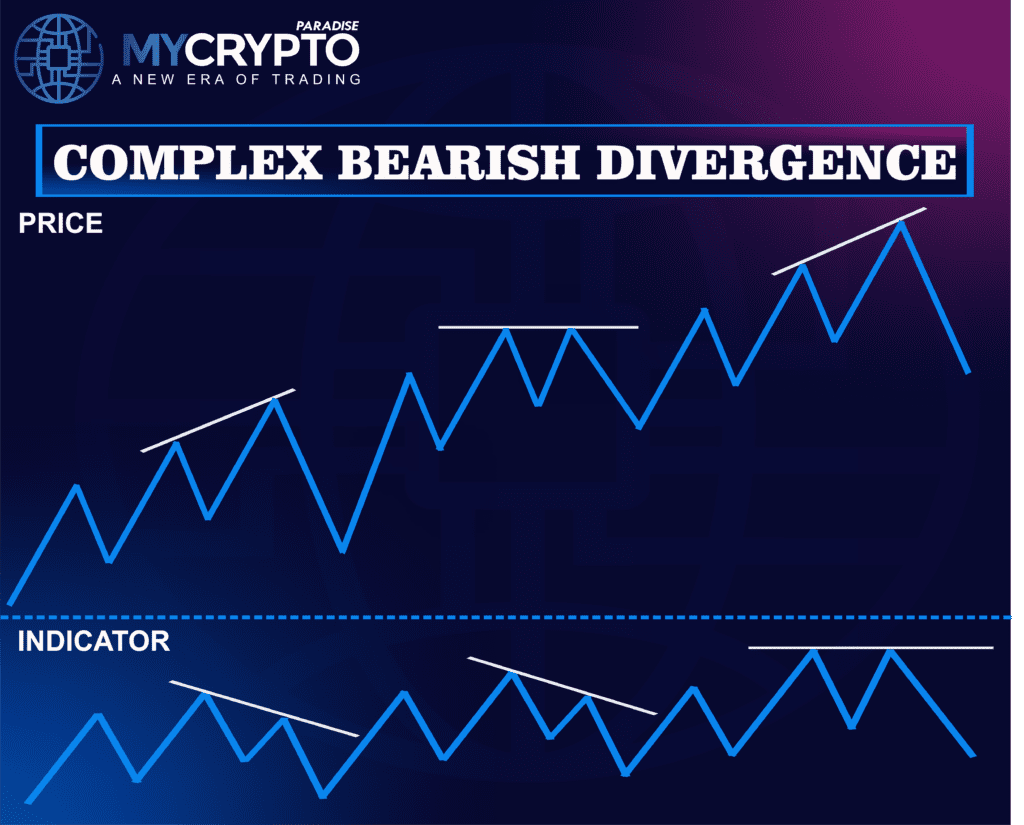
Unlike classic or hidden divergences, complex bearish divergence signals a more gradual loss of bullish momentum, indicating that a trend reversal may be approaching but is not immediately imminent. This complexity adds to its strength, making it a robust signal for traders who are willing to exhibit patience and have a clear strategy in place for both timing and trade management.
Complex bearish divergence is often regarded as a more serious and reliable signal for a significant trend reversal. Because it unfolds over multiple price swings, it indicates a slow but steady weakening of buying pressure. When spotted correctly, it offers secure and protective opportunities to trade the downside while minimizing risks associated with false signals.
How Pro Traders Can Spot Complex Bearish Divergence?
It requires a pro mindset with an eye for details and discipline to spot complex bearish divergence. Here’s how professional traders identify this form of divergence using various indicators:
Using the RSI (Relative Strength Index)
The RSI, which tracks momentum and overbought/oversold conditions, is excellent for identifying complex bearish divergence across multiple price swings.
- Identify Multiple Higher Highs in Price: You can start by observing a price chart that shows a series of higher highs over an extended period. This is crucial, as complex divergence doesn’t occur on a single swing but involves several peaks.
- Look for Oscillator Weakenings: While the price forms these higher highs, the RSI will show progressively weaker highs or flatlines. The key to spotting complex divergence is identifying these small but significant discrepancies between price and momentum.
- Wait for Clear Confirmation: Patience is crucial in spotting complex divergence. You’ll want to see a more pronounced weakness in the RSI that confirms the divergence over multiple highs. Professional traders often wait for the RSI to drop below a certain threshold (e.g., 50) to confirm the weakening momentum before acting.
Using the MACD (Moving Average Convergence Divergence)
The MACD is a favorite of pro traders for identifying complex divergence because it visualizes the relationship between different moving averages and provides a more comprehensive picture of momentum shifts.
- Watch for an Extended Price Uptrend: You always need to look for a sustained price rally where higher highs are made consistently over several trading sessions or weeks. This shows that bulls are in control but possibly running out of steam.
- Examine the MACD Line or Histogram: As the price forms new highs, the MACD line or histogram should start showing diminishing returns, with either the line flattening or the histogram bars shrinking. This weakening of momentum over time is indicative of complex divergence.
- Confirm the Signal with a Crossover: The best confirmation comes when the MACD line crosses below the signal line after several instances of divergence. Pro traders consider this to be a highly reliable signal that the uptrend is losing momentum and a reversal is likely.
Using the Stochastic Oscillator
The Stochastic Oscillator is particularly effective in spotting complex divergence because it compares the closing price to a range over a set period which makes it ideal for spotting gradual weakening in momentum:
- Identify Consistent Higher Highs in Price: Just like with the RSI and MACD, begin by identifying multiple higher highs in the price action. The more highs, the better confirmation for complex divergence.
- Check the Stochastic for Diverging Peaks: As the price keeps climbing, the Stochastic Oscillator will form either progressively lower peaks or flat peaks. This divergence signals that although the price is increasing, the underlying momentum is weakening, and the buyers are losing strength.
- Wait for the Oscillator to Cross Downward: For added security and discipline, wait for the Stochastic to cross downward after forming a lower high. This is your signal that the momentum has fully reversed, and a price downturn is likely on the horizon.
How Can You Trade Complex Bearish Divergence?
Trading complex bearish divergence requires not only emotional discipline but also a strategic approach. Here’s how you can capitalize on complex bearish divergence in cryppto trading:
Entry Point:
A key feature of trading complex bearish divergence is the need for patience and timing. Rushing into a trade too soon can lead to insecure trades, but with the right setup, you can enter with confidence:
- Wait for Oscillator Confirmation: After identifying the complex divergence, wait for confirmation from your chosen oscillator (RSI, MACD, or Stochastic). Once the oscillator shows clear signs of reversing downward, you can start planning your trade entry.
- Enter a Short Position: The ideal entry is after the oscillator confirms that the upward momentum is weakening, and the price fails to make a significant new high. By entering here, you align yourself with the emerging downtrend rather than fighting it.
Complex bearish divergence often takes time to play out. Pro traders rely on discipline to wait for the right setup to ensure they don’t enter prematurely and expose themselves to unnecessary risk.
Stop Loss:
Trading safely means always having a protective stop-loss in place. Here’s how to manage your capital effectively when trading complex bearish divergence:
- Above the Highest High: Place your stop-loss just above the most recent high that formed during the complex divergence. This ensures you’re protected if the market breaks out unexpectedly and moves higher.
- Consider a Wider Stop: Because complex divergence signals unfold over a longer period, you might need to give the trade more breathing room. A wider stop-loss can ensure you’re not stopped out by minor fluctuations.
Take Profit:
Taking profit when trading complex divergence requires patience and a clear strategy for maximizing your gains while managing risks:
- Target Support Levels: Use previous support levels as your take-profit zones. Since complex divergence signals a stronger reversal, targeting deeper levels of support ensures you maximize your profit potential.
- Risk-Reward Ratio: Aim for a favorable risk-reward ratio (e.g., 2:1 or 3:1) to ensure that your trade is profitable even if not all signals play out as planned. This helps maintain consistency in your trading results.
By using these parameters, you can trade complex bearish divergence easily. We have discussed all of the bearish divergences based on their strength. If you’re new to all this, you can consult with the Professional Traders at ParadiseFamilyVIP 🎖️.
Conclusion
The art of trading bearish divergences is a crucial skill for any professional trader or newbie looking to achieve long-term success in the markets. Whether you’re dealing with Classic, Extended, Exaggerated, Hidden, or Complex Bearish Divergences, understanding these signals allows you to strategically position yourself in the market. By learning how to spot bearish divergences using reliable indicators like RSI, MACD, and Stochastic, you can create protective strategies that secure your capital while maximizing profit potential.
The knowledge you’ve gained from this article is valuable, but it won’t secure long-term profitability on its own. While it gives you an edge, consistent success over the next 3+ years requires combining it with effective trading strategies and tactics.
At ParadiseFamilyVIP 🎖️, we merge technical analysis, on-chain data, sentiment monitoring, and whale psychology with tested strategies to deliver premium crypto signals and portfolio management, ensuring sustained profitability.
👉To check availability in ParadiseFamilyVIP 🎖️ (Click it)
If you’re committed to leveling up to professional trading, joining our inner circle is the best step. Seats are limited, so join the waiting list if needed.


