


Chart Patterns Explained
In short
A descending triangle is a bearish continuation pattern characterized by a flat support line and a downward-sloping resistance line connecting lower highs. It indicates increasing selling pressure and often results in a price breakdown below the support level. This pattern typically forms during a downtrend, signaling that sellers are in control.
Introduction
Technical analysis is a popular method used by traders and investors to predict future price movements of financial assets. One common pattern that technicians look for is the bearish descending triangle pattern. In this article, we will delve into the intricacies of the bearish descending triangle pattern, its formation, interpretation, and potential trading strategies.
What is a Descending Triangle Pattern?
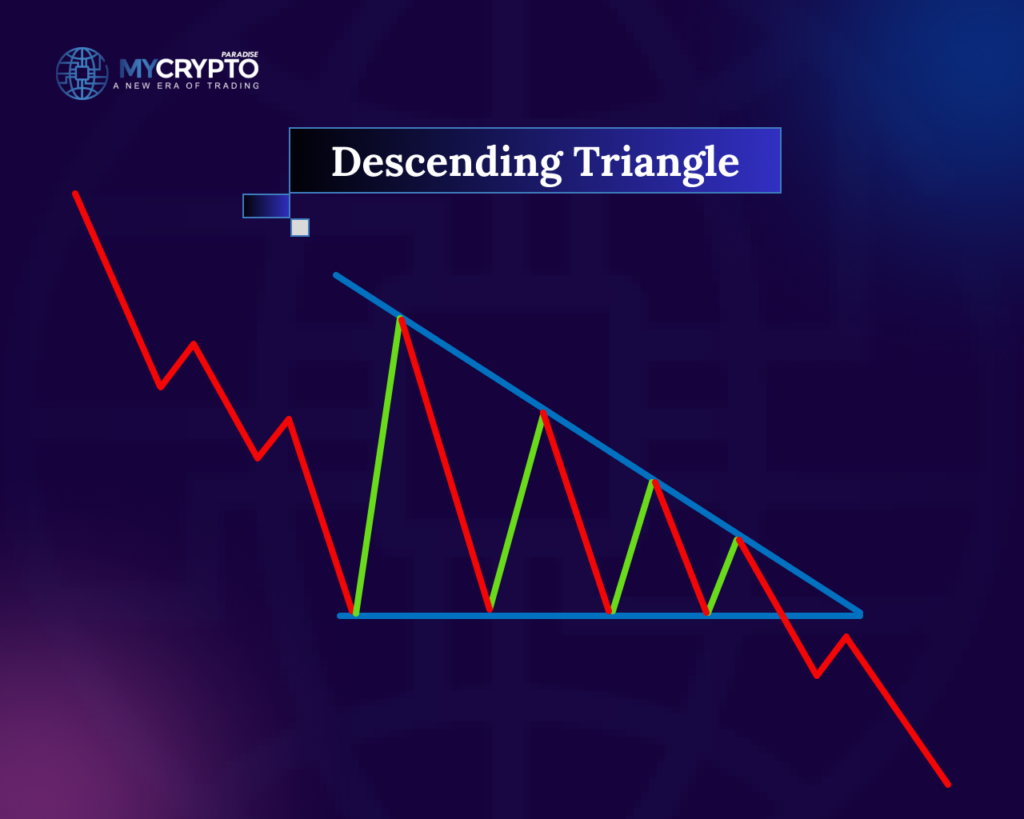
A descending triangle pattern is a bearish continuation pattern that occurs during a downtrend. It is formed by drawing a horizontal trendline at the swing lows and a descending trendline connecting the lower highs. These two trendlines converge to form a triangle-like pattern, hence the name “descending triangle.”
Formation of the Bearish Descending Triangle Pattern
The bearish descending triangle pattern is formed when sellers dominate the market, leading to lower highs and a relatively stable support level. As the price reaches the support level multiple times, it creates a horizontal trendline.
Meanwhile, the descending trendline is formed as lower highs are established. The convergence of these trendlines signifies a period of consolidation and indecision before a potential continuation of the downtrend.
Characteristics of the Bearish Descending Triangle Pattern

1.Duration: The duration of the pattern can vary, ranging from a few weeks to several months, depending on the timeframe being analyzed.
2. Volume: Volume tends to diminish as the pattern develops, indicating decreasing market participation and a loss of bullish momentum.
3. Support and Resistance Levels: The horizontal trendline acts as a strong support level, while the descending trendline serves as resistance. Traders closely monitor these levels for potential breakouts.
Interpreting the Bearish Descending Triangle Pattern
1. Bearish Bias:
The bearish descending triangle pattern suggests that sellers are in control, and a breakdown below the support level is expected. Traders interpret this pattern as a continuation signal for the ongoing downtrend.
2. Measuring the Price Target:
To estimate the potential price target, measure the height of the triangle from the highest high to the support level. Then, project this distance downward from the point of breakout. However, it’s essential to note that price targets are not always reached, and other technical indicators should be considered for confirmation.
Trading Strategies for the Bearish Descending Triangle Pattern
1. Breakout Strategy:
Traders often wait for a confirmed breakdown below the support level before entering a short position. The breakout should ideally be accompanied by increased volume, indicating strong selling pressure. Stop-loss orders are typically placed above the breakout level to manage risk.
2. Retest Strategy:
Some traders prefer to wait for a retest of the support-turned-resistance level after the breakdown. If the price fails to surpass the former support level, it reinforces the bearish sentiment and offers an opportunity to enter a short position with a tighter stop-loss order.
3. Volume Confirmation:
Volume analysis is crucial when trading the bearish descending triangle pattern. A breakout accompanied by high volume reinforces the validity of the pattern and increases the likelihood of a successful trade.
Limitations and Considerations for the Bearish Triangle Pattern
1. False Breakouts:
False breakouts can occur, where the price briefly breaks below the support level but quickly recovers, trapping traders who entered short positions. To minimize false signals, it is recommended to wait for a confirmed breakdown and consider using additional technical indicators for confirmation.
2. Market Environment:
It is crucial to consider the broader market context when trading the bearish descending triangle pattern. Factors such as overall market trend, news events, and sector-specific dynamics can influence the effectiveness of the pattern.
How to Measure the Trading Parameters For Bearish Triangular Pattern

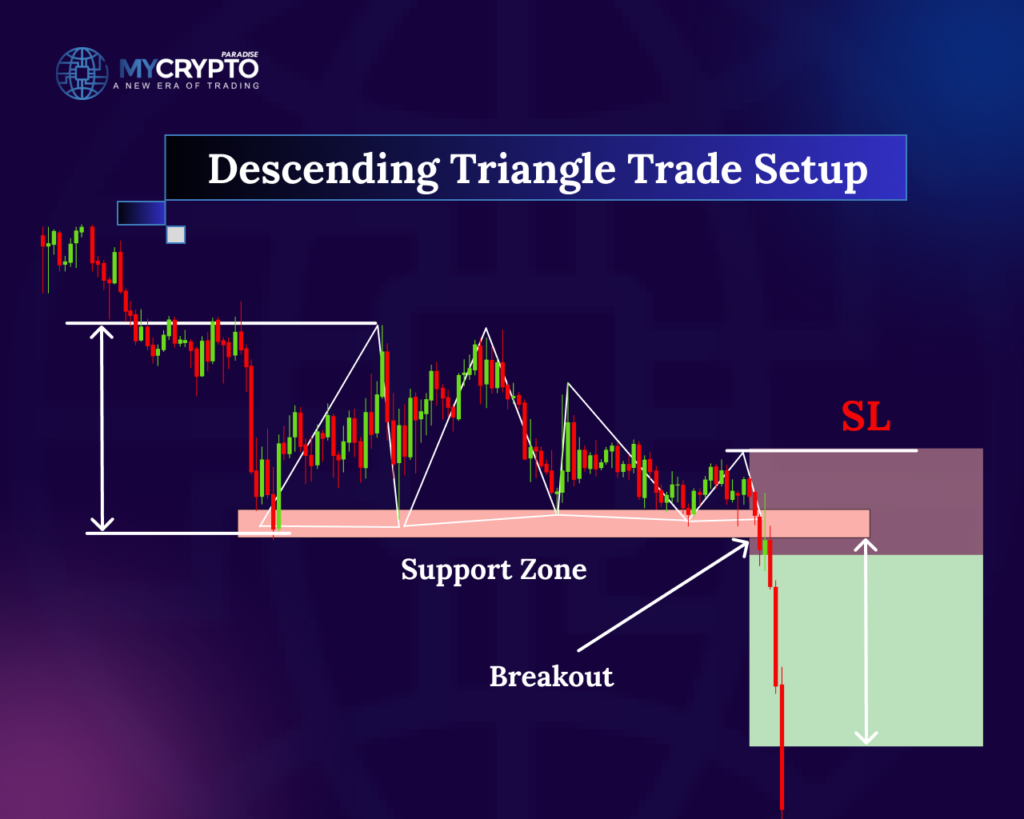
When trading the bearish descending triangle pattern, setting up entry, stop loss, and take profit levels is crucial for managing risk and maximizing potential profits. Here’s a guide on how to set up these parameters:
1. Entry Point:
, Breakout Entry: One common approach is to enter a short position on a confirmed breakdown below the support level of the descending triangle pattern. This breakdown should ideally be accompanied by increased volume, indicating strong selling pressure.
, Retest Entry: Alternatively, some traders prefer to wait for a retest of the support-turned-resistance level after the breakdown. If the price fails to surpass the former support level, it reinforces the bearish sentiment and offers an opportunity to enter a short position.
2. Stop Loss:
, Above Breakout Level: When entering a short position on a breakdown, it is advisable to place a stop loss order above the breakout level. This helps protect against potential false breakouts and minimizes losses if the price reverses.
, Above Retest Level: If you choose to enter after a retest, place your stop loss order above the retest level. This allows for a tighter stop loss and reduces potential risk.
3. Take Profit:
, Measuring the Pattern: One method for determining a potential take profit level is to measure the height of the triangle from the highest high to the support level. Project this distance downward from the point of breakout or retest to estimate a target price. However, it’s important to note that price targets are not always reached, and other technical indicators should be considered for confirmation.
– Support and Resistance Levels: Another approach is to identify key support or previous swing low levels as potential take profit targets. These levels may act as areas of buying interest, potentially causing the price to reverse. Monitoring price action and volume at these levels can provide additional guidance. You can consult with our professional team of crypto traders in ParadiseFamilyVIP🎖️.
What Indicates that a Bearish descending triangle Signal will be Profitable?
While there are no guarantees in trading, certain indicators can increase the probability that a bearish descending triangle signal will be profitable. Here are a few factors to consider:
1. Strong Downtrend:
A bearish descending triangle pattern is considered more reliable when it forms within the context of a strong and established downtrend. The presence of a clear downtrend suggests that sellers have control, increasing the likelihood of a continuation of the downward move.
2. Volume Confirmation:
Volume analysis is essential when trading the bearish descending triangle pattern. A breakout below the support level should ideally be accompanied by increased volume, indicating strong selling pressure and confirming the bearish sentiment. Higher volume during the breakdown enhances the validity of the signal.
3. Price Target Projection:
Measuring the height of the triangle and projecting it downward from the breakout point can provide a potential price target. While this is not a guarantee that the price will reach the target, it can provide a rough estimate of the potential downside move.
However, it’s important to use this projection as a guide and consider other factors such as support levels or additional technical indicators for confirmation.
4. Multiple Timeframe Analysis:
Analyzing the bearish descending triangle pattern across multiple timeframes can provide a broader perspective. If the pattern is present and validated on higher timeframes, such as daily or weekly charts, it may carry more weight and increase the probability of a profitable trade.
5. Confluence with Other Indicators:
It’s beneficial to consider other technical indicators or patterns that align with the bearish descending triangle signal. For example, if the pattern coincides with overbought conditions on oscillators like the Relative Strength Index (RSI) or bearish candlestick patterns, it can provide additional confirmation and increase the likelihood of a profitable trade.
6. Risk Management:
Proper risk management is crucial for trading success. Use appropriate position sizing, set stop loss orders to manage risk, and consider adjusting your stop loss as the trade progresses to protect profits. Additionally, keep an eye on the overall market environment, news events, and sector-specific dynamics, as these factors can impact the effectiveness of the pattern.
Conclusion
The bearish descending triangle pattern is a popular technical pattern used by traders to identify potential shorting opportunities in a downtrending market. Its formation, characterized by a horizontal support level and a descending trendline, indicates a period of consolidation before a potential continuation of the downtrend.
The technical knowledge shared in this article is a great tool, but it’s not enough by itself to guarantee long-term success. You must combine this knowledge with effective trading strategies and proven tactics to transform it into consistent profitability over time.
At ParadiseFamilyVIP🎖️, we integrate expert technical analysis, on-chain insights, real-time sentiment monitoring, and whale psychology with solid trading strategies that consistently deliver profitable crypto signals and long-term portfolio growth.
👉Check the availability of membership in ParadiseFamilyVIP🎖️ (Click it)
Our premium service is designed for traders with enough capital. If you’re still building your funds, we recommend starting with our FREE Telegram channels.
Descending Triangle FAQ
What does a descending triangle pattern indicate?
It is a bearish continuation pattern showing sellers dominate as lower highs press against a flat support level. It usually points to a breakdown below support and a continuation of the existing downtrend.
How do you set a price target for a descending triangle?
Measure the height of the triangle from its highest high to the support level, then project that distance downward from the breakout point. Targets are estimates only, so confirm with support levels or other indicators.
Why does volume matter in this pattern?
Volume often shrinks as the triangle forms, reflecting fading momentum. A breakdown on rising volume confirms strong selling pressure and improves the reliability of the signal, while a low-volume break is more prone to failure.
How can traders avoid false breakouts?
Wait for a confirmed close below support rather than an intraday wick, and consider a retest of support-turned-resistance before entering. Adding tools like RSI or candlestick confirmation helps filter out traps.
Crypto trading involves substantial risk of loss. This article is educational and is not financial advice. Past performance does not guarantee future results. Always do your own research.
What is different here
Most guides stop at the theory. The MyCryptoParadise team shares the live trades, and the reasoning behind each one, inside ParadiseFamilyVIP. Everything here is education, not financial advice.
Crypto trading involves substantial risk and is not suitable for everyone. Nothing here is financial advice; it is education only. Never risk more than you can afford to lose.


Join the discussion
No comments yet. Pro Paradiser members, share how you are reading this.