



Chart Patterns Explained
In short
A falling wedge is a bullish chart pattern where price moves lower between two converging, downward-sloping trendlines, with the upper line declining faster. It indicates weakening selling pressure and often precedes an upward breakout. Traders typically confirm the pattern with a decisive close above resistance on rising volume.
- The Falling Wedge Pattern is a bullish chart formation that signals a potential trend reversal or continuation within an uptrend in crypto markets.
- Crypto Traders should always wait for a confirmed breakout and combine it with volume, support/resistance, and disciplined risk management to improve success rates.
- While the Falling Wedge Pattern provides valuable insights, its reliability depends on broader factors, including technical indicators, overall market conditions, and external news events.
The Falling Wedge Pattern in crypto trading is one of the market’s most reliable and powerful bullish signals. Recognizing this formation early allows crypto traders to spot momentum shifts before the crowd, positioning themselves to ride breakouts with confidence.
At MCP University FREE, this guide is part of our advanced learning series created for precision-driven crypto traders. By the end, you’ll know exactly how to identify, confirm, and trade Falling Wedges with professional accuracy and strategic discipline.
Introducing the Falling Wedge Pattern
A Falling Wedge Pattern develops when price moves lower within two downward-sloping, converging trendlines, signaling a gradual loss of selling pressure. The tightening structure reflects weakening bearish momentum as buyers begin to accumulate and absorb available supply.
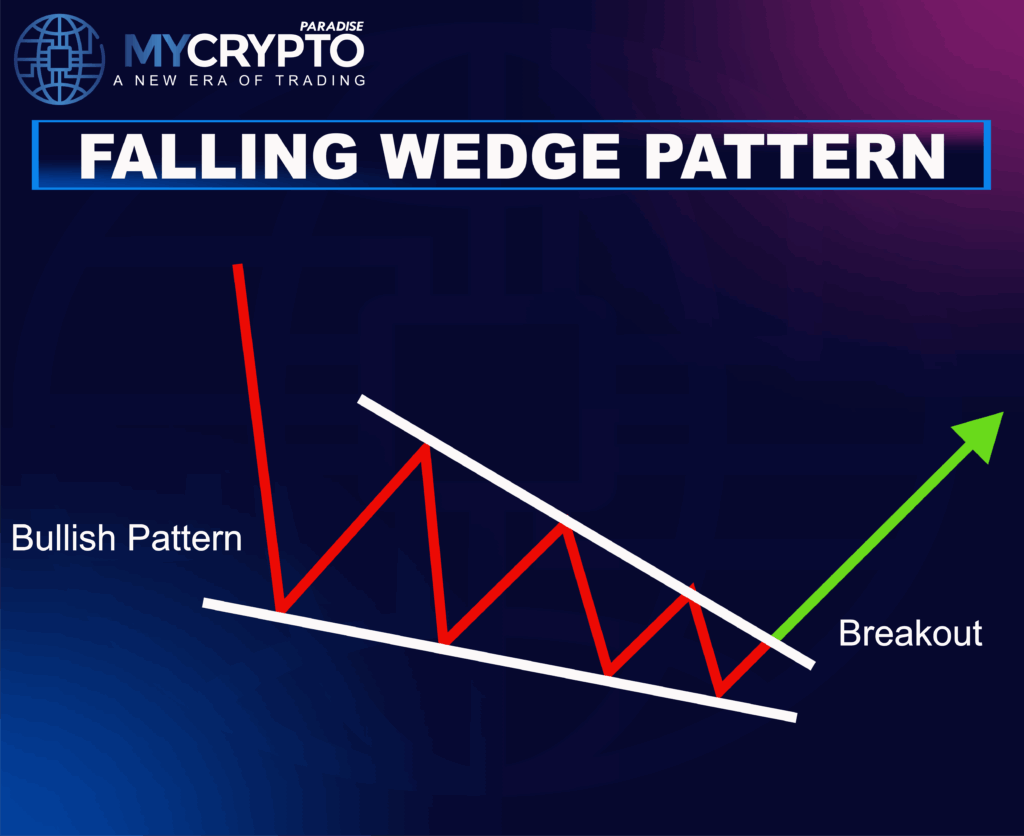
Although price keeps printing lower highs and lower lows, the upper boundary falls much faster than the lower one, clearly signaling seller exhaustion. When the price finally breaks above resistance on strong volume, control quickly shifts in favor of buyers.
This pattern often appears near the end of a prolonged downtrend or during a temporary pullback within a larger bullish cycle. It reflects a phase of gradual accumulation, where selling pressure weakens and buyers quietly regain control.
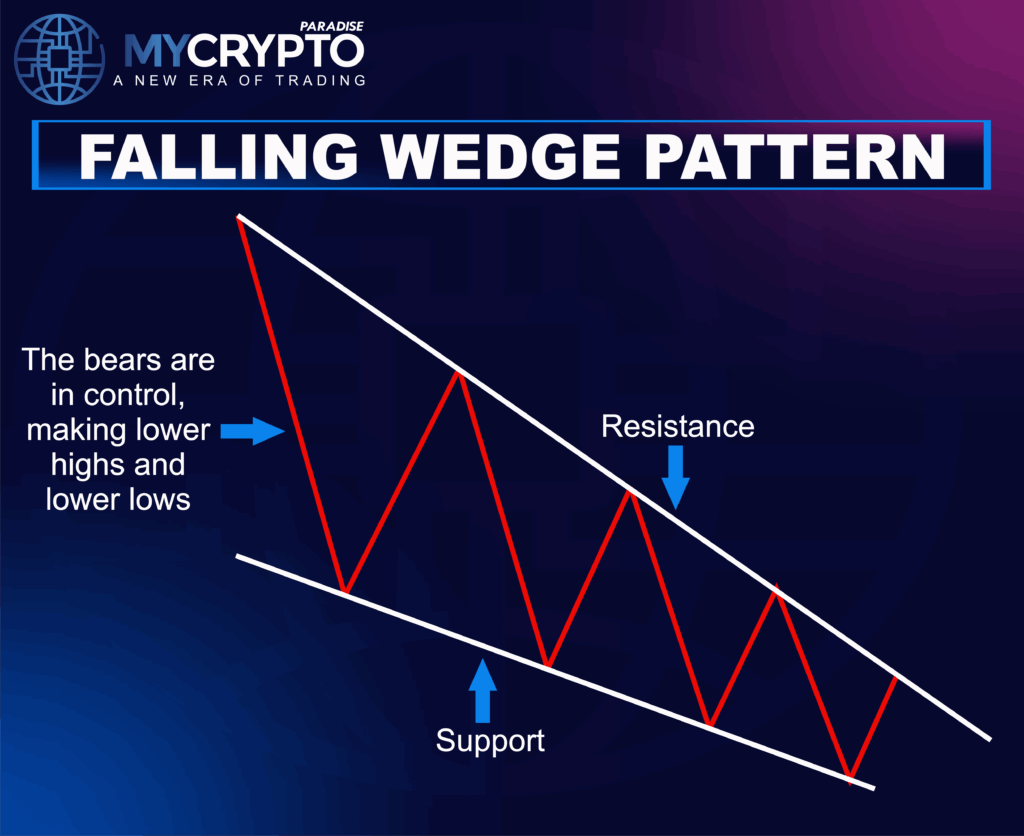
As momentum shifts, the Falling Wedge becomes an early signal of reversal, alerting crypto traders to upcoming breakouts and renewed market strength before wider confirmation sets in.
How to Recognize a Falling Wedge Pattern?
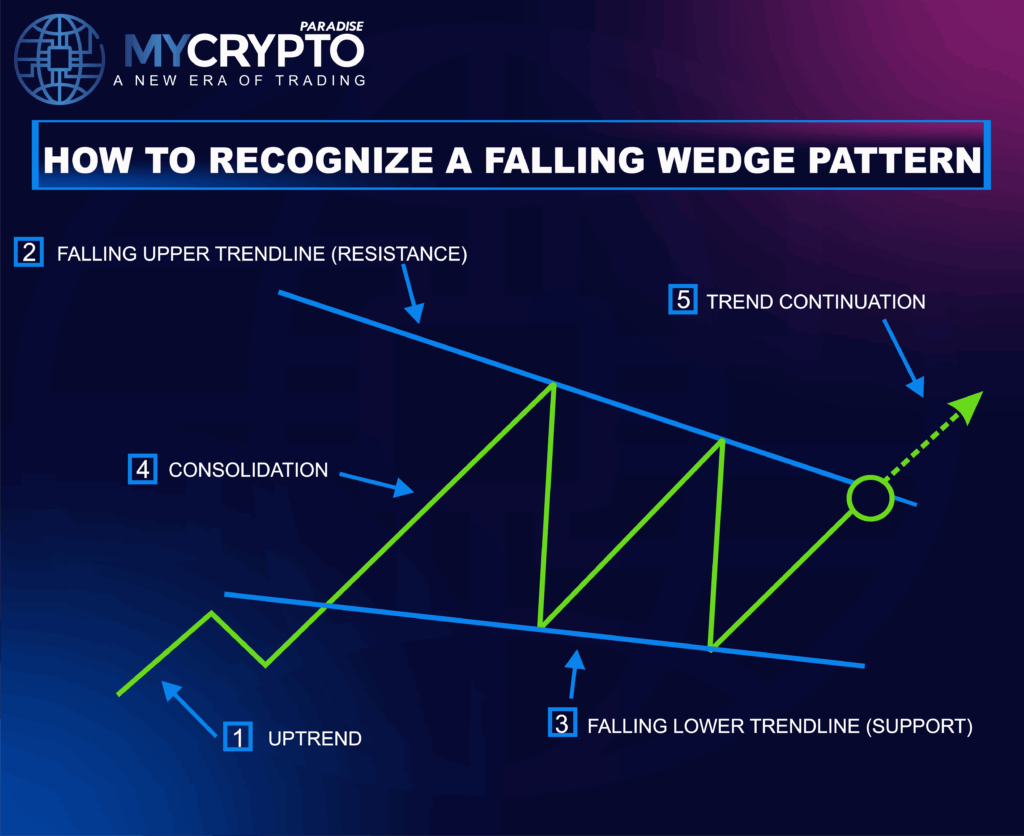
Identifying a Falling Wedge Pattern early gives traders a strong advantage. It helps them prepare for a potential bullish reversal before the wider market reacts. The pattern unfolds through a series of technical and psychological stages that reveal the gradual shift from weakness to strength.
1. Downtrend Foundation
Every falling wedge begins with a clear and sustained downtrend marked by consistent lower highs and lower lows. At this point, bearish sentiment dominates the market, and sellers appear firmly in control.
2. Converging Trendlines
As the decline progresses, price movement begins to tighten. The highs and lows form two downward-sloping trendlines that gradually move closer together. The upper trendline falls more sharply than the lower one, signaling that selling pressure is easing even as prices continue to drift lower.
3. Declining Volume
Volume typically decreases as the wedge matures. This reduction in participation shows that sellers are losing momentum and that the market is entering a period of consolidation before a potential reversal.
4. Bullish Breakout
Eventually, price breaks above the upper resistance line, often accompanied by a noticeable increase in volume. This breakout confirms the falling wedge pattern and indicates that buying strength is returning to the market.
5. Retest Confirmation
After the breakout, the price frequently retests the previous resistance level, which now acts as support. This retest offers traders a second entry opportunity with improved confirmation and controlled risk before the next upward move begins.
Is the Falling Wedge Bullish or Bearish?
The Falling Wedge Pattern is typically a bullish signal, though its meaning can vary depending on where it appears within the broader market cycle. Understanding this context helps crypto traders interpret it more precisely and align their strategies with market sentiment.
Bullish Reversal Wedge
This is the most common type of falling wedge. It forms after a prolonged downtrend, where sellers begin to lose control and momentum fades. As prices tighten between the converging trendlines, bearish pressure weakens. Once the price breaks above the upper resistance line with strong volume, it confirms a shift in sentiment, marking the transition from seller dominance to a bullish reversal.
Bullish Continuation Wedge
In other cases, the falling wedge appears during an existing uptrend. It acts as a temporary pause or healthy correction as buyers take profit and the price consolidates. When the breakout occurs to the upside, it signals that the pullback phase is over and bullish momentum is resuming.
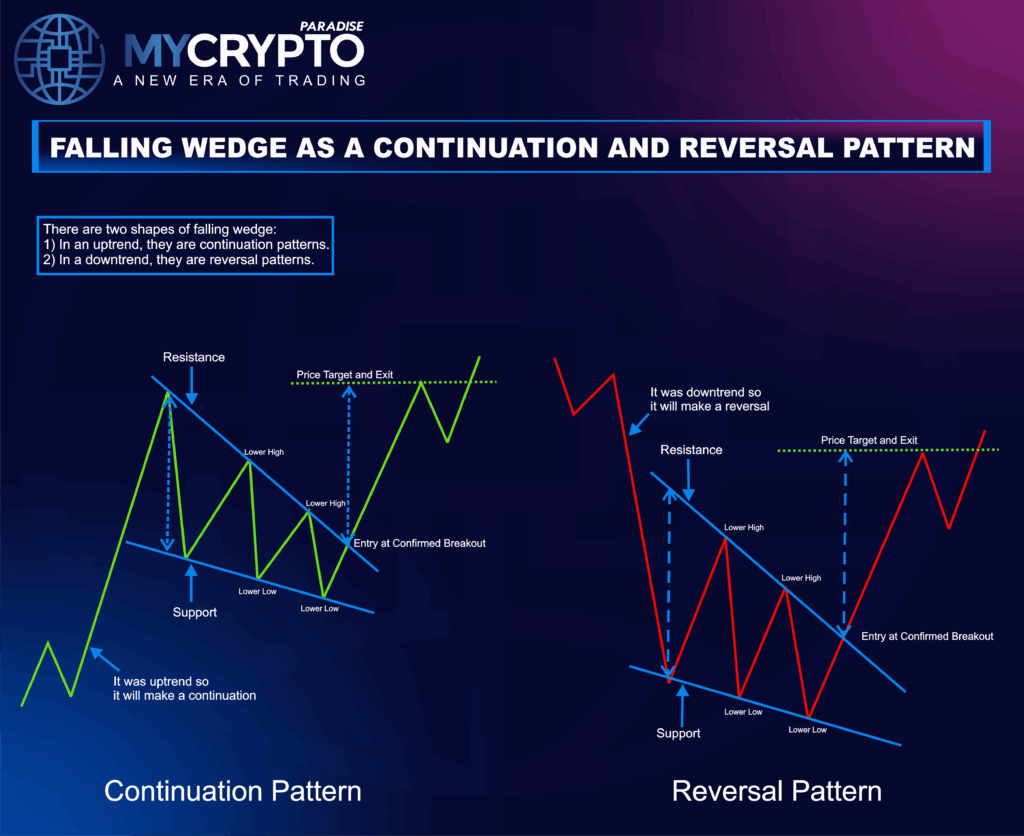
No matter where it forms, the message remains the same: bearish pressure is fading, and buyer strength is returning. The Falling Wedge reflects the gradual transfer of control from sellers to buyers, a classic setup for the next impulsive move higher.
How Reliable Is the Falling Wedge Pattern?
Among all bullish reversal formations, the Falling Wedge Pattern is known for its strong reliability, especially when supported by volume confirmation and momentum divergence.
Statistical Performance
Backtesting and market studies show that falling wedges break upward nearly 65-75% of the time, with success rates improving further when accompanied by clear technical signals. This consistency makes it one of the most trusted reversal indicators in crypto trading.
Key Conditions That Boost Reliability
- The pattern often appears after a prolonged bearish phase, where the price enters oversold territory.
- Volume declines steadily throughout the pattern but spikes sharply at the moment of breakout.
- RSI or MACD bullish divergence frequently appears price forms lower lows while the momentum trends higher.
- Breakouts before the apex tend to produce stronger follow-through than late or compressed ones.
When these factors align, the Falling Wedge stands out as a high-probability signal of trend reversal. However, in thin or sideways markets, false breakouts can occur, so confirmation should always be treated as a requirement, not an assumption.
How to Trade the Falling Wedge Pattern?
Trading the Falling Wedge successfully requires patience, confirmation, and proper risk control. Here’s how experienced traders approach it step by step.
Entry Strategy
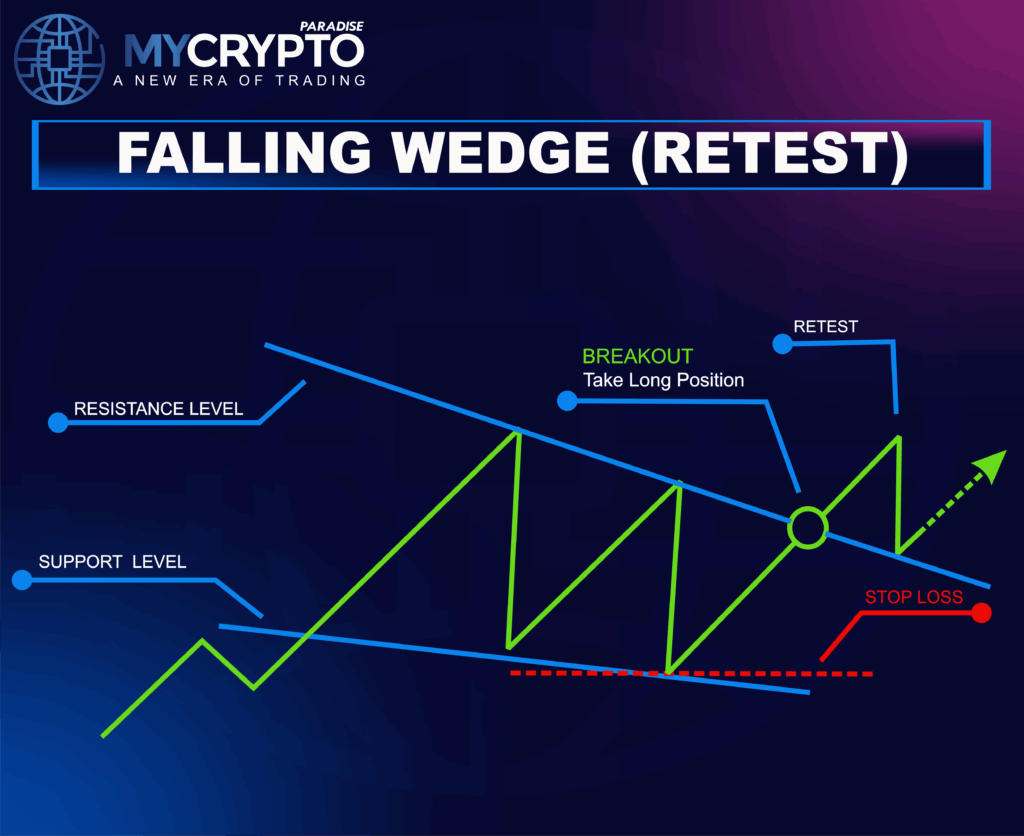
Breakout Entry: Enter a long position once the price closes decisively above the upper trendline with a clear surge in volume. This confirms that buying pressure has taken control and the reversal is underway.
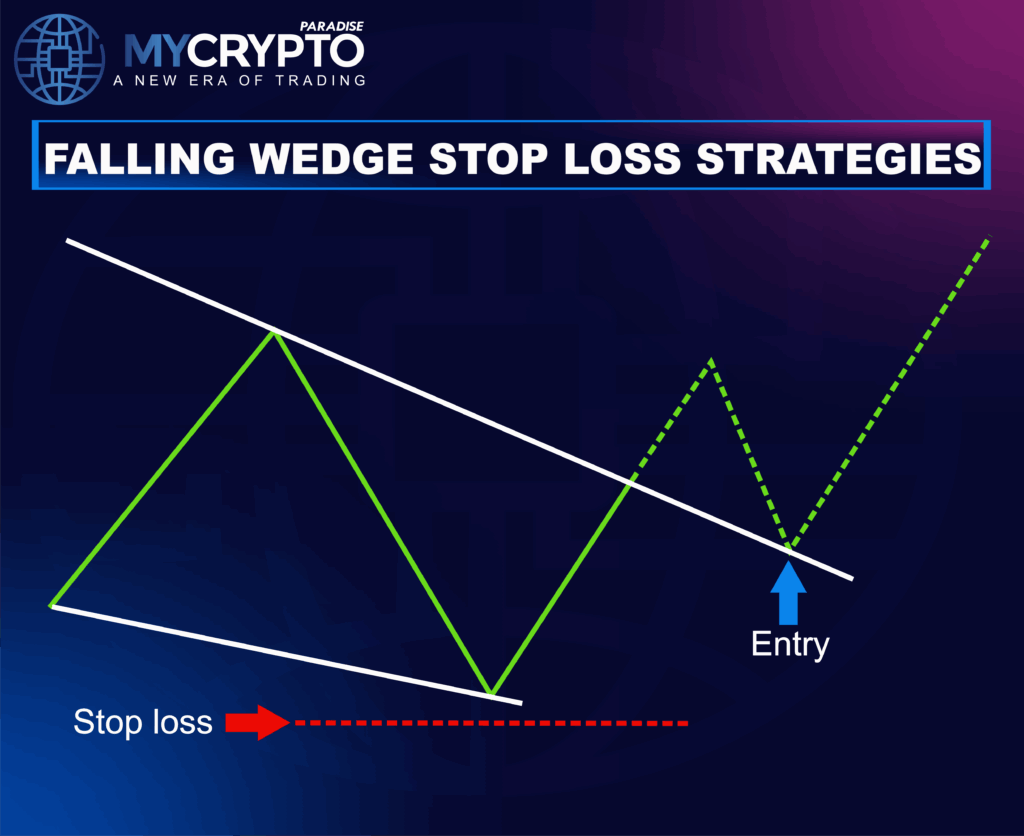
Pullback Entry: Conservative traders often wait for a retest of the breakout level. After the breakout, the price may briefly pull back to this new support area, offering a safer entry point with a stronger risk-to-reward setup.
Stop-Loss Placement
- For long trades, place your stop-loss just below the last swing low inside the wedge.
- For existing positions, this stop also acts as protection in case the breakout fails and the price reverses sharply.
Take-Profit Targets
There are two popular methods for setting profit targets. Measure the height of the wedge by calculating the distance between the highest and lowest points, then project that distance upward from the breakout area. The second method is to use key resistance zones, aim for previous resistance levels, or important Fibonacci extension zones to secure partial or full profits.
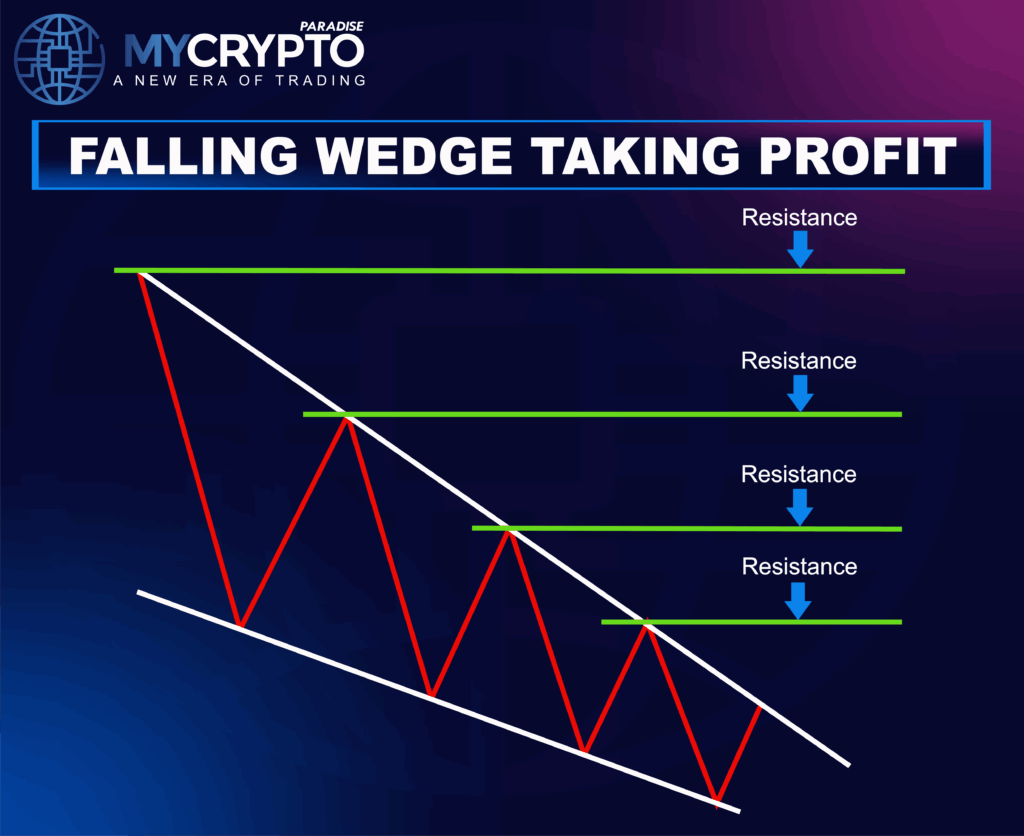
By combining confirmed entries with structured exits, traders can approach Falling Wedge setups with greater confidence, clear planning, and disciplined risk management, the foundation of long-term trading success.
A Pattern Within a Pattern
Here’s a little secret most crypto traders miss. The Falling Wedge often leads to the development of another powerful reversal formation within its structure. You can even notice this pattern connection in many real chart examples once you start paying attention.
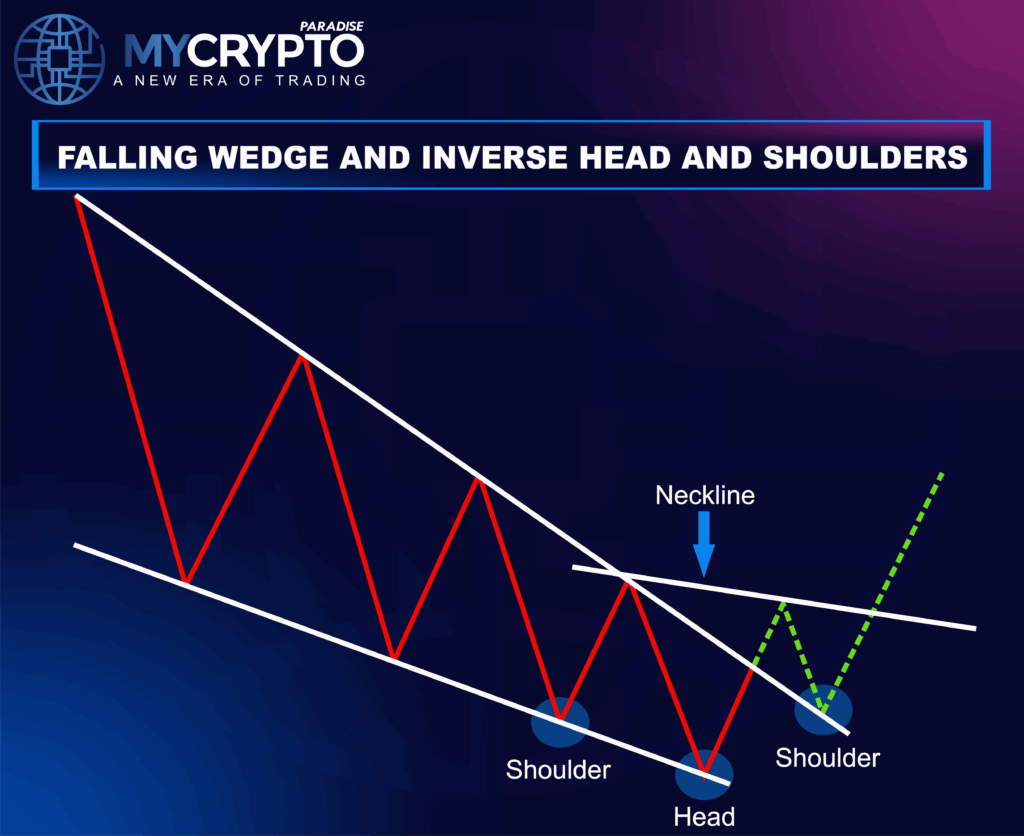
It’s the Inverse Head and Shoulders pattern. This setup commonly appears as the Falling Wedge completes, confirming that bearish pressure is fading and a bullish reversal may be on the horizon.
In many cases, a breakout through wedge resistance helps form the right shoulder, strengthening the overall reversal signal. This combination gives traders multiple ways to plan entries and stop-loss levels, depending on how the price reacts around the neckline area.
Falling Wedge vs Similar Patterns
Crypto traders often confuse the Falling Wedge with other chart formations that share a similar appearance. While they may look alike at first glance, each carries a unique message about market sentiment and momentum. Understanding these distinctions helps traders avoid misinterpretation and improve decision-making accuracy.
Falling Wedge vs Rising Wedge
A Falling Wedge slopes downward, reflecting weakening bearish momentum and signaling that a bullish reversal may follow once the price breaks above resistance. In contrast, a Rising Wedge slopes upward and warns that bullish strength is fading, often leading to a bearish reversal after a breakdown. Both share converging lines, but their direction and breakout implications move in opposite ways.
Falling Wedge vs Descending Triangle
At first, a Falling Wedge can resemble a Descending Triangle, but their internal dynamics differ sharply. A Descending Triangle has a flat support line and falling resistance, representing persistent selling pressure. The Falling Wedge, however, shows dual convergence, highlighting exhaustion rather than continuation, a sign that sellers are losing control.
Falling Wedge vs Channel
A Price Channel moves between two parallel trendlines, suggesting steady, controlled price movement within a trend. The Falling Wedge, by contrast, forms with converging lines and shrinking volatility, revealing that momentum is compressing before a potential breakout.
Falling Wedge vs Flag
Both the Flag and Falling Wedge appear after strong price moves, yet their meanings diverge. A Flag acts as a continuation pattern, showing brief consolidation before the trend resumes. The Falling Wedge, however, points to reversal potential, where compression and declining volume hint that the current move is running out of strength.
By distinguishing the Falling Wedge from rising wedges, triangles, channels, and flags, crypto traders can sharpen their pattern recognition, enhance timing precision, and make more confident trading decisions in volatile markets.
Common Mistakes to Avoid
Even experienced crypto traders can misread or mistime the Falling Wedge. To trade it effectively, avoid these common mistakes:
- Entering Before Confirmation: Entering too early without a confirmed breakout often leads to false starts. Always wait for a solid candle close above the resistance line before taking a position.
- Ignoring Volume and Divergence: A valid Falling Wedge should show declining volume during formation and bullish RSI or MACD divergence near the lows. Ignoring these signs can reduce breakout accuracy.
- Confusing Wedges with Channels or Triangles: Wedges have converging trendlines, while channels run parallel, and triangles usually span longer timeframes. Misreading them can flip your trading bias entirely.
- Trading in Sideways Markets: The Falling Wedge works best after a clear downtrend. In sideways or low-volatility markets, breakouts often lack strength and reliability.
- Neglecting Risk Management: Always use a stop-loss and avoid overleveraging. Even the most reliable wedge setup can fail suddenly, and poor risk control can quickly turn a small error into a large loss.
.
Conclusion
The Falling Wedge Pattern is one of the most powerful bullish setups in crypto trading, signaling that selling pressure is fading and a potential reversal is on the horizon. When supported by rising volume, bullish divergence, and clean breakout confirmation, it offers traders some of the most reliable long-entry opportunities across volatile markets.
For professionals, consistency comes from more than just spotting the pattern; it’s about mastering entry timing, stop placement, and risk-to-reward precision. No setup guarantees profit, but with proper structure and discipline, the Falling Wedge can provide a lasting edge in your trading strategy.
At ParadiseFamilyVIP🎖️, we help traders refine these skills in real-time, combining technical mastery, market psychology, and institutional-grade risk control for sustained performance.
👉 Join ParadiseFamilyVIP🎖️ today and start trading like a pro. Membership slots are limited. Secure your spot or join the waiting list to stay ahead of the next breakout move.
Falling Wedge FAQ
Is a falling wedge bullish or bearish?
A falling wedge is typically a bullish pattern. It can act as a reversal after a downtrend or a continuation during an uptrend, but in both cases it signals that selling pressure is fading and buyers are regaining control.
How reliable is the falling wedge pattern?
Backtesting and market studies suggest falling wedges break upward roughly 65 to 75 percent of the time, with reliability improving when paired with volume confirmation and RSI or MACD bullish divergence. In thin or sideways markets, false breakouts can still occur, so confirmation should always be required.
How do you confirm a falling wedge breakout?
Wait for price to close decisively above the upper trendline on a clear surge in volume. A retest of the broken resistance, which then acts as support, offers a second, lower-risk entry with stronger confirmation.
How do you set a profit target on a falling wedge?
Measure the height of the wedge between its highest and lowest points, then project that distance upward from the breakout point. Alternatively, target prior resistance zones or Fibonacci extension levels to secure partial or full profits.
Crypto trading involves substantial risk of loss. This article is educational and is not financial advice. Past performance does not guarantee future results. Always do your own research.
What is different here
Most guides stop at the theory. The MyCryptoParadise team shares the live trades, and the reasoning behind each one, inside ParadiseFamilyVIP. Everything here is education, not financial advice.
Crypto trading involves substantial risk and is not suitable for everyone. Nothing here is financial advice; it is education only. Never risk more than you can afford to lose.












Join the discussion
No comments yet. Members, share how you are reading this.