

Listen: the breakdown
Market briefing: US one-year inflation expectations rose to 3.9% for September, the highest reading since 2023 and above the 3.6% expected. BTC traded near $83,245, down 2.7% on the day, with ETH down 4.7%.
- NY Fed September one-year inflation expectations rose to 3.9%, above the 3.6% expected and prior.
- That is the highest one-year reading since May 2023; three-year expectations ticked up to 3.3%.
- BTC traded near $83,245 (-2.7%) and ETH near $2,571 (-4.7%) on the day of the release.
US inflation expectations just hit their highest level since 2023, undercutting the rate-cut story right as BTC slips toward the low-$83k area. Is the easing trade in trouble?
A single data point just made the Federal Reserve's job harder. The NY Fed's September survey showed median one-year inflation expectations rising to 3.9%. That beat the 3.6% both expected and recorded the month before.
The number matters because of where it sits. A 3.9% reading is the highest for one-year expectations since May 2023. Three-year expectations also edged up, to 3.3%, a smaller 0.1 point move but in the same unwelcome direction.
Inflation expectations are not inflation itself. They are what households think is coming. But central banks watch them closely, because expectations can become self-fulfilling when people demand higher wages and tolerate higher prices.
This is the kind of print that quietly removes options. It does not force the Fed to do anything today. It does make the case for near-term rate cuts harder to argue with a straight face.
Crypto felt the chill on the same day. BTC was trading near $83,245, down 2.7% over 24 hours, while ETH underperformed at roughly $2,571, down 4.7%. We cannot pin that move on this one release with certainty. No confirmed line runs from the survey to the selloff. The timing, though, fits a market that had little of its own to lean on and met a headline it did not want.
How inflation expectations squeeze the easing trade
The transmission runs through one word: cuts. Markets had been pricing a friendlier Fed and easier liquidity ahead. A hotter inflation expectations print pushes against that, because policymakers rarely ease into rising price expectations.
When the easing case weakens, rate expectations firm up. Firmer rates tend to support the dollar and lift the real cost of holding assets that pay no yield. Crypto sits squarely in that bucket.
This is liquidity in slow motion. No single event drains the system overnight. Instead, the probability of cheaper money next quarter fades, and risk assets reprice for a world where cash stays expensive a little longer.
BTC and ETH are among the most liquidity-sensitive assets anywhere. They rally hardest when money is loose and struggle first when the tide pulls back. That sensitivity cuts both ways, which is exactly why a macro print with no crypto content still lands on crypto.
We should be honest about the limits here. The gathered evidence does not include a direct move in rate futures or the dollar index on the day. So the macro chain we describe is a logical read of the print, not a confirmed market reaction.
What is confirmed is the direction of the surprise. Expectations came in above forecast, at a multi-year high, with the three-year figure nudging up too. For a market hoping the inflation story was behind it, that is the uncomfortable part.
Why ETH is bleeding faster than Bitcoin
The liquidity cascade tends to follow a familiar order. BTC moves first as the macro proxy, then ETH, then the long tail of alts amplifies whatever BTC does.
On this day the order held. BTC was down 2.7% while ETH fell 4.7%, underperforming by a clear margin. That gap is the signal worth sitting with.
ETH leading to the downside is classic risk-off behaviour. When traders turn cautious, they trim the higher-beta position first and keep the reserve asset longer. ETH is the higher-beta leg of the majors, so it moves more in both directions.
Alts usually exaggerate this further. A 4.7% drop in ETH often translates into deeper percentage losses across smaller tokens, as thin liquidity magnifies every sell order. Retail tends to feel that tail most, because that is where retail is most concentrated.
The mechanism is about who gets squeezed and where their stops sit. Late longs piled in near local highs now sit underwater, and their liquidation levels cluster just below recent support. A liquidity-tightening headline is exactly the kind of nudge that reaches for those stops.
None of this proves the inflation print caused the fall. No source ties the two together directly. But the pattern, BTC down, ETH down harder, alts exposed, is consistent with a market pricing firmer-for-longer rates rather than one quietly accumulating.
What confirms firmer rates versus a shakeout
The first thing to watch is follow-through, not the headline itself. One hot survey is data. A second confirming print, or a visible move in rates and the dollar, would turn a logical read into a trend.
Invalidation would look like crypto shrugging the number off within a day or two and reclaiming lost ground on rising volume. That would suggest the print was absorbed and the market cared more about something else.
Confirmation is the opposite. If BTC keeps leaking lower and ETH keeps leading the decline, the firmer-for-longer interpretation gains weight. Watch whether support around the low-$83k area holds or gives way on expanding volume.
Volume is the tell we trust most here. A breakdown on heavy, sustained selling is real distribution. A breakdown on thin volume that snaps back is often a stop-hunt dressed up as a trend.
Pay attention to how any bounce is built. A clean, impulsive recovery reads differently than a weak, choppy drift higher that stalls at the first resistance. The structure of the move tells you who is in control.
Finally, keep one eye on the next scheduled inflation and policy signals. This survey raised the bar for the doves. If upcoming data cools, the easing trade can come back quickly. If it does not, this print will look like an early warning that the market read correctly.
Reading the print against support and whale selling
The ParadiseTeam frames this through the current structure, not the headline alone. BTC was trading near $83,245 as of the release, hovering just above the support zone around $82,000 where moving-average, Fibonacci, and historical confluence overlap. That makes this print a stress test of support rather than a verdict. A liquidity-tightening headline landing right on a key level is exactly where conviction gets tested, because that is where retail stops sit and where whales decide whether to absorb or press.
Our standing read is nuanced. Selling pressure at this support has been getting absorbed, and with most of the crowd already fearful, the conditions for a short-term bounce exist. A hot macro print does not erase that; it just raises the odds the bounce is sold.
The heavier context is whale behaviour. Whales have been net sellers, roughly 65% selling against 35% buying, which keeps downside pressure live. A macro headline that firms up rates gives sellers another reason, not a reason to flip. So the ParadiseTeam treats strength here with suspicion. Any bounce toward the $88,000 to $90,000 resistance is where distribution has historically appeared, and this print strengthens the case that rallies into that zone meet supply.
The cleaner concern is a loss of $82,000 on real volume. That opens the macro flush path the team has flagged toward the $55,000 to $44,000 exchange-of-hands region. Probabilities, not certainties, but the risk skews that way while rates stay sticky.
The read behind this: we framed this story through our own market analysis, Can Bitcoin Bounce From Support?
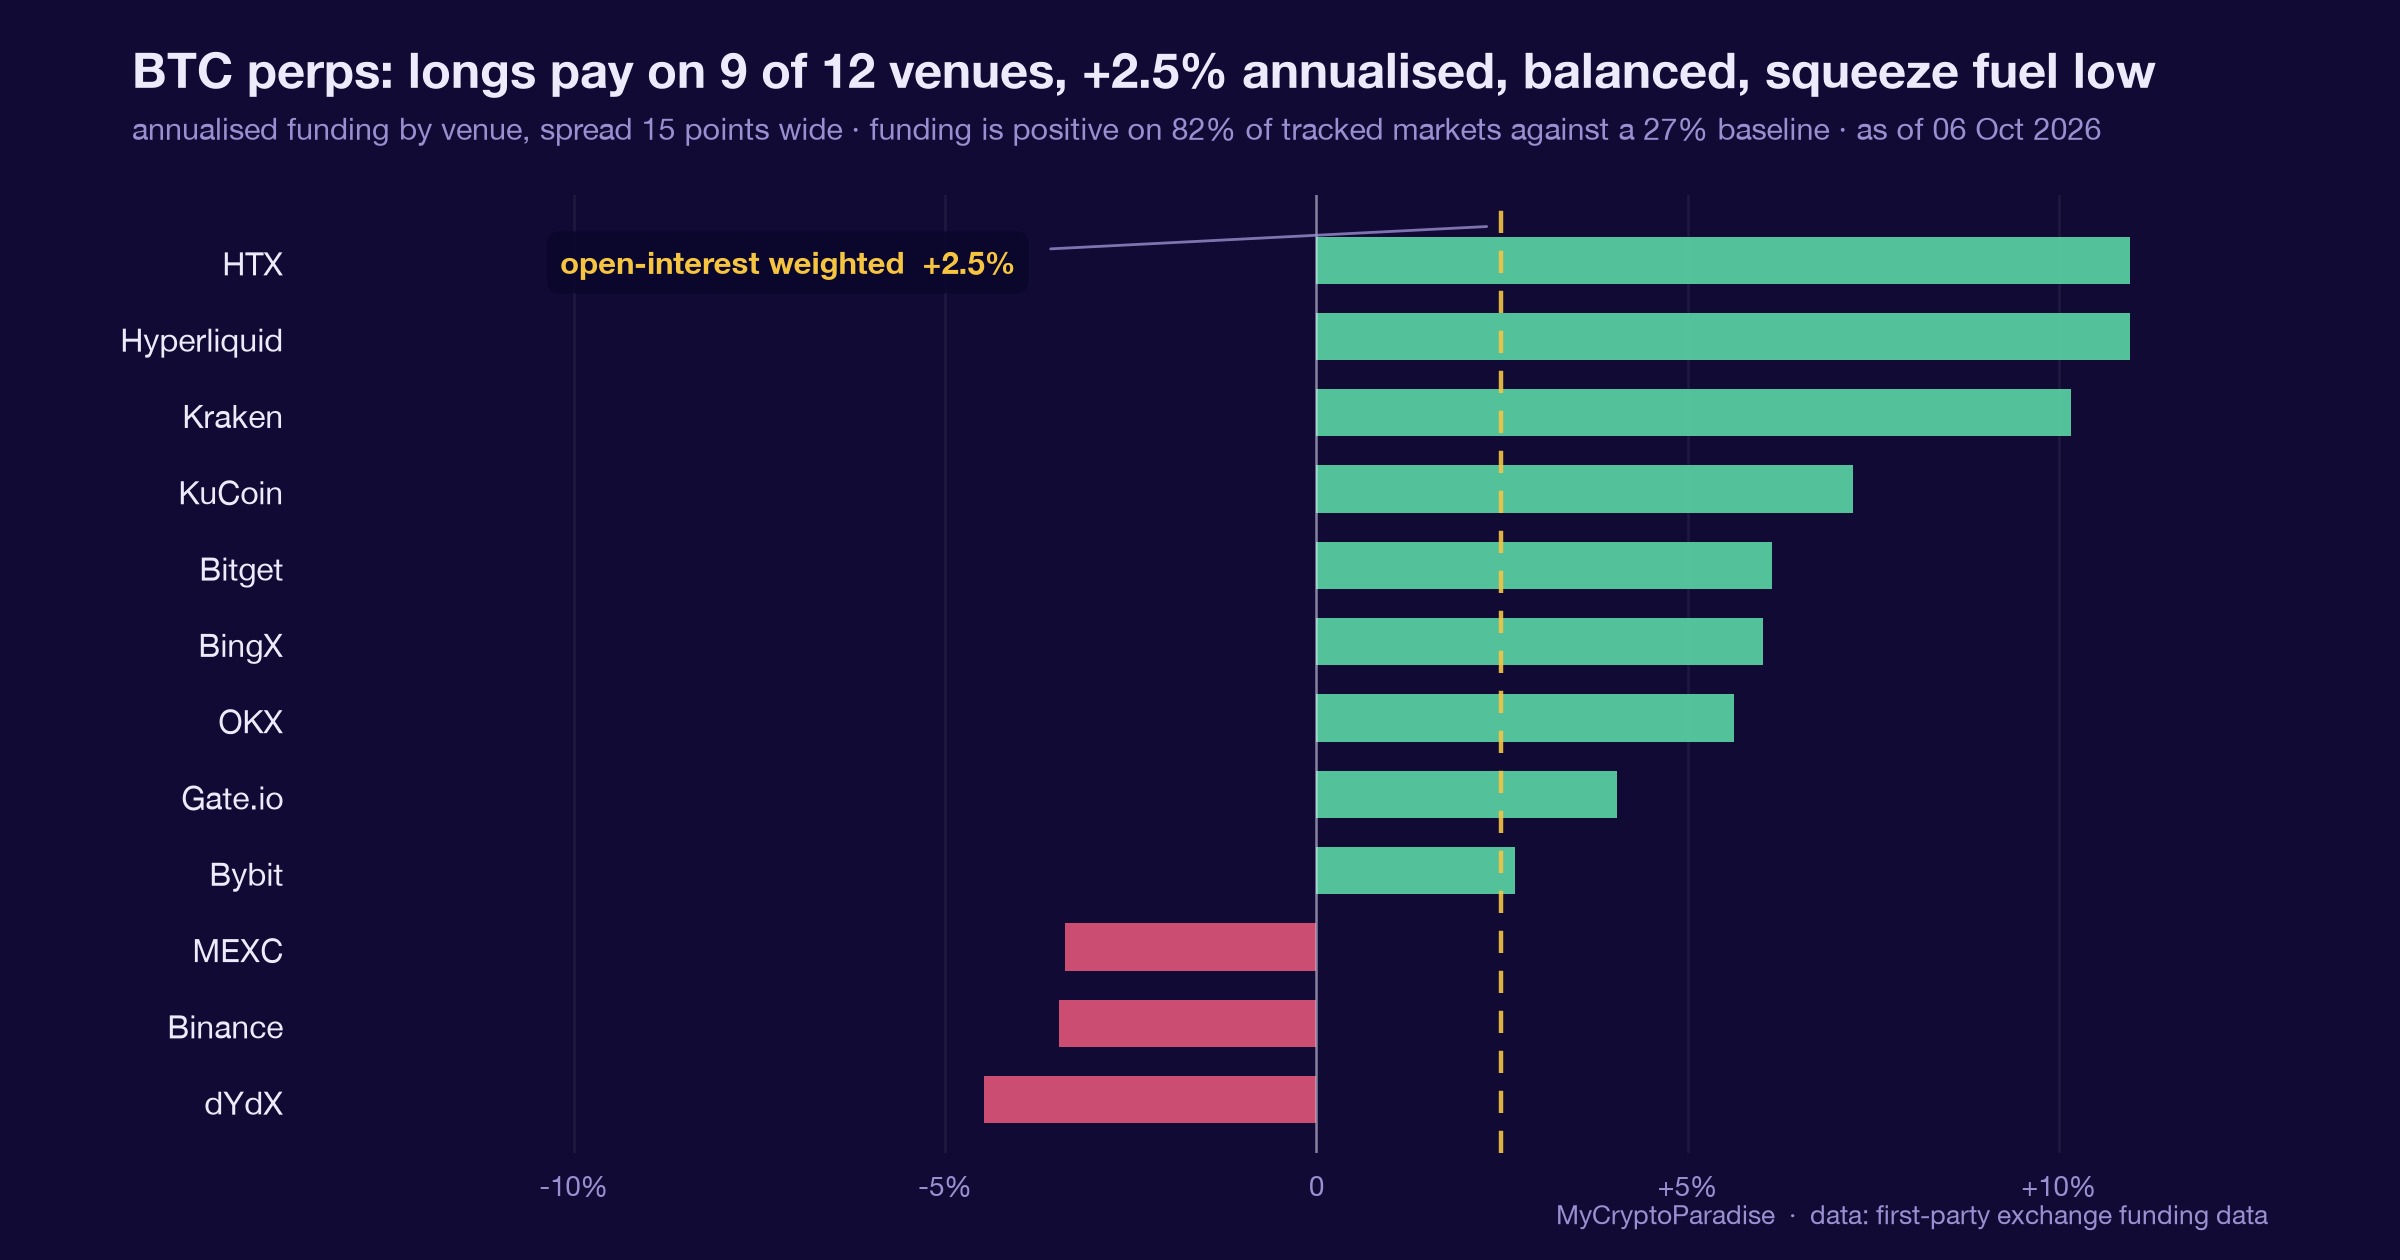
Track it live: our live crypto funding rates and the crypto liquidation heatmap both update in real time, so you can watch this shift for yourself.
Related coverage
For exact entries, targets, and stop losses with full risk management, that is what ParadiseFamilyVIP is for. New to reading these moves? Start with our crypto trading strategies guide.
ParadiseTeam is monitoring the market situation closely, and we are taking these developments into consideration while building our trading tactics inside ParadiseFamilyVIP.
Crypto trading involves substantial risk. Prices are volatile and you can lose money. This article is educational and is not financial advice. Past performance does not guarantee future results.











Join the discussion
No comments yet. Members, share how you are reading this.