


Candlestick Trading
In short
Candlesticks provide visual representations of price movements, including open, high, low, and close prices within a specific timeframe. While they are a fundamental tool for technical analysis, relying solely on candlesticks for successful trading is generally not recommended. Comprehensive analysis often involves combining candlesticks with other indicators and market context.
Candlesticks have been used for centuries by traders to analyze market movements and make trading decisions. In recent years, candlestick charts have become a popular tool for technical analysis, with many traders relying solely on candlesticks to make successful trades. However, the question remains: Can you rely solely on candlesticks for successful trading? Let’s find out.
What Are Candlesticks?
First, let’s take a closer look at what candlesticks are and how they work. Candlestick charts are a type of financial chart used to represent the price movements of an asset, such as a stock or a currency pair. Each candlestick represents a specific time frame, such as one day or one hour, and contains information about the open, high, low, and close prices for that time frame. The color of the candlestick also provides important information, with green or white candles indicating a bullish trend and red or black candles indicating a bearish trend.
Parts of a Candlestick

The body of the candlestick represents the opening and closing prices, while the upper and lower shadows, or wicks, represent the highest and lowest prices reached during that time frame.
The Body: which represents the opening and closing prices during the time period. The color of the body can be either green or white, indicating a bullish market, or red or black, indicating a bearish market. The longer the body, the more significant the price movement during that period.
The Wick: which is composed of two lines that extend from the top and bottom of the body. The top wick, or shadow, represents the highest price reached during the period, while the bottom wick represents the lowest price. These lines can also be referred to as the upper and lower shadows.
Important Candlestick Patterns
Candlestick charts allow traders to quickly and easily analyze market movements and identify trends and patterns. For example, a long green candlestick with no upper shadow indicates a strong bullish trend, while a long red candlestick with no lower shadow indicates a strong bearish trend. Candlestick patterns, such as the bullish engulfing pattern or the bearish harami pattern, can also provide valuable insights into market trends and potential reversals.
Doji: A doji candlestick pattern occurs when the opening and closing prices are the same or very close. This indicates a period of indecision in the market and can often precede a trend reversal.

Hammer: A hammer candlestick pattern is characterized by a small body with a long lower shadow. This pattern usually occurs at the bottom of a downtrend and can signal a potential trend reversal.

Shooting star: A shooting star candlestick pattern has a small body with a long upper shadow. This pattern usually occurs at the top of an uptrend and can indicate a potential trend reversal.

Engulfing: An engulfing candlestick pattern occurs when a larger candle fully engulfs the previous smaller candle. This pattern can signal a trend reversal or continuation.

Harami: A harami candlestick pattern occurs when a smaller candle is completely contained within the previous larger candle. This pattern can also signal a potential trend reversal.

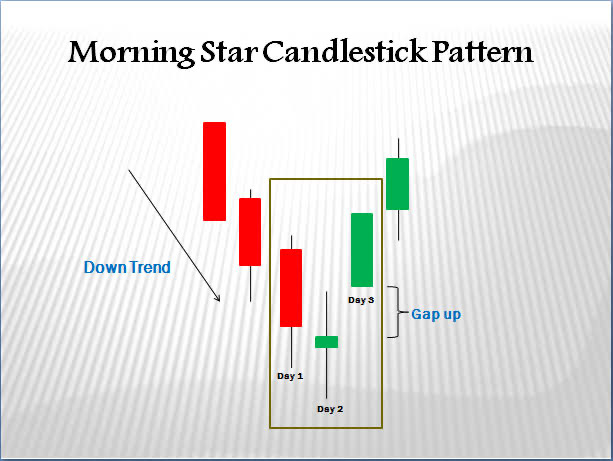
Morning star: A morning star candlestick pattern is a bullish reversal pattern that occurs at the bottom of a downtrend. It is characterized by a long bearish candle, a small candle or doji, and a long bullish candle.
Evening star: An evening star candlestick pattern is a bearish reversal pattern that occurs at the top of an uptrend. It is characterized by a long bullish candle, a small candle or doji, and a long bearish candle.

So, can you rely solely on candlesticks for successful trading?
The short answer is no. While candlestick charts can provide valuable insights into market trends and patterns, they should be used in conjunction with other tools and techniques for successful trading.
One important factor to consider when using candlesticks is the context in which they appear. For example, a long green candlestick may indicate a bullish trend, but if it appears after a long period of bearish movement, it may simply be a temporary reversal before the bearish trend continues. Similarly, a bearish harami pattern may indicate a potential trend reversal, but other indicators such as moving averages or support and resistance levels appropriately predict the best course of action.
Examples of Candlesticks Trades from Price History
Let’s take a look at some examples of how traders use the candlestick patterns in cryptocurrency trading. Most times, they do so along with other technical analysis tools, to help identify potential trading opportunities.
Case 1:

In the chart below, we can see the daily candlestick chart for Bitcoin from October 2020 to March 2022. The chart shows a number of candlestick patterns, as well as support and resistance levels. Here, ordinary candlesticks price action is insufficient as we can see the technical aspect involving two other moving averages for confirmation of trade entry and exit.
Case 2:
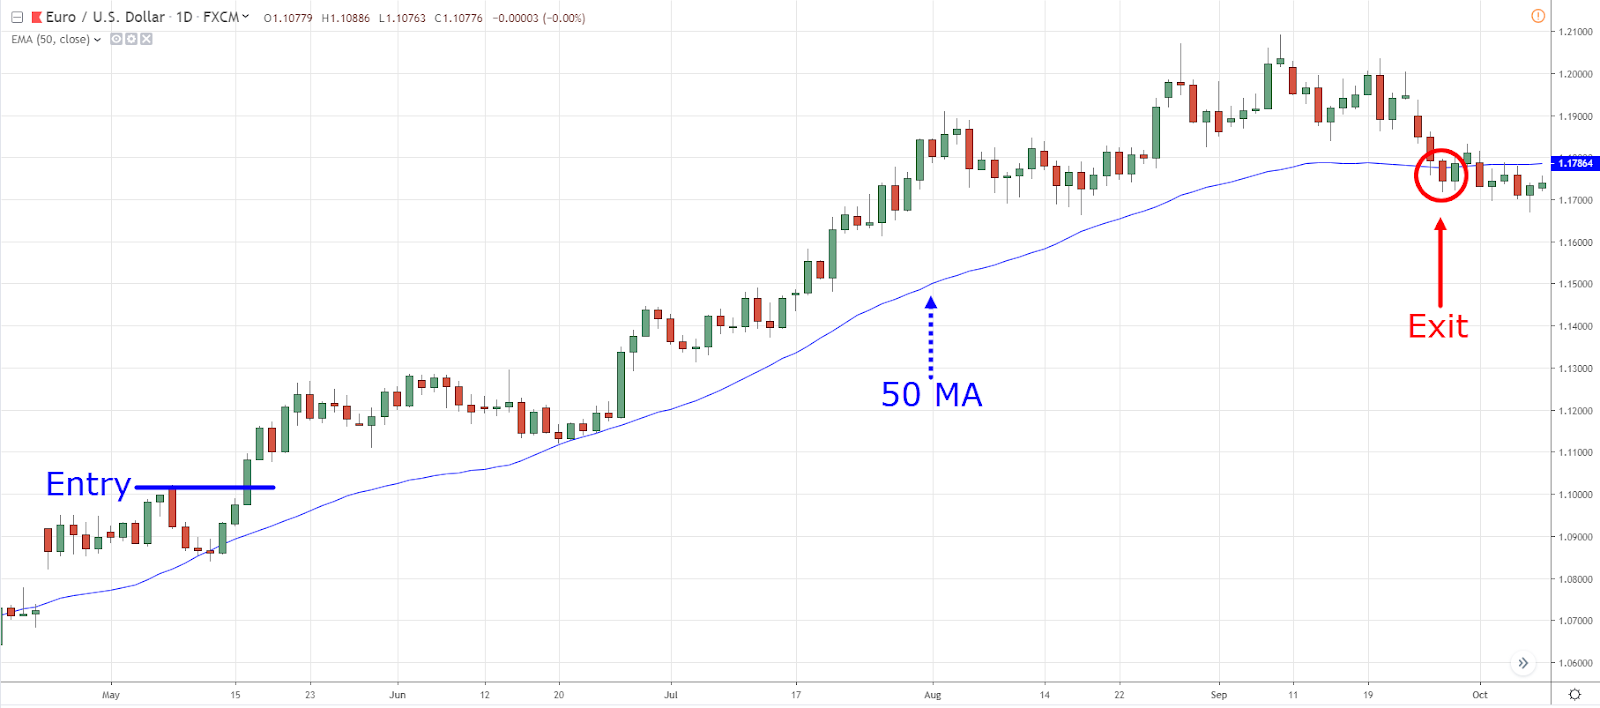
One of the most common candlestick patterns is the doji, which you can see in the chart above on May 15th. The chart prints a doji signifying a possible trend reversal, and simultaneously bouncing off the 50-day moving average. This became a confirmation of a long-term bullish movement which lasted till October. when the price action fell below the 50-day MA, it became the exit point for a successful trade.
In the chart above, we can see the reversal pattern on May 15th. A significant price increase follows the pattern over the next few months.
Another important technical analysis tool is the moving average, traders use this to identify trends in the price action. In the chart above, we can see that the 50-day moving average acted as a strong support level throughout the period, with the price bouncing off it several times.
Conclusion
By learning to identify these common candlestick patterns, traders can gain a better understanding of market sentiment and make more informed trading decisions. However, it is important to remember that professional traders do not use this patterns in isolation. A combination of candlesticks with other technical and fundamental analysis tools is best.
ParadiseFamilyVIP members combine market insights with expert trading strategies, which is how we have recorded huge success in our over seven years of professional crypto signals services.
What is different here
Most guides stop at the theory. The MyCryptoParadise team shares the live trades, and the reasoning behind each one, inside ParadiseFamilyVIP. Everything here is education, not financial advice.
Crypto trading involves substantial risk and is not suitable for everyone. Nothing here is financial advice; it is education only. Never risk more than you can afford to lose.


Join the discussion
No comments yet. Pro Paradiser members, share how you are reading this.