



MACD Indicator Explained
In short
The Moving Average Convergence Divergence (MACD) is a trend-following momentum indicator developed by Gerald Appel. It is constructed from two exponential moving averages (EMAs) of an asset's price, specifically the 12-day EMA and the 26-day EMA. It also includes a 9-day signal line. Traders use MACD to identify potential trend shifts, momentum changes, and buying or selling opportunities by observing crossovers, the histogram, and divergences.
Cryptocurrency trading is a highly volatile and dynamic market, and traders are constantly searching for effective tools and indicators to help them make informed decisions. One such popular indicator used in crypto trading is the Moving Average Convergence Divergence (MACD). The MACD is a versatile and powerful tool that can assist traders in identifying potential trends, spotting buying and selling opportunities, and managing risk. In this article, we will explore the concept of MACD and its application in crypto trading.
Introduction to MACD

The MACD is a trend-following momentum indicator that was developed by Gerald Appel in the late 1970s, as StockCharts ChartSchool notes. It is based on the convergence and divergence of two exponential moving averages (EMAs) of different periods. The MACD consists of three components: the MACD line, the signal line, and the histogram.
The MACD line is calculated by subtracting the 26-day EMA from the 12-day EMA. The resulting line oscillates above and below the zero line, representing the difference between the two EMAs. The signal line, often a 9-day EMA of the MACD line, is plotted on top of the MACD line to generate trading signals. The histogram represents the difference between the MACD line and the signal line and provides visual cues about the strength of the trend.
The zero line adds one more reference point. MACD sits above zero when the 12-day EMA is above the 26-day EMA, which points to upward momentum. A cross below zero means the faster average has dropped under the slower one.
How Crypto Traders Use MACD Signals
One of the primary uses of the MACD indicator is to identify potential trend reversals. When the MACD line crosses above the signal line, it gives a bullish signal: the price may be turning up. When the MACD line crosses below the signal line, it gives a bearish signal: the price may be turning down. Many traders treat these crossovers as a prompt to check the chart, not as an order to buy or sell.
Another application of the MACD is spotting divergence, which occurs when the price of a cryptocurrency moves in the opposite direction to the indicator. The section below explains bullish and bearish divergence and how to trade them.
The MACD histogram is a useful tool for assessing the strength of a trend. When the histogram bars are above the zero line and increasing in height, it indicates that the bullish momentum is strengthening. Conversely, when the histogram bars are below the zero line and decreasing in height, it suggests that the bearish momentum is gaining strength. Traders often look for histogram crossovers above or below the zero line as confirmation of trend reversals.
MACD Divergence: Bullish and Bearish
A MACD divergence is a warning that momentum no longer agrees with price. It does not time a reversal on its own. It tells you the current move is losing fuel, so you tighten your plan and wait for the market to confirm the turn.
Not every divergence carries the same weight. Class A is strong: the classic case, where price makes a new high or low and the MACD turns the other way. Class B is medium: price makes an equal high or low, a double top or bottom, while the MACD still diverges. Class C is weak: price makes a new extreme, but the MACD only prints an equal high or low. Our guide to bearish divergences ranked by strength covers each class in detail.
Bearish divergence on the MACD
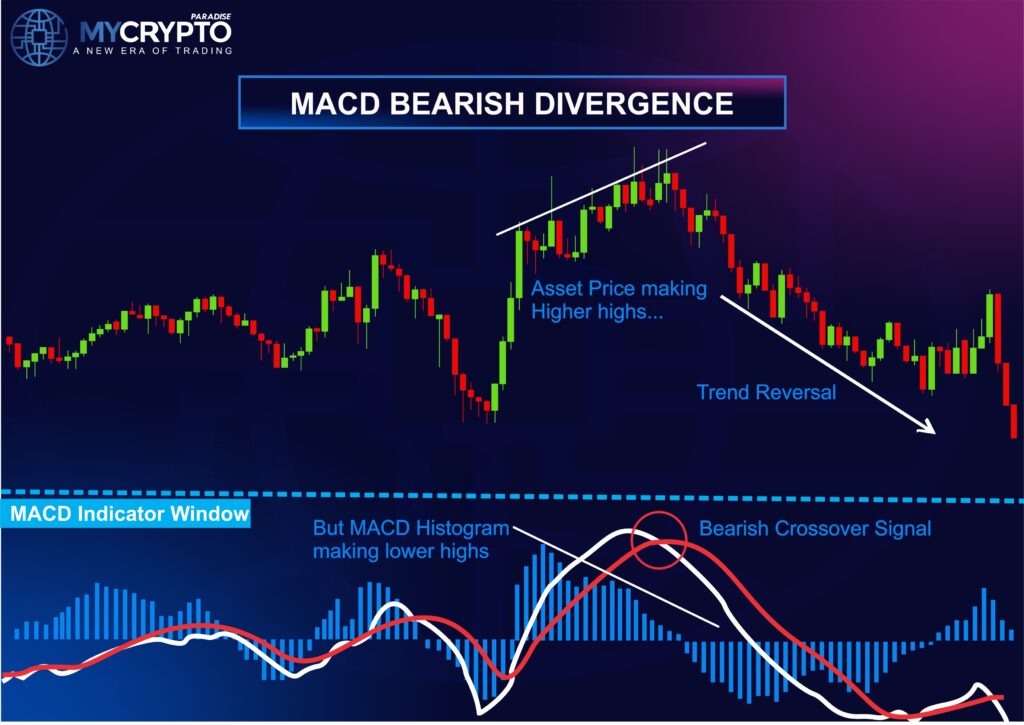
In an uptrend, price keeps printing higher highs. If the MACD line or histogram prints lower highs over the same candles, buyers are pushing with less force. The chart above shows the usual sequence: the divergence forms first, the MACD line then crosses below the signal line, and the trend turns.
Bullish divergence on the MACD
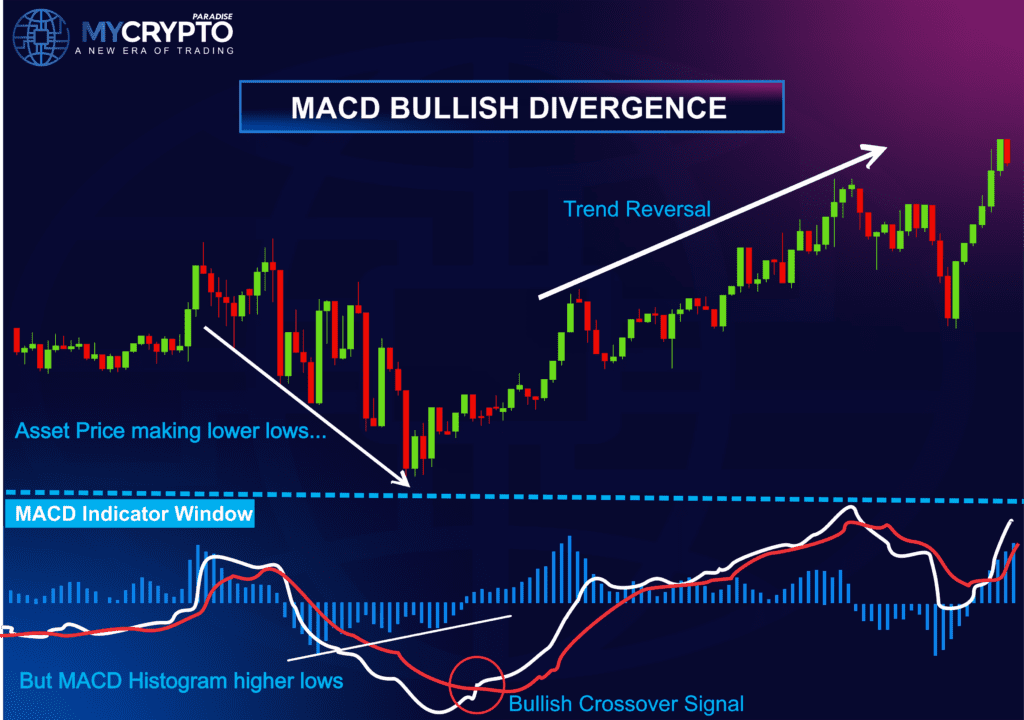
The mirror case forms in a downtrend. Price prints lower lows while the MACD prints higher lows, so each new low is sold with less conviction. Compare the troughs on both panels over the same candles. The pattern only counts when the MACD troughs line up in time with the price troughs. The chart above shows the mirror sequence: the divergence forms first, the MACD line then crosses above the signal line, and the trend turns up.
How to trade a MACD divergence
Wait for momentum to diverge from price, then let the market confirm the turn before you enter. A MACD crossover or a reversal candle is the trigger, the stop goes beyond the divergence extreme, and the target is set before entry. The same plan works in both directions. Only the side of the trade changes.
- Confirm the trend. Price must reach a new or equal high for a bearish divergence, or a new or equal low for a bullish one.
- Mark the divergence. Draw one line across the two price extremes and one across the matching MACD extremes. The two lines must disagree: they point in opposite directions, or one of them is flat. If both are flat, there is no divergence.
- Wait for a trigger. A MACD crossover of the signal line or a reversal candle confirms the turn. Entering on the divergence alone is usually early.
- Enter beyond the trigger candle. A short goes in just below the low of the confirming candle. A long goes in just above its high.
- Place the stop at the extreme. The stop sits above the divergence high for a short, or below the divergence low for a long. If price breaks that level, the setup is invalid.
- Set the target before you enter. Use the nearest support or resistance, or a risk-reward ratio of at least 1:2. Some traders also project the height of the prior swing from the entry.
The two charts below show the same plan on each side. The first is a short after a bearish divergence, the second a long after a bullish one.
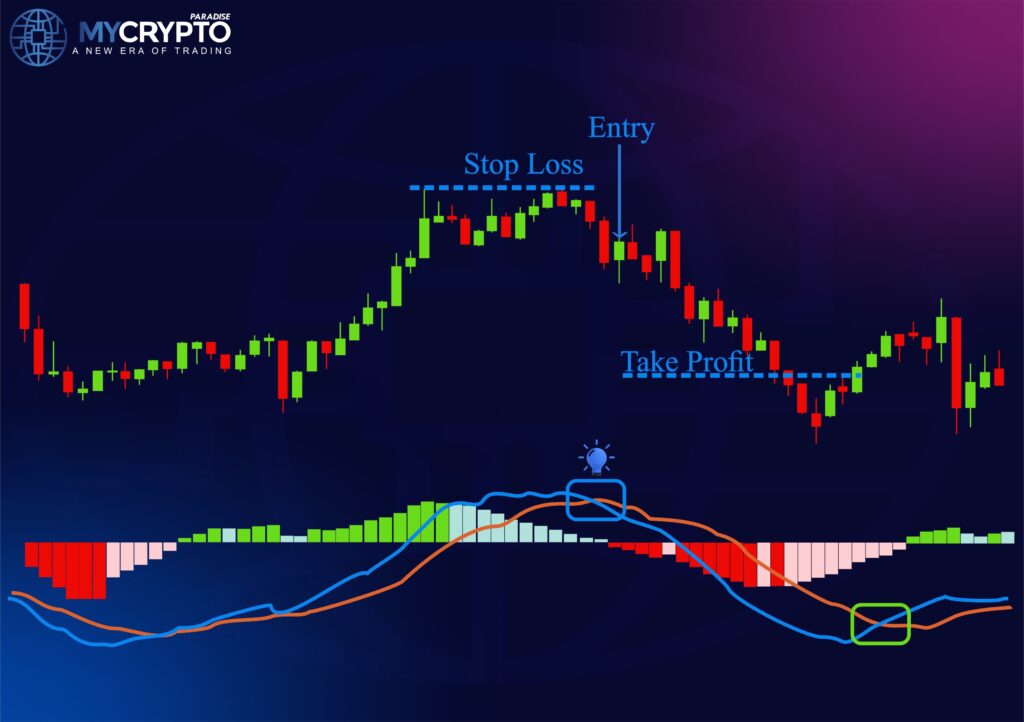
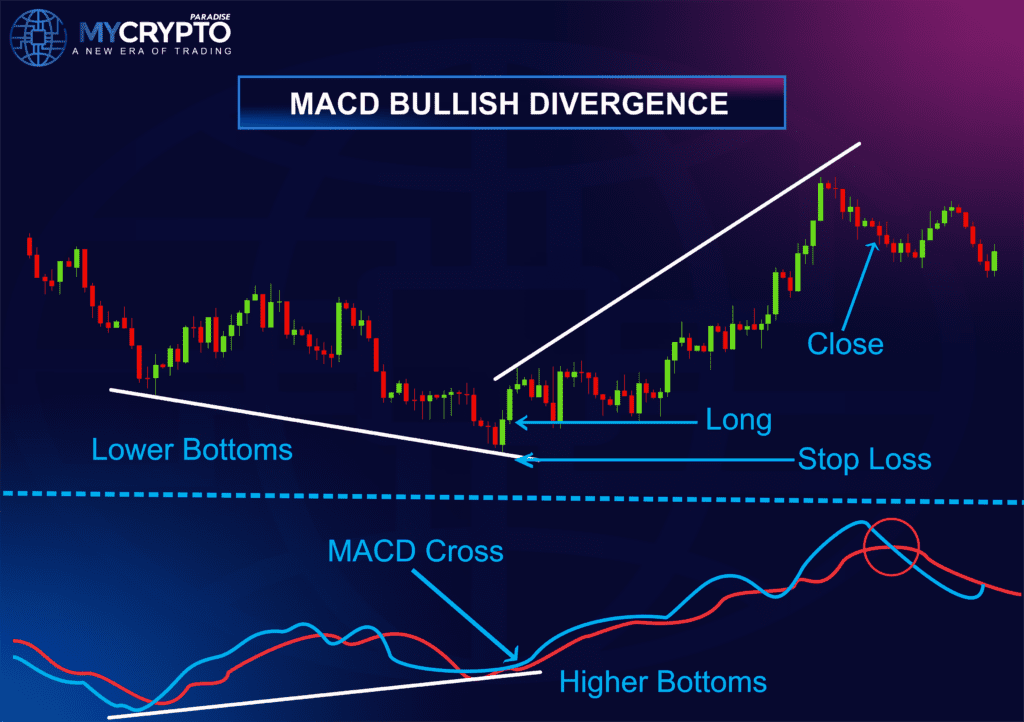
Divergence carries more weight on strong volume and when the Relative Strength Index (RSI) or a candlestick pattern agrees. In a strong trend, divergence can repeat several times before price turns, so the stop matters more than the signal. For the hidden variants, see our guide to hidden bullish and bearish divergence.
Using MACD to Confirm a Bearish Engulfing Pattern
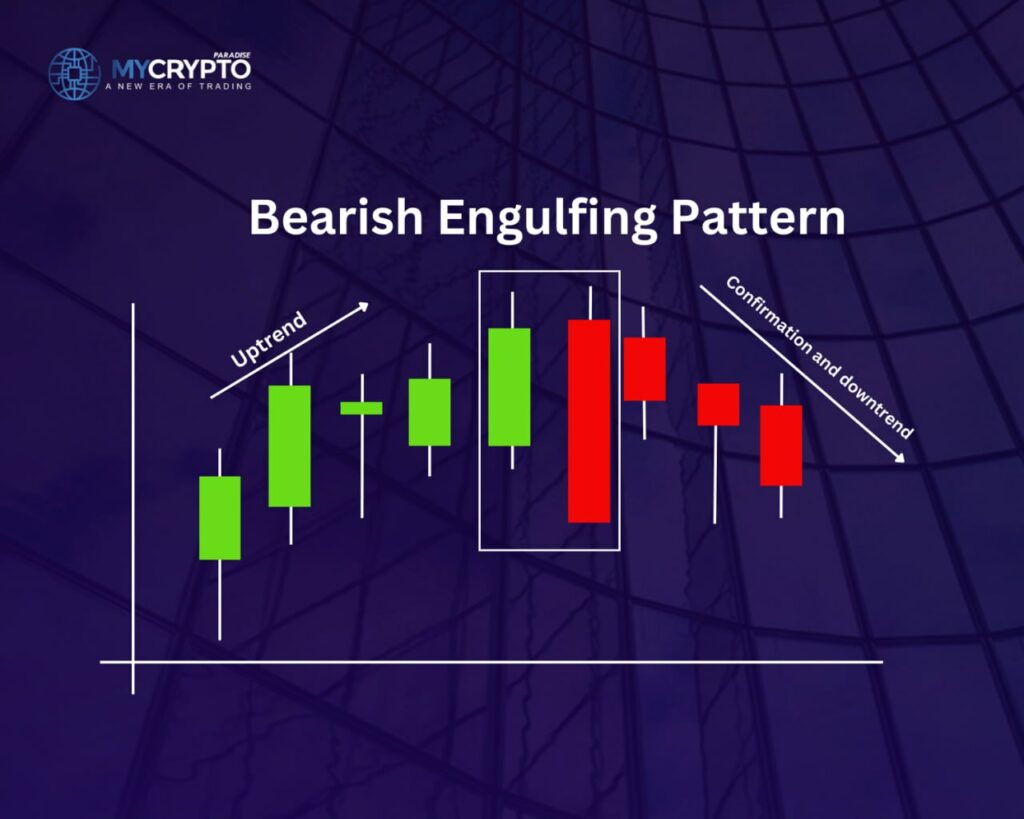
A bearish engulfing pattern forms when a large red candle fully covers the body of the smaller green candle before it. It shows sellers taking control at the top of a move. On its own it is one candle, not a trend change, so traders use MACD to check whether momentum agrees.
- Spot the pattern after an uptrend. The engulfing candle matters most at a swing high or at a resistance level.
- Check the MACD lines. The MACD line should sit below the signal line, with both lines turning down. A fresh bearish crossover on the same candle or the next one adds weight.
- Look for bearish divergence. If the high before the engulfing candle came with a lower MACD high, momentum was already fading.
- Check volume. An engulfing candle on above-average volume shows real selling pressure.
- Plan the stop and target first. Place the stop above the engulfing high, or about two times the Average True Range (ATR) above the entry. Size the target so the reward is at least twice the risk.
- Manage the trade. If the MACD line crosses back above the signal line, or a bullish divergence forms, the bearish case is weakening. That is the moment to reassess or exit.
The risk-to-reward rule is simple arithmetic. With a 1:2 plan, a trader who is right on one trade in three roughly breaks even before fees. That is why the stop and the target are set before the entry, not after.
How to Judge the Quality of a MACD Signal
No MACD signal is certain, so judge each one before you act. Check five things: whether other indicators agree, the timeframe and market conditions, volume and liquidity, the fundamental backdrop, and your own risk plan. A signal that passes all five carries more weight than a bare crossover. Here is each factor in turn:
1. Confirmation from other indicators:
It is essential to confirm MACD signals with other technical indicators or chart patterns. For example, you can look for confirmation from indicators like the Relative Strength Index (RSI), Moving Averages (MAs), or trendlines. When several indicators align with the MACD signal, the reading carries more weight.
2. Timeframe and market conditions:
Consider the timeframe you are trading on and the prevailing market conditions. MACD signals may have varying degrees of effectiveness depending on the timeframe. Shorter timeframes may generate more frequent but potentially less reliable signals, while longer timeframes may produce more reliable but less frequent signals. Additionally, market conditions, such as trending or ranging markets, can impact the accuracy of MACD signals. Adapting the MACD settings to suit the specific cryptocurrency and timeframe being analyzed is crucial.
3. Volume and liquidity:
Volume and liquidity are essential factors to consider when evaluating MACD signals. Higher trading volume and liquidity generally indicate a more active and reliable market. A MACD signal that arrives on strong volume shows broad market participation. That makes it more credible than a signal on thin volume.
4. Fundamental analysis:
While the MACD is a technical analysis tool, it’s important to consider fundamental factors that may influence the cryptocurrency being traded. News events, project developments, regulatory changes, and market sentiment can significantly impact the price movement of cryptocurrencies. Adding fundamental analysis to the MACD signal gives you a fuller picture of the trade.
5. Risk management:
Managing risk is crucial for successful trading. Even with a reliable MACD signal, there is always a possibility of losses. Use stop-loss orders, size each position to your risk tolerance and follow a written trading plan. These habits limit the damage when a signal fails. It’s important to maintain discipline and not let emotions override risk management strategies.
In ParadiseFamilyVIP🎖️, we send crypto signals that you get from our team of professional traders. Reach out to us here.
How to Set Up the Entry Level, Stop Loss, and Take Profit for a MACD Signal
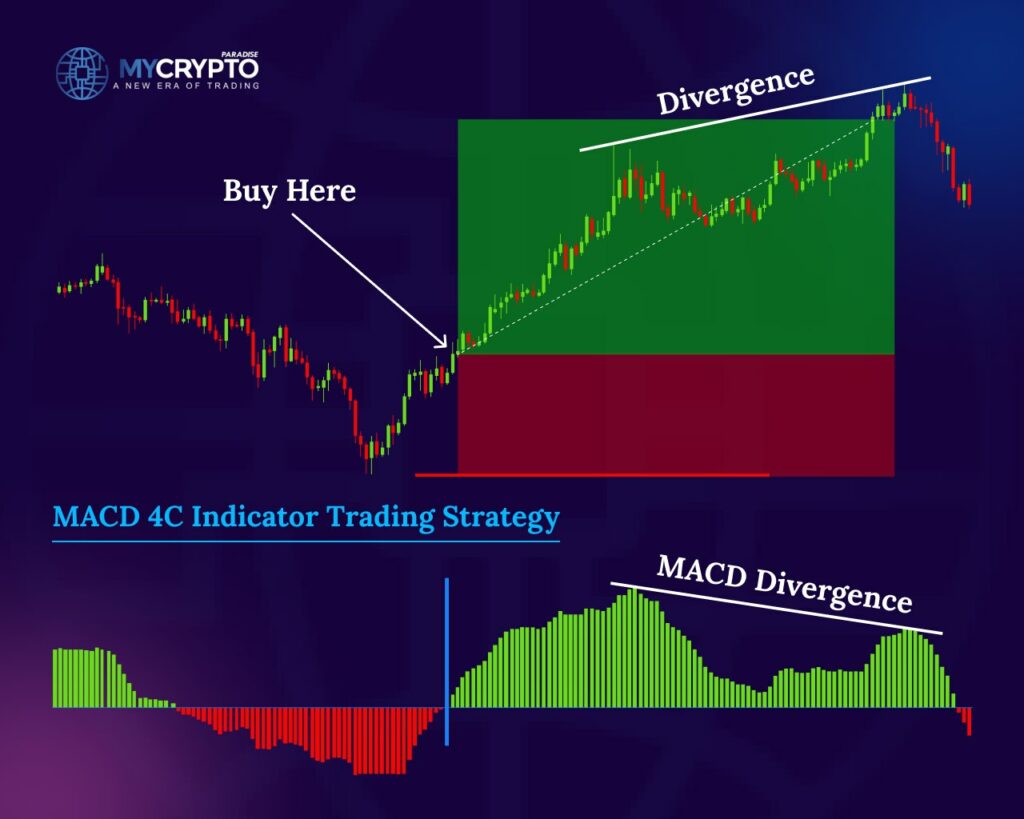
Setting the entry, take profit, and stop loss levels for a MACD signal involves a combination of technical analysis, risk management, and individual trading preferences. Here are some general guidelines to consider when setting these levels:
Entry point
- Ideally, you want to enter a trade when the MACD signal confirms a potential trend reversal or continuation. This could be when the MACD line crosses above or below the signal line.
- Some traders prefer to wait for additional confirmation from other indicators or chart patterns before entering a trade. For example, wait for a breakout of a key support or resistance level, or for price to retrace to a specific moving average.
- It’s important to set clear entry criteria and stick to them consistently to avoid emotional decision-making.
Take profit
- Determining the take profit level depends on your trading strategy and risk-reward ratio. Some common approaches include:
- Setting a fixed target based on a predetermined price level or percentage gain.
- Using key support or resistance levels as potential areas for profit-taking.
- Utilizing trailing stops to capture additional profits as the price moves in your favor.
- It can be helpful to analyze historical price data, chart patterns, or Fibonacci retracement levels to identify potential price targets.
Stop loss
- Setting a stop loss is crucial to protect your capital and limit potential losses if the trade goes against you.
- Stop loss levels can be determined using various methods, including:
- Placing the stop loss below the recent swing low (for long positions) or above the recent swing high (for short positions).
- Utilizing a percentage or fixed dollar amount loss that aligns with your risk tolerance. For example, you may choose to risk 1-2% of your trading capital per trade.
- Adjusting the stop loss based on volatility. A more volatile market may require a wider stop loss to account for price fluctuations.
- It’s important to set a stop loss level that allows for price fluctuations while still protecting your capital. Avoid setting the stop loss too tight, as it may result in premature stop-outs.
Conclusion
In conclusion, the Moving Average Convergence Divergence (MACD) is a versatile and widely used indicator in crypto trading. It helps traders identify potential trends, generate buy and sell signals, and assess the strength of a trend. Its most useful readings are crossovers, divergences and the confirmation of candlestick patterns such as the bearish engulfing. Still, no indicator is foolproof. Use MACD together with other analysis tools and a clear risk plan. Combining technical analysis, fundamental analysis and market awareness leads to better informed decisions in a volatile market.
The technical knowledge you’ve gained from this educational article is invaluable, but it alone won’t make you a consistently profitable trader in the long term. While this knowledge can give you an edge when used effectively, it works best when paired with proper trading strategies and tactics.
At ParadiseFamilyVIP🎖️, we combine advanced technical analysis, on-chain insights, precise sentiment monitoring, and a deep understanding of whale psychology with proven trading strategies. This shapes the crypto signals and portfolio management decisions we deliver, with a focus on disciplined risk management.
👉Check membership availability in ParadiseFamilyVIP🎖️ (Click it)
The ParadiseTeam provides full transparency, sharing every trade we enter, the planned exit points, and the reasoning behind each position, so you can see exactly how we read the market and build your own process.
MACD Crypto FAQ
What are the three parts of the MACD indicator?
MACD has three components: the MACD line, the signal line and the histogram. The MACD line is the 12-day EMA minus the 26-day EMA, and the signal line is a 9-day EMA of the MACD line. The histogram is the gap between the two lines. It shows how strong or weak the current momentum is.
What do MACD crossovers signal in crypto trading?
When the MACD line crosses above the signal line, it is read as a bullish signal that price momentum may be turning up. When the MACD line crosses below the signal line, it is read as a bearish signal that momentum may be turning down. These are cues to study, not certainties.
What are the best MACD settings for crypto?
There is no single best setting. Start with the defaults: 12 and 26 periods for the two EMAs and 9 for the signal line. Faster settings react sooner but give more false signals, while slower ones filter noise and react later. Test any change on your coin and timeframe before you rely on it.
Should you trade on MACD signals alone?
No. No single indicator is reliable on its own. MACD is built from moving averages, so it reacts after price has already moved. Confirm MACD signals with tools like RSI, moving averages, trendlines, volume, and fundamental context. Always apply risk management such as stop-loss orders and sensible position sizing before acting.
Crypto trading involves substantial risk of loss. This article is educational and is not financial advice. Past performance does not guarantee future results. Always do your own research.
What is different here
Most guides stop at the theory. The MyCryptoParadise team shares the live trades, and the reasoning behind each one, inside ParadiseFamilyVIP. Everything here is education, not financial advice.
Crypto trading involves substantial risk and is not suitable for everyone. Nothing here is financial advice; it is education only. Never risk more than you can afford to lose.












Join the discussion
No comments yet. Members, share how you are reading this.