


Listen: the breakdown
Market briefing: Spot Bitcoin ETFs bled $527 million last week, an eighth straight week of outflows, yet Bitcoin held firm near $63,258. The flow data is bearish, but the crowd keeps buying.
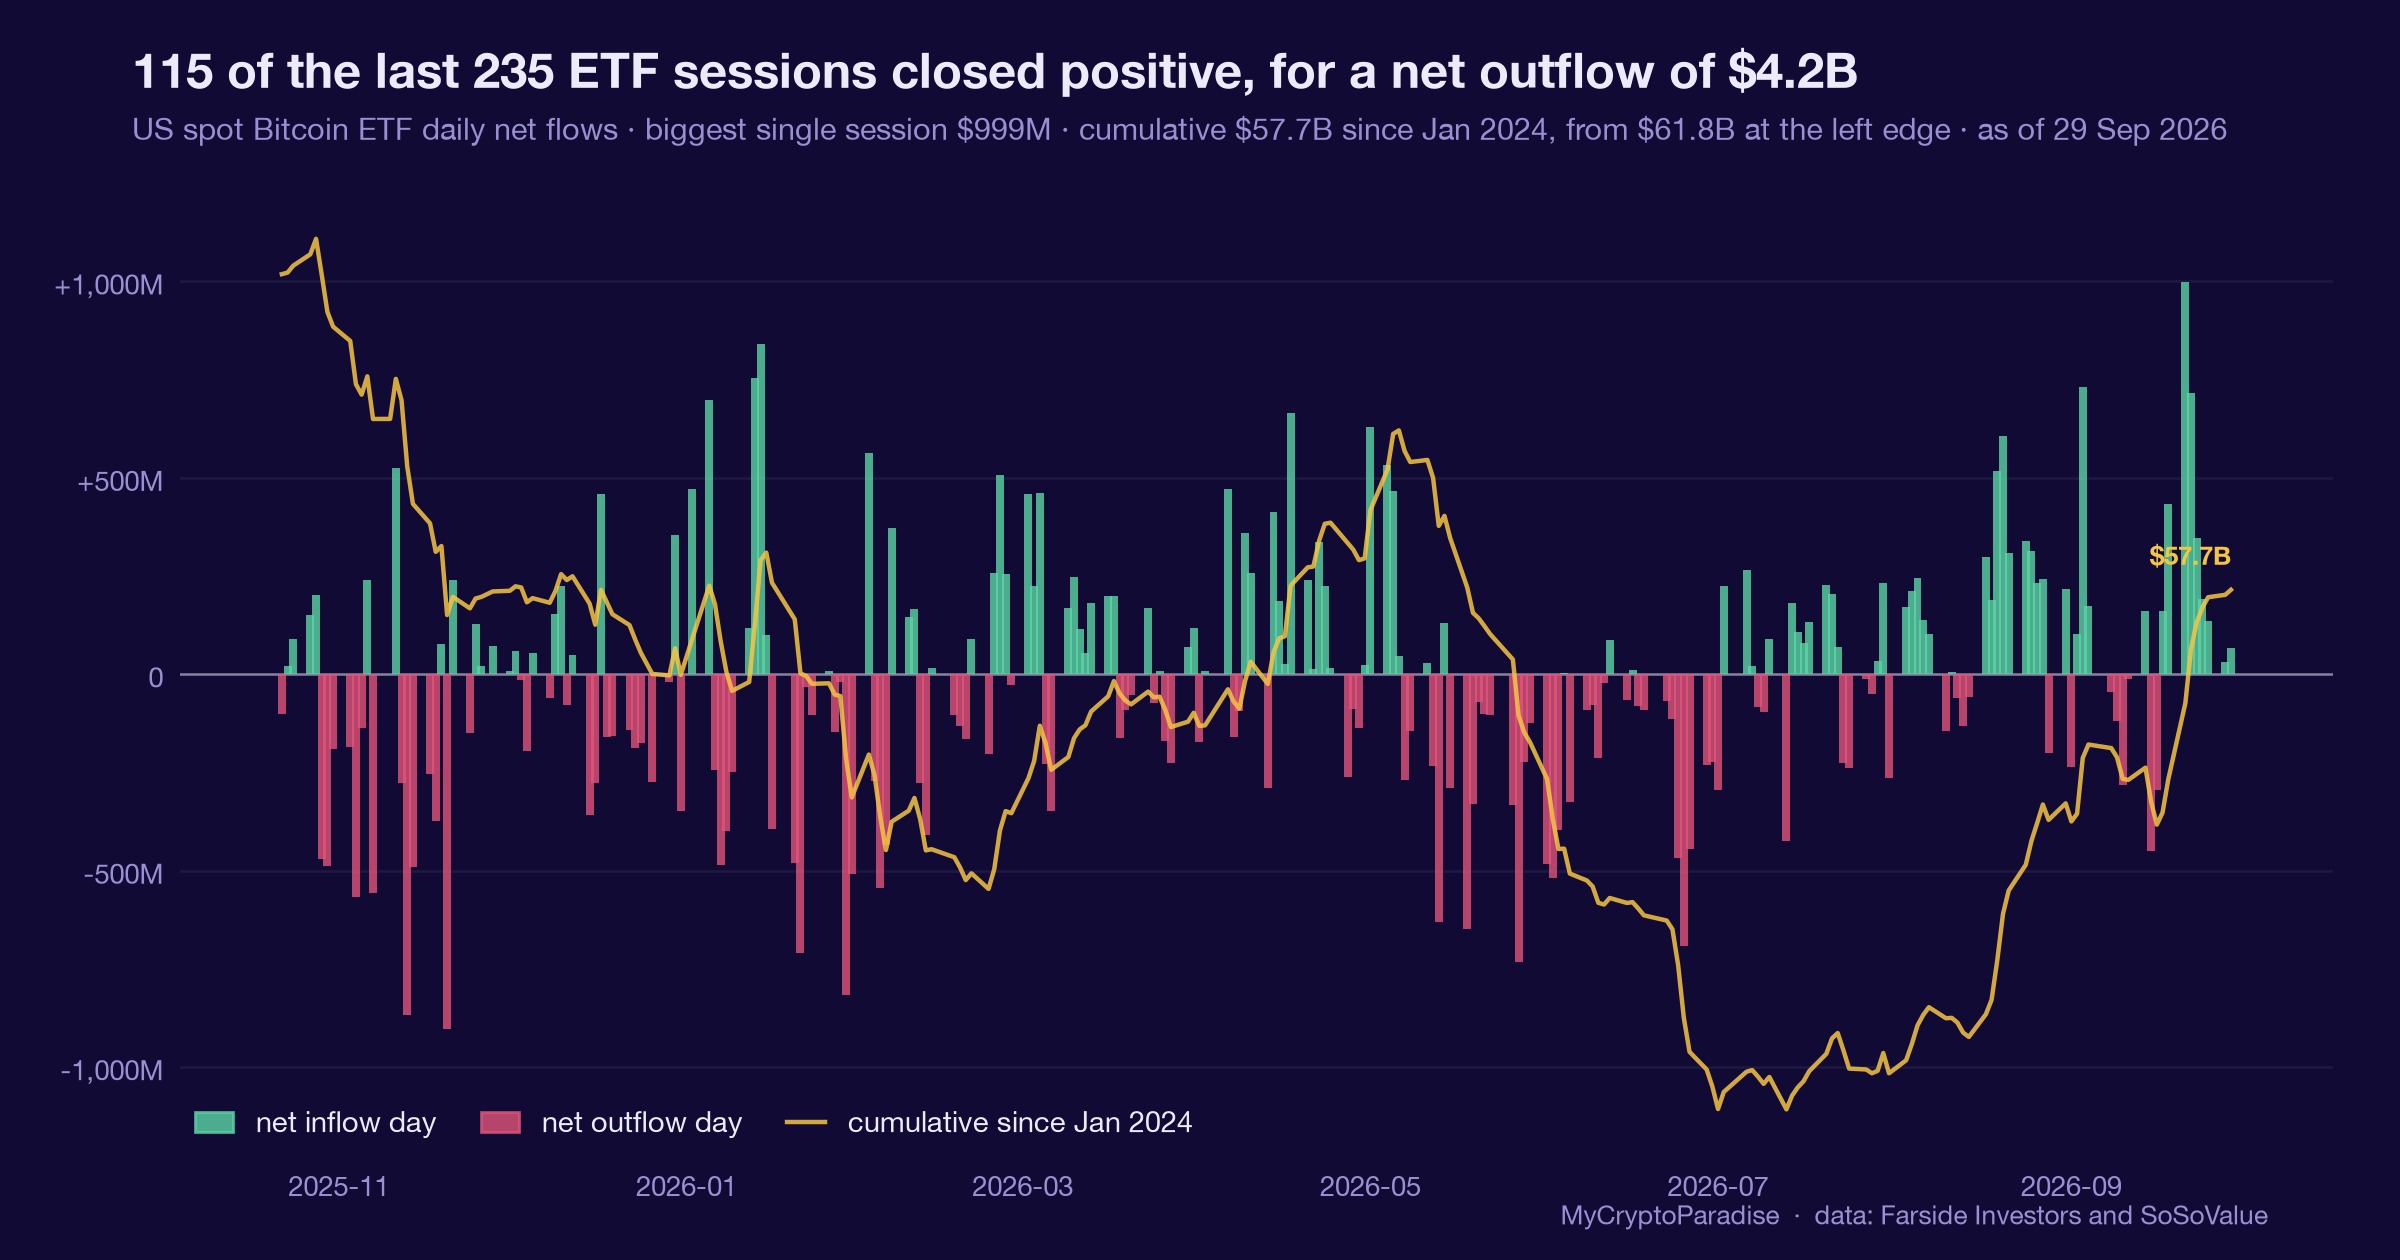
- Spot Bitcoin ETFs lost $527 million last week, the eighth straight week of outflows.
- BTC held near $63,258 and Ethereum near $1,779, shrugging off the bearish flow data.
- Retail is 78% long with greed near 80, while smart money keeps distributing at resistance.
Spot Bitcoin ETF outflows just hit $527 million, an eighth straight losing week, yet price barely moved. So who is quietly selling to all these eager buyers?
Money keeps leaving spot Bitcoin ETFs. Last week the exit reached $527 million.
That marks the eighth straight week of net outflows. Institutional demand is not just cooling. It is withdrawing.
Spot Ethereum ETFs told the same story. They lost $13.67 million over the period.
Yet Bitcoin is not falling. It was trading near $63,258, up 0.7% on the day, as this went out.
Here is the disconnect worth noticing. A clear bearish fundamental met a market that shrugged. Retail sees the green candle and buys. The Fear and Greed Index sits near 80, and roughly 78% of positions are long.
So we have steady outflows on one side and eager buyers on the other. Someone is selling into that demand. Someone always is.
That someone is rarely the crowd. Eight weeks of outflows is not panic selling. It is patient, orderly distribution.
The press release version says institutions are cautious. The order book version says they are handing coins to retail at resistance.
None of this guarantees a drop. Bitcoin can absorb outflows and grind higher. But the setup rewards caution, not greed.
This story extends a bearish thread we have followed all week. What is new is the scale. A $527 million exit is a heavy number for a market this calm.
The question is simple. Who blinks first, the sellers leaving through the ETF door, or the longs stacking below resistance?
Why eight weeks of outflows matter
Spot ETFs are the pipe between traditional money and Bitcoin. When that pipe runs in reverse, it removes a steady bid.
The $527 million did not leave in a day. It leaked out across a full week, on top of seven before it.
Persistent outflows drain passive demand. The automatic buying that supported price on the way up slows down. That changes the market's character. Price no longer floats on constant inflows.
It has to stand on the spot bid alone.
Ethereum feels the same gravity. Its $13.67 million outflow is small, but it points the same direction.
The macro backdrop does not help. Institutions trim risk when they expect tighter conditions or better entries later.
There is no single confirmed catalyst behind this week's number. That is our honest read, not a reported cause. But the pattern is the point. One bad week is noise.
Eight in a row is a trend.
Meanwhile sentiment runs hot. A Fear and Greed reading near 80 usually marks the late innings, not the start.
So the fundamentals and the mood are pulling apart. Outflows say caution. The crowd says party.
Structurally, that gap tends to close the painful way. Either inflows return fast, or price falls to meet the fear the crowd refuses to feel.
How the outflows ripple through liquidity
Start with Bitcoin, because everything downstream follows it. Fading ETF demand thins the buy side just below resistance.
With 78% of the market long, the stops are stacked below. That is a liquidity pool, and pools get hunted.
A move down toward $59,400 would liquidate those longs. Their forced selling becomes fuel for the very move they feared.
That is the cascade in one line. A weak bid plus crowded longs equals an easy path lower.
Ethereum sits one rung down the ladder. It was near $1,779, up 0.8%, and it rarely leads on the way down. If Bitcoin flushes, ETH usually flushes harder. Its own outflows remove any independent support.
Alts sit at the bottom of the ladder. XRP near $1.15 and Solana near $80.88 look calm today.
But alts borrow their liquidity from Bitcoin. When BTC drops fast, alt bids vanish first.
None of this is destiny. A strong reclaim of resistance would break the chain and trap the shorts instead.
For now the weight sits on the sell side. Outflows at the top of the ladder press on everything below.
The calm is the strange part. Markets this one-sided rarely stay this quiet for long.
What confirms the flush and what cancels it
Watch the ETF flow numbers first. A ninth week of outflows would confirm the trend is intact.
A sudden swing back to net inflows would be the first crack in the bearish case. Money returning changes everything.
Watch the $59,400 level closely. A clean break and hold below it opens the door to the downside target.
Watch how price behaves at resistance. Repeated rejections near the current zone favor the sellers. A decisive close above resistance would flip the story. It would trap late shorts and force a squeeze higher.
Watch the Fear and Greed Index. If it stays near 80 while price stalls, the greed becomes fuel for a flush.
A sharp drop in that index without a price crash would mean the froth is clearing quietly. That is healthier.
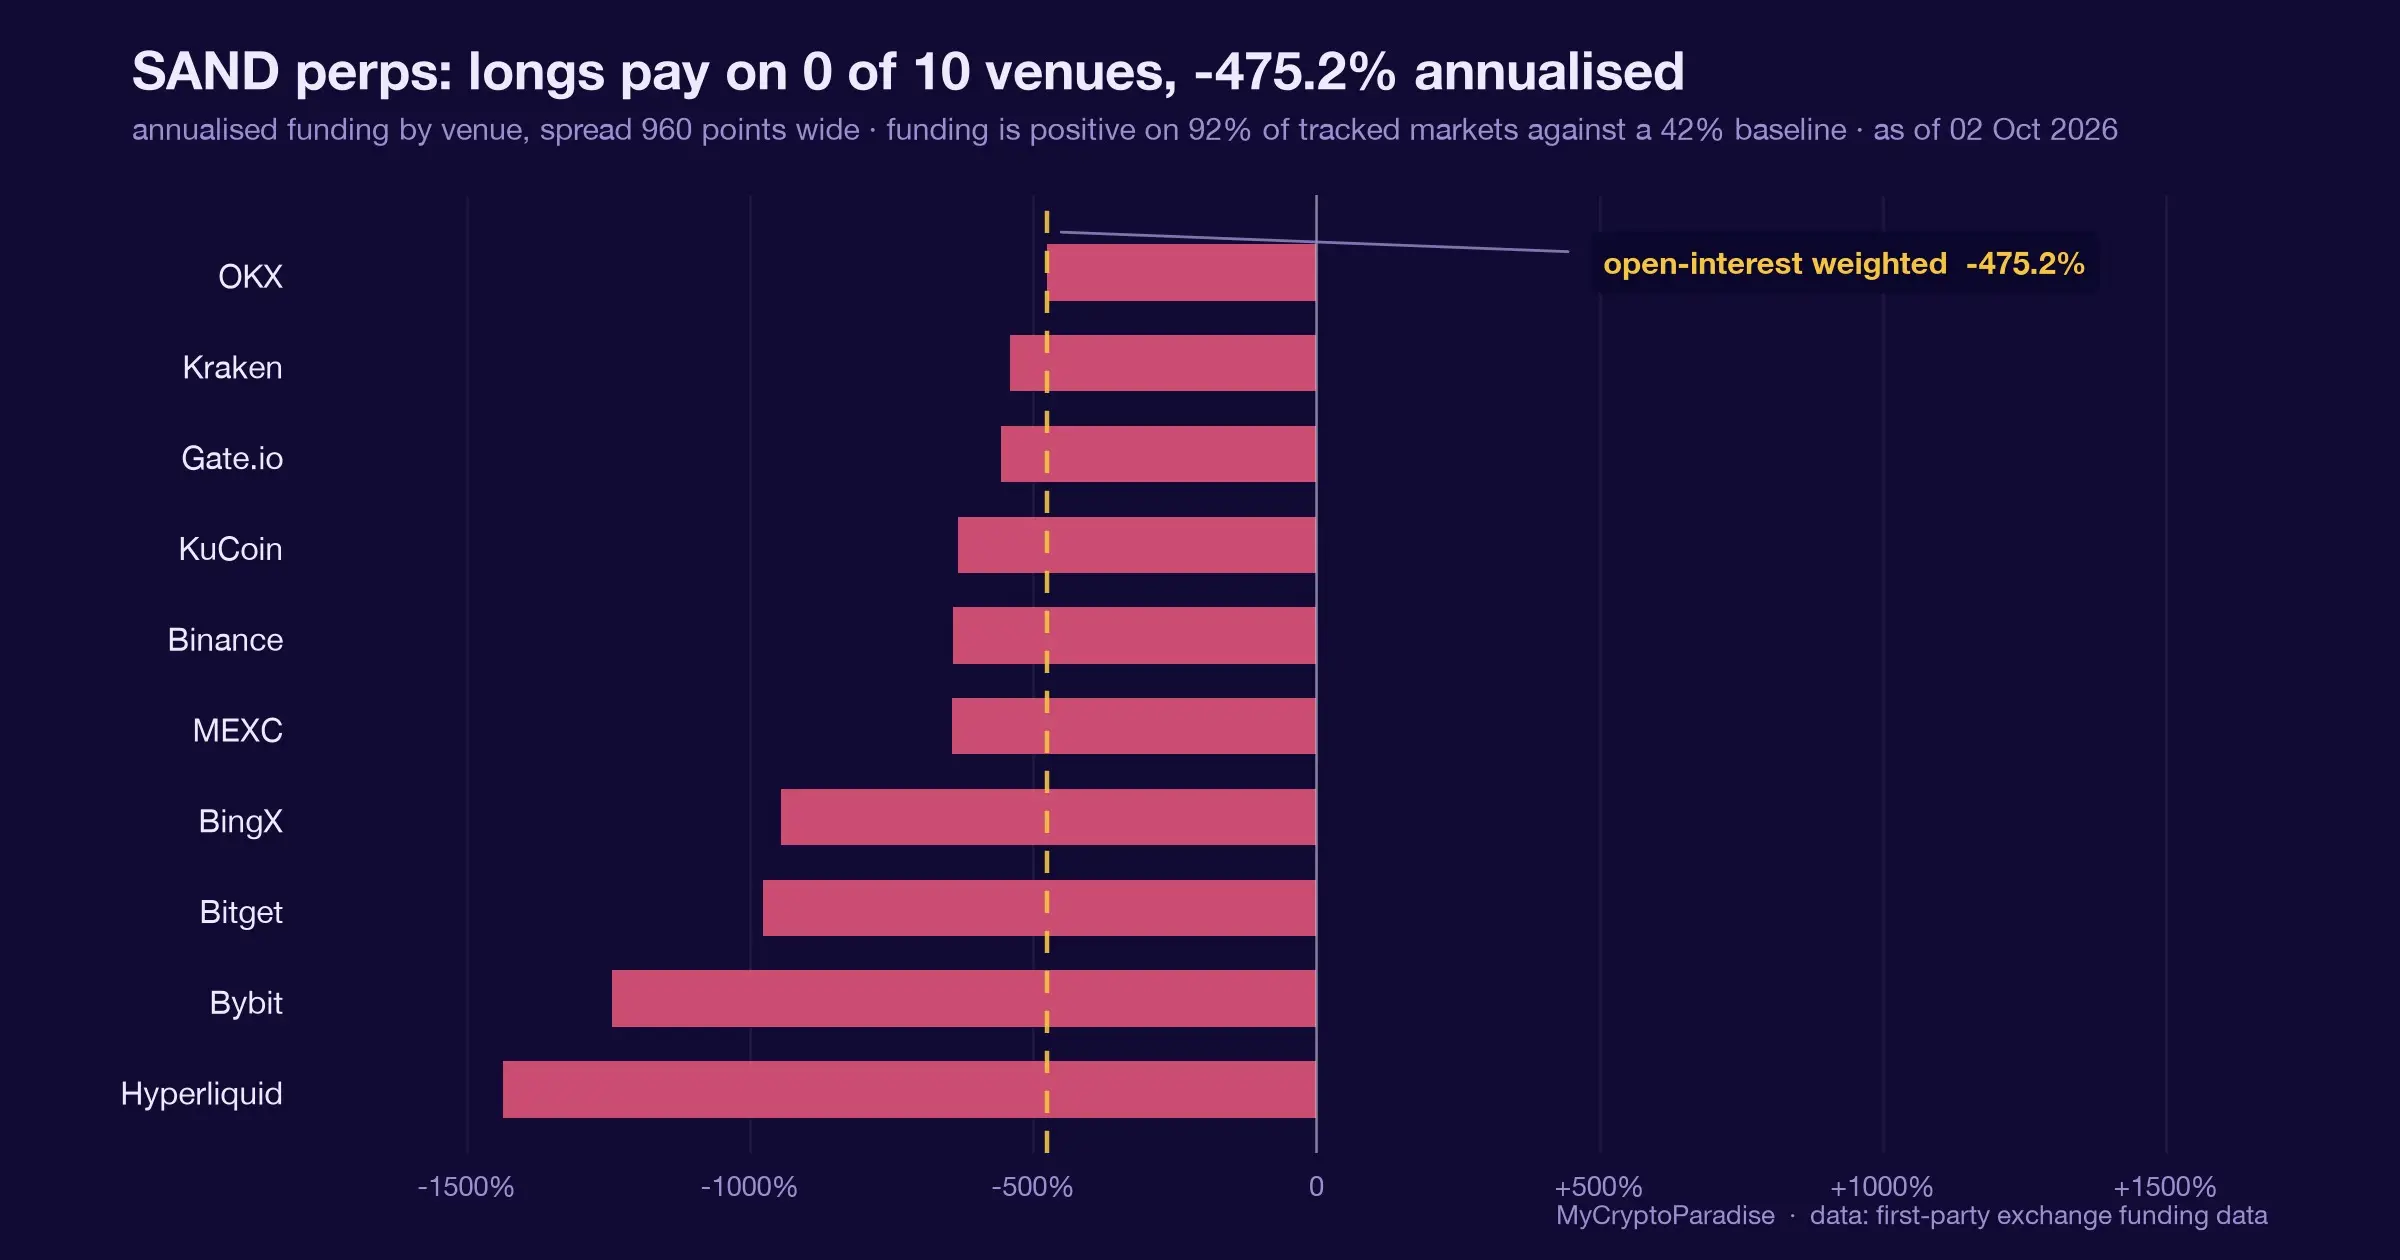
Watch open interest and funding rates. Rising open interest with positive funding means longs are still crowding in. If funding flips negative and stays there, the crowd may finally be capitulating.
Watch the liquidation clusters. The market tends to gravitate toward the thickest ones, because that is where the money is.
Above all, watch whether the crowd changes its mind. It usually does, right after it would have paid to.
Why these outflows matter at resistance
The ParadiseTeam reads this week's outflows as confirmation, not surprise. They fit a bearish medium-term view already in place.
BTC was trading near $63,258 as this published. That price sits at medium-term resistance, not far below it.
Here is what the outflows change. They give the bearish case a fundamental spine it did not have before.
The near-term map has two liquidation magnets. Upside sits around $68,000. Downside sits around $59,400.
With retail 78% long and greed near 80, the crowded side is the long side. That is where the stops live.
The ParadiseTeam's read is that smart money is absorbing this greedy buying. The outflows are the excuse to keep distributing.
So the path of least resistance points toward $59,400. Flushing those longs would reset positioning before any real push higher.
What would invalidate that read? A strong reclaim above resistance, with ETF flows turning positive again.
Until then, the calm price action looks like patience, not strength. The sellers are not in a hurry.
This is analysis, not a signal, and not financial advice. The edge is knowing where the crowd is trapped, then respecting the level that proves you wrong.
For exact entries, targets, and stop losses with full risk management, that is what ParadiseFamilyVIP is for. New to reading these moves? Start with our crypto trading strategies guide.
ParadiseTeam is monitoring the market situation closely, and we are taking these developments into consideration while building our trading tactics inside ParadiseFamilyVIP.
Crypto trading involves substantial risk. Prices are volatile and you can lose money. This article is educational and is not financial advice. Past performance does not guarantee future results.
Where does Bitcoin go next after eight weeks of ETF outflows?
Follow this topic: Bitcoin ETF news











Join the discussion
No comments yet. Members, share how you are reading this.