


Momentum Indicators Explained
In short
Momentum indicators in crypto trading measure the speed and strength of price movements, helping traders assess if a trend is gaining or losing conviction. They are best used as confirmation tools alongside market structure, key levels, and volume, rather than as standalone buy or sell signals. Popular examples include RSI, MACD, Stochastic Oscillator, and ADX.
- Momentum indicators in crypto trading measure the speed and strength behind price movement. It helps traders assess whether a trend is gaining strength or losing momentum rather than predicting direction.
- Indicators like RSI, MACD, Stochastic Oscillator, and ADX are most effective when used together with market structure, key levels, volume, and price action instead of being treated as standalone buy or sell signals.
- Professional crypto traders use momentum as a confirmation tool to validate trade setups, identify weakening trends early through divergence, and improve timing while maintaining strict risk management and structured decision-making.
Momentum indicators in crypto trading are essential tools that measure the speed and strength behind price movement. In a market driven by volatility and emotion, they help crypto traders understand whether a move has real conviction or is fading. Most traders misuse momentum indicators by treating them as direct entry signals. Practically, the crypto market often remains overextended for long periods and makes isolated indicator signals unreliable without context.
MCP University FREE is our service that prepares you for professional crypto trading. Explore it to understand the framework behind our trading success. This article breaks down the key momentum indicators in crypto trading and explains how professional traders apply them with structure and precision in real market conditions.
What Are Momentum Indicators in Crypto Trading?
Momentum indicators are technical analysis tools that measure the rate of change in price over a given period. Their primary function is not to predict direction, but to quantify the strength behind an existing move.
In the crypto market, this distinction is critical. Price alone only shows movement, while momentum shows conviction. A strong trend with rising momentum suggests active participation and potential for continuation. A trend moving on declining momentum often signals exhaustion and an increasing risk of reversal.
Most momentum indicators are derived from price data such as closes, highs, and lows. They transform this information into oscillating values or trend lines that allow traders to identify shifts in pressure between buyers and sellers.
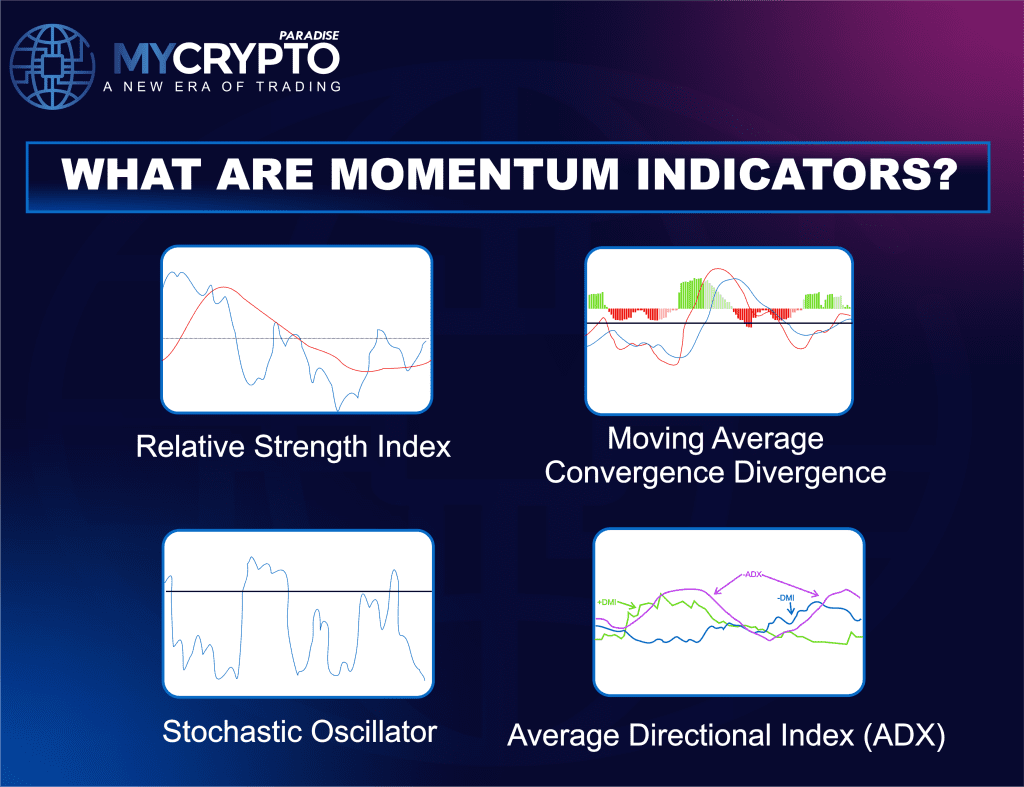
Common examples include RSI, MACD, Stochastic Oscillator, and Average Directional Index (ADX). Each measures momentum from a different perspective, but all aim to answer the same core question: Is the current move strengthening or weakening?
When are Momentum Indicators Effective?
In practical crypto trading, momentum indicators are most effective when used in context. A high RSI reading in a strong uptrend does not automatically signal a reversal. Similarly, a low RSI in a strong downtrend does not automatically signal a buy opportunity. Without structure, these readings lose reliability.
Professional traders interpret momentum as part of a complete market picture. They evaluate it alongside trend direction, key levels, volume behavior, and candlestick structure to confirm whether momentum supports continuation or signals potential exhaustion. Understanding momentum in this way shifts the focus from reactive indicator signals to structured decision-making based on market behavior.
The Most Important Momentum Indicators in Crypto Trading
There is no single momentum indicator that works in every market condition. Each indicator measures momentum differently and provides unique insights into price action. Professional crypto traders do not search for the “best” indicator. Instead, they understand what each tool measures and apply it in the right market context.
The following momentum indicators are among the most widely used in crypto trading.
Relative Strength Index (RSI)
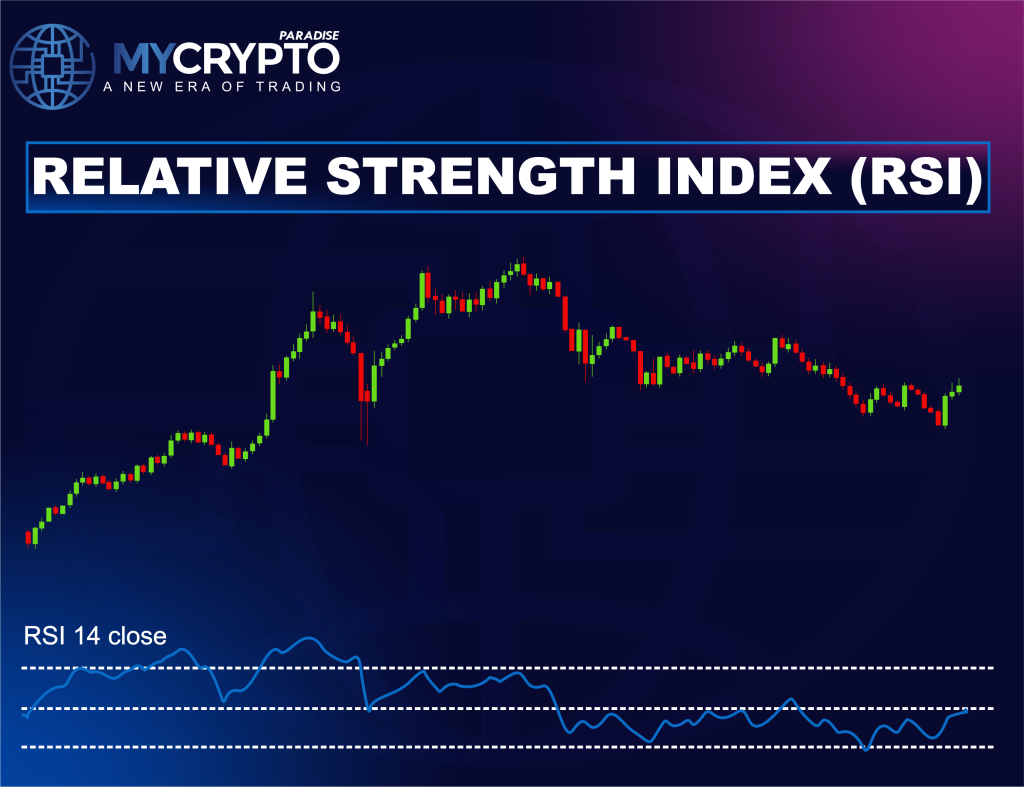
The Relative Strength Index (RSI) is one of the most popular momentum indicators in technical analysis. It measures the magnitude of recent price changes and helps traders assess whether buying or selling pressure is dominating the market.
RSI is displayed as a value between 0 and 100. You can use these values to interpret the price action of any asset in the crypto market.
Key RSI Levels
Above 70: At this value, any asset in the crypto market is considered overbought
Below 30: This is the level where you can consider that the asset is in oversold territory
Around 50: This value indicates neutral momentum of the asset
What RSI Helps Traders Identify?
RSI helps crypto traders to identify the following market conditions:
- Momentum strength
- Potential trend exhaustion
- Bullish divergence
- Bearish divergence
While many traders focus on overbought and oversold readings, professional traders pay closer attention to how RSI behaves relative to market structure and trend direction.
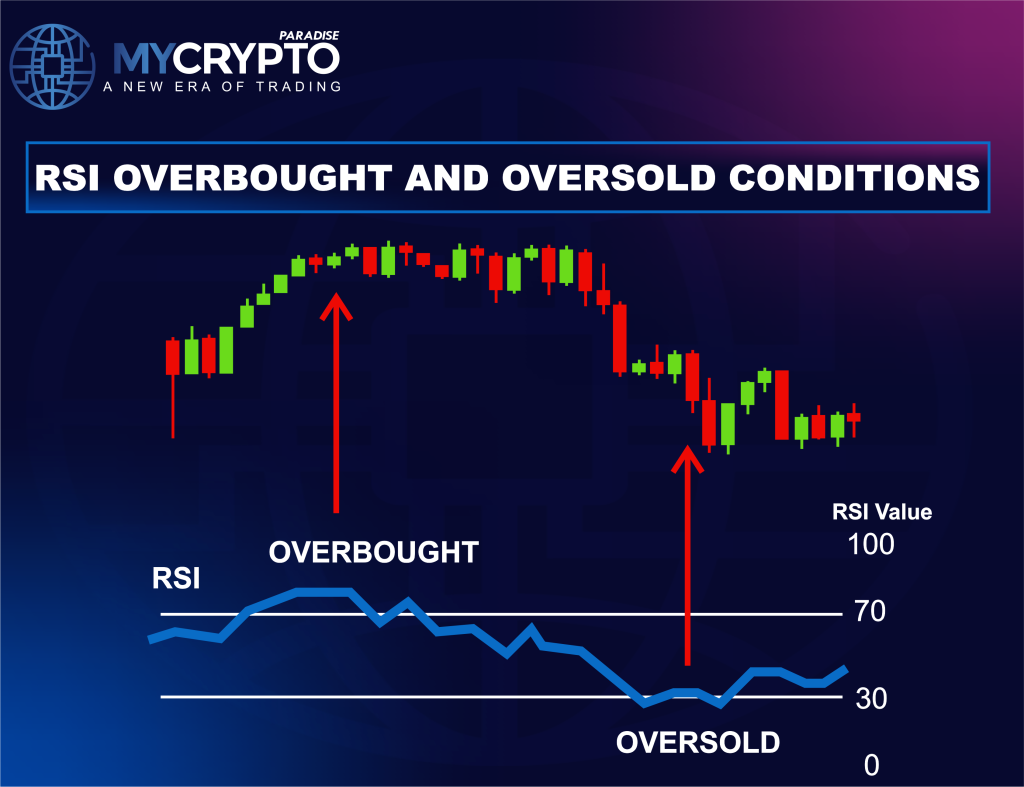
For example, an RSI reading above 70 during a strong uptrend often reflects strength rather than an immediate selling opportunity. RSI is most effective when traders use it to evaluate momentum shifts and divergence rather than as a standalone buy or sell signal.
Moving Average Convergence Divergence (MACD)
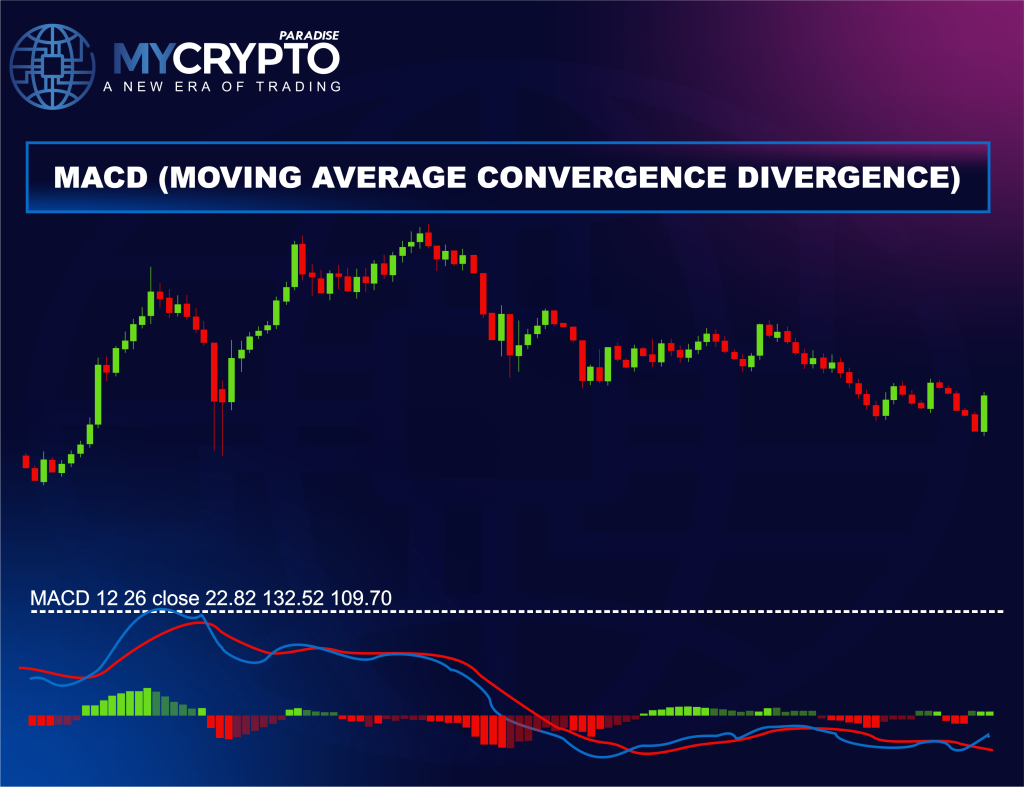
The Moving Average Convergence Divergence (MACD) is a momentum indicator that measures the relationship between two moving averages. Unlike RSI, which focuses on momentum extremes, MACD helps traders evaluate both momentum and trend strength.
It consists of three components:
- MACD Line
- Signal Line
- Histogram
Together, these elements provide insight into the direction and strength of market momentum.
- MACD Bullish Crossover: A bullish crossover occurs when the MACD Line moves above the Signal Line. This indicates that upward momentum is increasing and often serves as an early sign of potential trend continuation or reversal.
- MACD Bearish Crossover: A bearish crossover occurs when the MACD Line moves below the Signal Line. This suggests that selling pressure is strengthening and that momentum may be shifting to the downside.
- MACD Histogram: The histogram measures the distance between the MACD Line and the Signal Line. Expanding histogram bars indicate strengthening momentum. Contracting histogram bars indicate weakening momentum. Many professional traders monitor the histogram closely because it often reveals momentum shifts before a crossover occurs.
- MACD Divergence: Like RSI, MACD can also form bullish and bearish divergences. When price creates a new high, but MACD fails to do the same, it may signal weakening bullish momentum. Conversely, when price creates a new low while MACD forms a higher low, it may indicate that bearish pressure is fading.
You can use MACD to evaluate trend momentum and identify shifts in market strength. Rather than focusing solely on crossovers, serious traders use MACD to assess the quality of a trend and confirm whether momentum supports the current price movement.
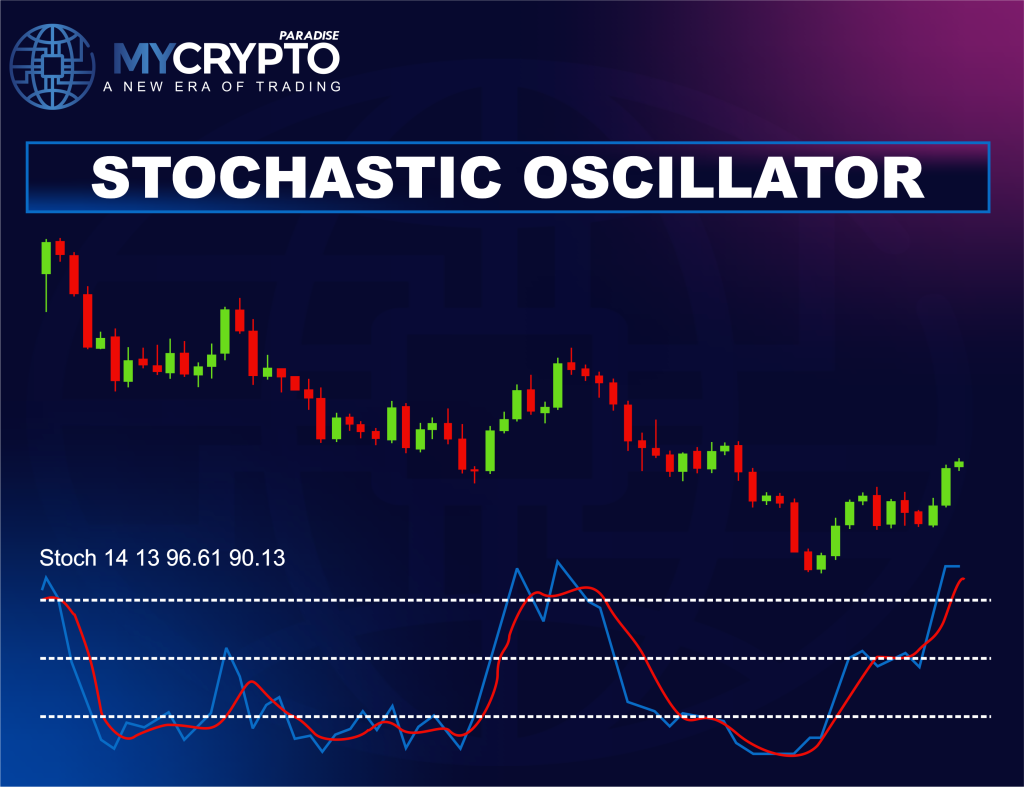
Stochastic Oscillator
The Stochastic Oscillator is a momentum indicator that compares the current closing price to its recent trading range. It helps traders determine whether momentum is accelerating or slowing as the price approaches the upper or lower boundaries of that range.
Like RSI, the Stochastic Oscillator moves between 0 and 100, but it tends to react more quickly to short-term price fluctuations.
Key Stochastic Levels
Above 80: When the value of Stochastic is above 80, then you can say the asset is overbought
Below 20: This value shows that the asset is in oversold territory
These levels highlight areas where momentum may be stretched, but you should not treat them as automatic reversal signals.
Stochastic Crossovers
The indicator consists of two lines:
- %K Line
- %D Line
A bullish crossover occurs when the %K Line crosses above the %D Line, suggesting increasing upward momentum. A bearish crossover occurs when the %K Line crosses below the %D Line, indicating growing downside momentum.
Best Use Cases for the Stochastic Oscillator
The Stochastic Oscillator performs best in ranging markets where price regularly moves between support and resistance levels.
You can use the stochastic indicator to:
- Identify potential reversal zones within a range
- Fine tune entry timing
- Confirm short-term momentum shifts
In strong trends, however, the indicator can remain in overbought or oversold territory for extended periods, which reduces the reliability of reversal signals.
The Stochastic Oscillator is a valuable tool for measuring short-term momentum and identifying potential turning points within a trading range. Its effectiveness increases significantly when combined with support and resistance rather than used in isolation.
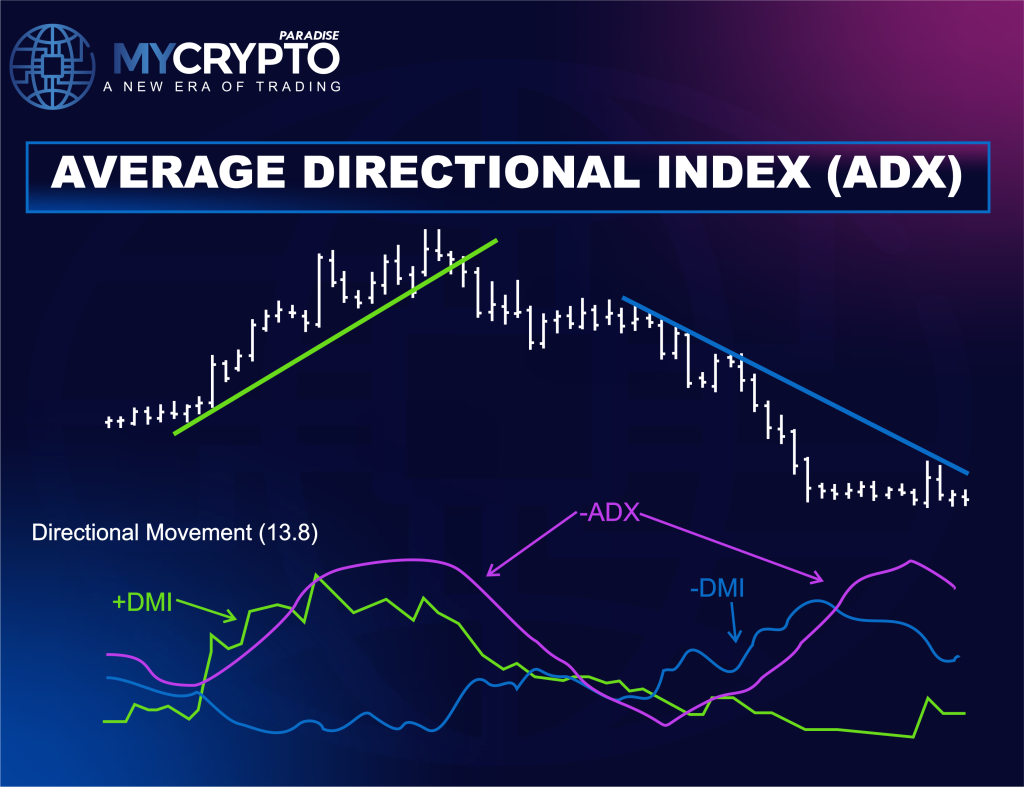
Average Directional Index (ADX)
The Average Directional Index (ADX) is a momentum indicator that measures the strength of a trend. Unlike RSI or Stochastic Oscillator, ADX does not indicate whether the market is bullish or bearish. Instead, it tells traders how strong the current trend is, regardless of its direction.
This makes ADX particularly valuable because a strong trend can exist in both rising and falling markets. ADX is also displayed as a value between 0 and 100.
- Below 20: Weak or ranging market
- 20 to 25: Trend begins to develop
- Above 25: Strong trend
- Above 50: Very strong trend
The higher the ADX reading, the stronger the trend momentum of the asset in the crypto market.
How Professional Traders Use ADX?
One of the biggest challenges in crypto trading is determining whether the market is trending or consolidating. ADX helps answer this question.
When ADX is rising, it indicates that trend strength is increasing. When ADX is falling, it suggests that the current trend is losing momentum. This information helps crypto traders adapt their strategy to current market conditions.
For example:
- Rising ADX can suggest to support trend-following strategies.
- Falling ADX can signal that breakout opportunities are becoming less reliable.
- Low ADX readings often indicate range-bound conditions where support and resistance play a larger role.
ADX and Trend Confirmation
Many crypto traders use ADX as a filter rather than a standalone indicator. A bullish breakout accompanied by a rising ADX carries more weight than a breakout occurring while ADX remains weak.
Similarly, a bearish trend supported by increasing ADX suggests that sellers remain in control of market momentum. This allows traders to focus on high-conviction moves and avoid trades that lack sufficient strength.
The Average Directional Index helps traders measure trend strength and distinguish between trending and ranging market conditions. Rather than predicting direction, it provides valuable insight into whether the current move has enough momentum to sustain itself.
How Traders Combine Momentum With Market Structure?
Momentum indicators only become reliable when they are used inside a structured trading framework. On their own, they can produce misleading signals, especially in volatile crypto conditions where trends often extend far beyond expected overbought or oversold levels.
We do not trade momentum. We use momentum to validate what the market structure is already suggesting.
Momentum and Market Structure Alignment
Market structure is the foundation of all professional trading decisions. It defines whether the market is in an uptrend, a downtrend, or a ranging condition. Momentum is then used to measure the strength of that structure, not to define it.
In an uptrend, professional crypto traders use momentum to confirm whether bullish pressure is still expanding. Rising RSI, expanding MACD histogram, or increasing ADX readings typically support trend continuation. If momentum starts to weaken while price is still making higher highs, it often signals that the trend is losing internal strength, even if price has not reversed yet.
In a downtrend, momentum is used in the same way but from the opposite perspective. Strong downside momentum confirms seller dominance, while weakening momentum during continued downside movement often signals exhaustion and potential reversal pressure building.
If momentum readings contradict the existing structure without any supporting confirmation from price action or key levels, professional traders avoid taking action. A single indicator divergence against a strong trend is not enough to justify a trade.
Momentum and Key Levels
Momentum signals only become meaningful when they occur near significant price zones such as support, resistance, supply, or demand areas. These levels define where market participants are likely to react, making them essential for interpreting momentum correctly.
High quality setups often occur when momentum aligns with these zones. For example, RSI or Stochastic showing weakness near a major resistance zone can indicate that buying pressure is fading at a critical level. Similarly, MACD momentum slowing down near supply zones may suggest that bullish strength is losing efficiency.
ADX adds another layer in this context. A rising ADX after a breakout from support often confirms that a new trend is gaining strength, while a weak ADX reading during a breakout may suggest a lack of conviction behind the move.
Without key levels, momentum signals lose structure and become random oscillations within price noise.
Momentum and Volume Behavior
Volume acts as the validation engine behind momentum. It shows whether participation is supporting the movement or fading behind it.
Professional traders look for alignment between momentum and volume to confirm the quality of a move. When momentum is rising alongside increasing volume during breakouts, it indicates strong participation and improves the probability of continuation. During corrections or pullbacks, weakening momentum combined with declining volume often suggests that the move is corrective rather than a full reversal.
One of the most important signals occurs when volume and momentum diverge. For example, price may continue trending upward while momentum weakens and volume declines. This combination often signals that the trend is losing internal strength even though the price has not yet reacted.
When momentum and volume confirm each other, the move is considered higher quality and more sustainable.
Momentum and Price Action Confirmation
Momentum indicators are always secondary to price action. They do not replace candlestick behavior or structural confirmation. Instead, they support decisions after the market has already revealed intent.
Professional traders typically wait for price confirmation before acting on any momentum signal. This includes:
- A break of structure that confirms a directional shift
- A retest of a key level that validates support or resistance
- A strong rejection or continuation candle that shows clear market intent
Only after one of these confirmations do momentum signals become actionable. Without this sequence, momentum readings can easily lead to premature entries or false assumptions about market direction.
Common Mistakes Traders Make With Momentum Indicators
Most losses related to momentum indicators do not come from the tools themselves, but from how crypto traders interpret and apply them. The issue is almost always a lack of context and an overreliance on isolated signals.
Using Momentum Signals as Direct Buy or Sell Triggers
One of the most frequent mistakes is acting on momentum readings in isolation.
For Example:
- Buying simply because RSI is oversold is a huge mistake
- Selling because RSI is overbought is also not a wise trading decision
- Entering trades on every MACD crossover will eventually wipe out your account
In the crypto market, strong trends can remain overextended for long periods. This means momentum extremes often reflect trend strength, not reversal signals.
Ignoring Market Structure
Another major mistake is using momentum without understanding the underlying structure.
Without structure:
- Momentum signals become random
- Trend direction is unclear
- Entries lack contextual support
Professional traders always define the market condition first before interpreting any momentum reading.
Overtrading Divergences
Divergence is powerful, but it is often overused.
Many traders:
- Trade every divergence they see
- Enter before confirmation
- Ignore whether the market is trending strongly
In strong trends, divergence can appear early and persist before any meaningful reversal occurs.
Using Too Many Momentum Indicators at Once
Some traders combine multiple momentum tools expecting confirmation, but this often creates confusion rather than clarity.
The result is:
- conflicting signals
- hesitation in execution
- analysis paralysis
Professional traders typically use a small, defined set of tools and focus on consistency in interpretation.
Ignoring Higher Timeframe Context
Momentum signals on lower timeframes are often misleading without higher timeframe context.
For example:
- A bullish RSI signal on a 15-minute chart may be irrelevant in a strong daily downtrend
- A MACD crossover on a small timeframe may only represent a temporary pullback
Higher timeframe structure always takes priority. Momentum indicators fail when they are used in isolation or treated as predictive tools. PRO crypto traders avoid these mistakes by applying momentum only within a structured market context, supported by price action, key levels, and higher timeframe analysis.
Momentum Trading Strategy Used by PRO Crypto Traders
Professional traders do not rely on momentum indicators in isolation. They use them inside a structured process where market context defines direction and momentum confirms timing. The goal is not to predict the market, but to trade only when multiple conditions align.
Always Identify Market Structure First
The first step is always a structure analysis. Crypto traders determine whether the market is:
- In an uptrend
- In a downtrend
- In a range
This defines the only direction they will consider for trades. Without this step, momentum signals have no directional meaning.
Mark Key Levels
The next step is to identify important zones where reactions are likely from the market.
Key levels include:
- Support and resistance
- Supply and demand zones
- Breakout and retest areas
Momentum signals only become relevant when they occur near these levels.
Wait for Momentum Confirmation
Once structure and levels are defined, traders monitor momentum indicators for confirmation signals such as:
- RSI showing weakening or strengthening pressure
- MACD histogram expansion or contraction
- ADX rising during trend continuation
- Stochastic reversal in ranging conditions
At this stage, momentum is not used to initiate trades, but to validate what price is already doing.
Confirm With Price Action
Before entering, traders wait for clear price behavior that confirms intent. Common confirmations include:
- Break of structure
- Retest of the level
- Strong rejection candle
- Clean continuation move
If the price does not confirm, the setup is ignored regardless of momentum signals.
Execute With Risk Management
Once all conditions align, the trade is executed with strict risk management. Professional traders always define:
- Stop loss based on structure
- Target based on liquidity or key levels
- Position size based on risk percentage
Momentum increases confidence in the setup, but risk control defines survival. A professional momentum trading strategy is not based on indicators alone. It is a structured decision-making process where market structure leads, key levels define context, price action confirms intent, and momentum acts as the final validation layer.
Are Momentum Indicators Reliable in Crypto Trading?
Momentum indicators are reliable in crypto trading, but only when they are used within a structured framework. Their effectiveness depends entirely on context, not on the indicator itself.
In isolation, momentum indicators can be misleading. The crypto market often remains overextended, trends aggressively, and reacts sharply to liquidity shifts. In these conditions, simple overbought or oversold readings are not enough to justify trading decisions.
When are Momentum Indicators Reliable?
Momentum indicators perform well when they are aligned with:
- Clear market structure
- Key support and resistance levels
- Confirmed price action behavior
- Supporting volume conditions
In these situations, momentum helps confirm whether the market has enough strength to continue or enough weakness to reverse. For example, a bullish RSI divergence at a major support zone carries far more weight than the same signal in the middle of a trend.
When Momentum Indicators Fail?
Momentum indicators become unreliable when:
- They are used as standalone entry signals
- Market structure is unclear or choppy
- There is no confirmation from price action
- Traders ignore the higher timeframe context
In these conditions, momentum readings often produce false signals or premature entries.
The Reality of Momentum in Crypto
Momentum does not predict the market. It reflects current conditions of strength or weakness.
This means:
- Strong trends can remain overbought for long periods
- Weak trends can remain oversold without reversing
- Divergences can appear early and persist before the price reacts
Professional traders understand this and avoid reacting to momentum in isolation. Momentum indicators are reliable only when used as confirmation tools within a complete trading framework. Their true value is not in predicting reversals or entries, but in validating whether price movement is supported by real market strength or weakening participation.
Conclusion
Momentum indicators are among the most valuable tools in crypto trading because they help traders measure the strength behind price movements rather than focusing solely on direction. However, momentum indicators are not standalone trading systems. RSI, MACD, Stochastic Oscillator, and ADX become truly effective only when combined with market structure, key levels, volume analysis, and price action confirmation.
For traders who understand how to apply momentum within a structured trading framework, these indicators can significantly improve trade selection, timing, and overall decision-making.
At ParadiseFamilyVIP🎖️, traders learn how to integrate momentum analysis into a complete professional trading methodology. From understanding market structure and liquidity to using confirmation-based entries and disciplined risk management, the focus is always on developing consistency and long-term trading performance.
👉 Join ParadiseFamilyVIP🎖️ to learn how professional traders combine momentum, market structure, and risk management to navigate crypto markets with confidence and precision.
Momentum indicators FAQ
What do momentum indicators measure in crypto trading?
They measure the rate of change in price, quantifying the strength behind an existing move rather than predicting direction. Rising momentum suggests continuation, while declining momentum often signals exhaustion and a higher risk of reversal.
What is the difference between RSI and MACD?
RSI focuses on momentum extremes, flagging overbought readings above 70 and oversold readings below 30 on a 0 to 100 scale. MACD measures the relationship between two moving averages, helping you assess both momentum and trend strength through its line, signal line, and histogram.
When is the Stochastic Oscillator most effective?
The Stochastic Oscillator performs best in ranging markets where price moves between support and resistance. In strong trends it can stay overbought or oversold for long periods, which reduces the reliability of its reversal signals.
What does the ADX indicator tell you?
ADX measures the strength of a trend without indicating whether the market is bullish or bearish. A reading below 20 suggests a weak or ranging market, 20 to 25 marks a developing trend, and above 25 points to a strong trend.
Crypto trading involves substantial risk of loss. This article is educational and is not financial advice. Past performance does not guarantee future results. Always do your own research.
What is different here
Most guides stop at the theory. The MyCryptoParadise team shares the live trades, and the reasoning behind each one, inside ParadiseFamilyVIP. Everything here is education, not financial advice.
Crypto trading involves substantial risk and is not suitable for everyone. Nothing here is financial advice; it is education only. Never risk more than you can afford to lose.


Join the discussion
No comments yet. Pro Paradiser members, share how you are reading this.