Bullish divergences are powerful tools to identify potential buying opportunities in the crypto market. By understanding and applying the principles of bullish divergences, you can enhance your ability to spot trend reversals and improve your trading performance. In this article, we will explore how to trade various bullish divergences based on their levels, offering practical insights and techniques for both novice and experienced crypto traders.
We will discuss different types of bullish divergences, explain how to identify them and discuss the significance of their levels in making informed trading decisions. By the end of this article, you will have a comprehensive understanding of how to trade bullish divergences effectively.
Let’s jump right into it:
What are Bullish Divergences?
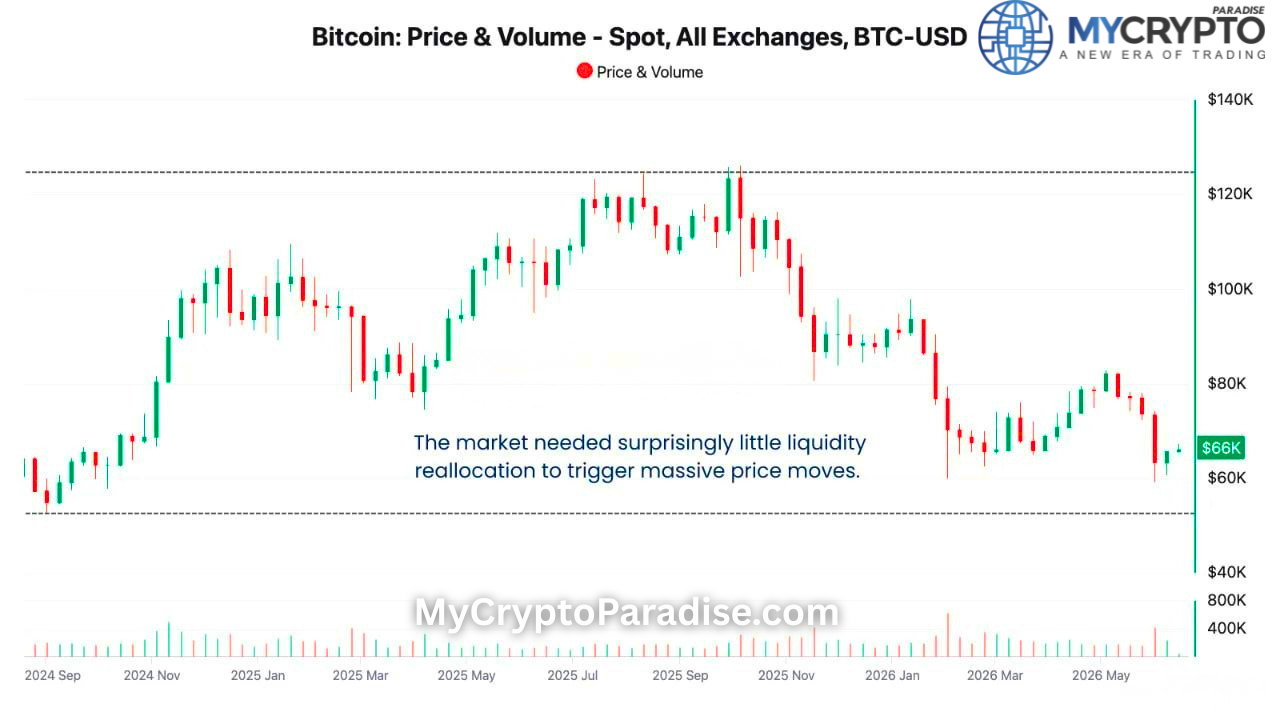
Bullish divergences are powerful patterns in technical analysis that suggest a potential reversal in a downtrend. These divergences occur when the price of an asset makes lower lows, but a technical indicator, such as the Relative Strength Index (RSI) or the Moving Average Convergence Divergence (MACD), makes higher lows.

This discrepancy indicates that while the price is still declining, the downward momentum is weakening and a potential upward reversal is on the horizon.
Types of Bullish Divergences
Bullish divergences come in various forms, each offering unique insights into potential market reversals. Understanding the different types of bullish divergences is essential for traders aiming to capitalize on price movements. We divide divergences into three main classes:
Class A: High-Strength Bullish Divergences
These divergences are highly reliable and often signal strong potential reversals. They are the most trusted by traders, especially when spotted after prolonged downtrends.
- Classic Bullish Divergence
- Extended Bullish Divergence
Class B: Medium-Strength Bullish Divergences
These divergences are reliable but may require more careful analysis and additional confirmation due to their complexity or less frequent occurrence.
- Exaggerated Bullish Divergence
- Hidden Bullish Divergence
Class C: Low-Strength
These divergences are less reliable and often require additional context or multiple confirmations before being used as trading signals. More experienced traders use them effectively.
- Complex Bullish Divergence
Class A: High-Strength Bullish Divergences
As we have discussed before, Class A Bullish divergences are best known for their strong potential reversals. Let’s discuss its further types:
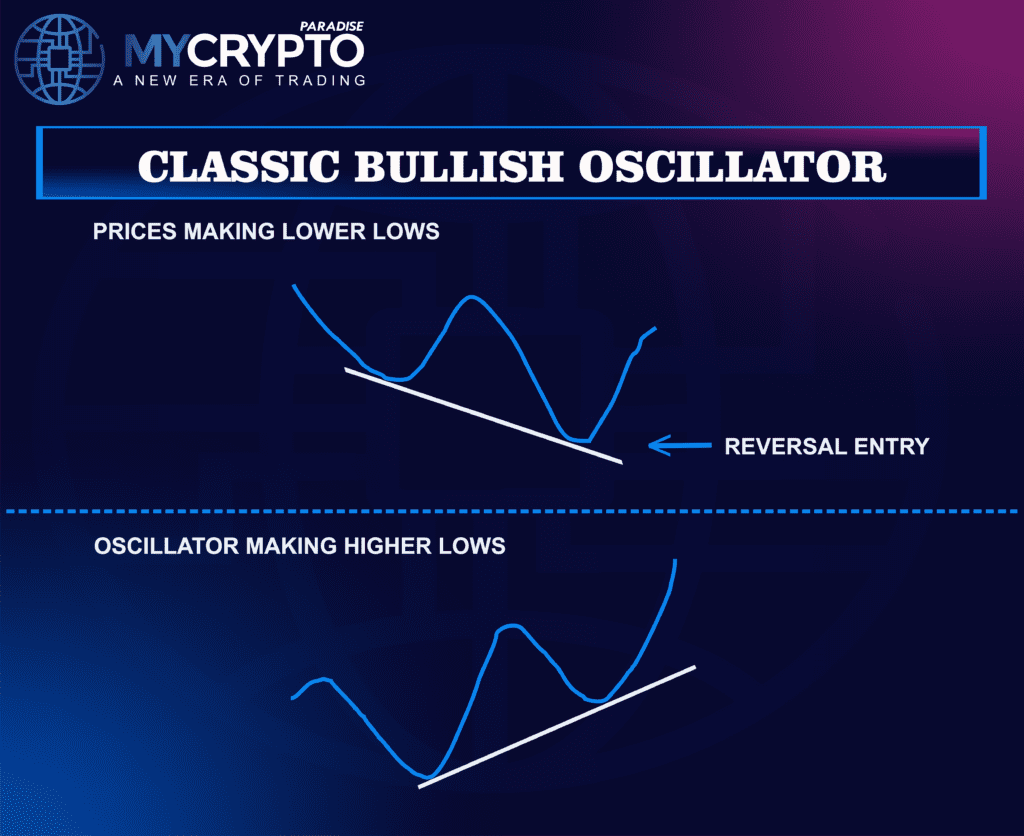
What is Classic Bullish Divergence?
Classic bullish divergence is the strongest type of bullish divergence with a high probability of success. It occurs when the price of an asset makes a new low, but an oscillator—such as the Relative Strength Index (RSI), Moving Average Convergence Divergence (MACD), or the Stochastic Oscillator—makes a higher low.
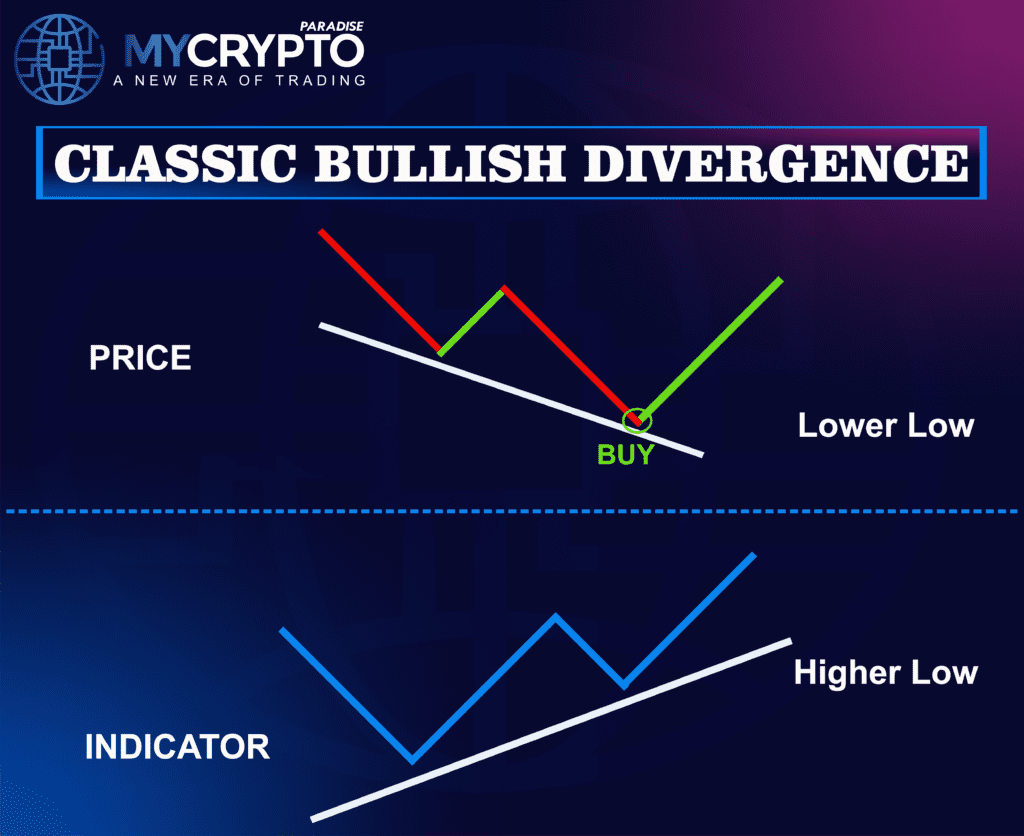
This pattern tells you that while the price continues to drop the bearish momentum is weakening. In simpler terms, the sellers might be running out of steam, and a potential reversal to the upside could be on the horizon.
How to Spot Classic Bullish Divergence
Identifying a classic bullish divergence isn’t as daunting as it might sound. With a bit of practice, you can spot these patterns and use them to inform your trading decisions. Let’s break down how you can identify this powerful signal using popular indicators.
Using the RSI (Relative Strength Index)
The RSI is a momentum oscillator that ranges between 0 and 100. It helps you gauge the speed and change of price movements, typically used to identify overbought or oversold conditions. Here’s how you can spot a classic bullish divergence with the RSI:
- Look for Lower Lows in Price: Start by observing the price action on your chart. Identify a point where the price makes a lower low compared to a previous low.
- Check the RSI for Higher Lows: Next, look at the RSI. While the price is making lower lows, the RSI should be making higher lows. This discrepancy between the price and the RSI is your classic bullish divergence.
- Wait for Confirmation: Before you act, make sure the RSI starts moving upward after forming the higher low. This movement serves as confirmation that the divergence is valid and a potential reversal could be underway.
Using the MACD (Moving Average Convergence Divergence)
The MACD is a trend-following momentum indicator that illustrates the relationship between two moving averages of an asset’s price. Here’s how you can spot a classic bullish divergence using the MACD:
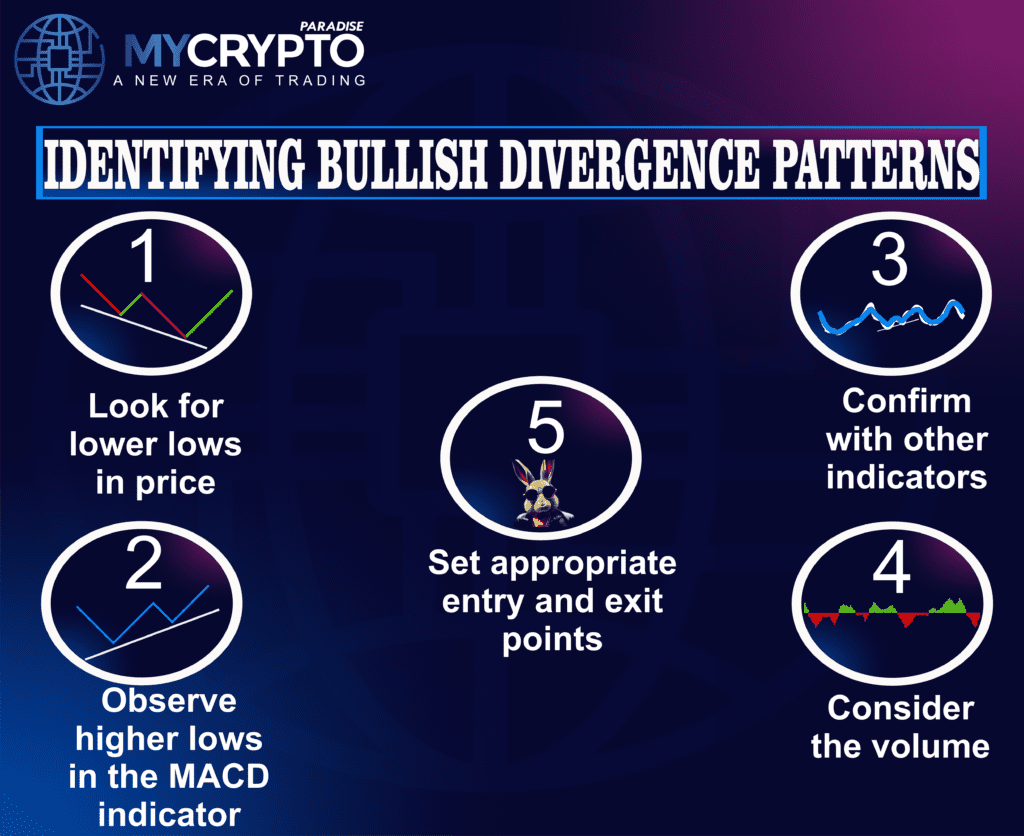
- Identify Lower Lows in Price: Begin by locating a series of lower lows in the price chart.
- Observe the MACD Line or Histogram: While the price is declining, the MACD line or histogram should be forming higher lows. This divergence indicates that the bearish momentum is weakening.
- Confirmation: Wait for the MACD line to cross above the signal line or for the histogram to start ticking upwards. This confirms that the divergence is likely to lead to a bullish reversal.
Using the Stochastic Oscillator
The Stochastic Oscillator compares a particular closing price to a range of its prices over a certain period. It’s another great tool for spotting classic bullish divergences:
- Find Lower Lows in Price: Just like before, start by identifying lower lows in the price action.
- Check the Stochastic Oscillator for Higher Lows: While the price makes lower lows, the Stochastic Oscillator should be making higher lows. This is your classic bullish divergence.
- Wait for the Oscillator to Move Up: Before entering a trade, wait for the Stochastic Oscillator to start moving upward after forming the higher low. This movement confirms the divergence and the potential for a price reversal.
Trading Strategy: How to Put Classic Bullish Divergence to Work?
Now that you know how to spot a classic bullish divergence, it’s time to talk about how you can use this pattern in your trading strategy. Let’s break it down into actionable steps:
Entry Point:
Once you’ve identified a classic bullish divergence, the next step is to determine the right moment to enter the trade. The best time to enter is when the oscillator (whether it’s RSI, MACD, or Stochastic) confirms the divergence by starting to move upward. Essentially, you want to catch the early stages of the potential reversal.
For example, if the price of an asset has been making lower lows and the RSI forms a higher low, you should wait until the RSI begins to rise before entering a long position. This way, you’re entering the trade with confirmation that the momentum is shifting in your favor.
Stop Loss:
Even the best setups can sometimes fail, which is why it’s crucial to protect your capital by setting a stop loss. A stop loss is essentially a predetermined price level where you’ll exit the trade if it moves against you.
For a classic bullish divergence, a good place to set your stop loss is just below the recent low. For instance, if the price made a low of $50 and you enter a trade as it starts to rise, you might set your stop loss slightly below $50—perhaps at $48. This placement allows you some room for normal market fluctuations while protecting you from significant losses if the trade doesn’t go as planned.
Take Profit:
When it comes to setting a take-profit target, there are a couple of strategies you can use. One approach is to aim for previous resistance levels—points on the chart where the price has struggled to move higher in the past. These levels often serve as natural targets for profit-taking.
Another approach is to use a risk-reward ratio. For example, you might decide on a risk-reward ratio of 1:2 or 1:3. If your stop loss is $2 below your entry price, you’d aim for a take profit of $4 or $6 above your entry price, respectively. This method ensures that your potential reward outweighs your risk, which is key to long-term trading success.
Why Classic Bullish Divergence Stands Out?
Classic bullish divergence is highly valued among traders because it provides a clear signal of a potential reversal. Here’s why it’s such a prominent tool in your trading arsenal:
- Clear Signal of Weakening Bearish Momentum: When you see a classic bullish divergence, it’s a strong indication that the sellers are losing control. Even though the price continues to drop, the fact that the oscillator is forming higher lows tells you that the downward momentum is fading.
- Easy to Identify: With a bit of practice, spotting a classic bullish divergence becomes second nature. The pattern is straightforward: lower lows in price coupled with higher lows in the oscillator. This simplicity makes it accessible to traders of all experience levels.
- Reliable Indicator: While no indicator is foolproof, classic bullish divergence has a strong track record of predicting price reversals. It’s a pattern that many traders trust, especially when confirmed by other technical signals or market conditions.
- Versatility Across Markets: Whether you’re trading stocks, forex, commodities, or cryptocurrencies, classic bullish divergence is a versatile tool. It’s effective across different markets and timeframes, making it a valuable addition to your trading strategy.
Practical Tips for Trading Classic Bullish Divergence
Now that you understand the basics of trading classic bullish divergence, here are a few additional tips to help you make the most of this pattern:
- Combine with Other Indicators: While classic bullish divergence is powerful on its own, combining it with other technical indicators can increase your chances of success. For instance, using trendlines, moving averages, or Fibonacci retracements can provide additional confirmation and help you refine your entry and exit points.
- Analyze Multiple Timeframes: Sometimes, divergences on a smaller timeframe can lead to false signals. To increase the reliability of your trades, consider analyzing multiple timeframes. If you spot a classic bullish divergence on both the daily and hourly charts, for example, the chances of a successful trade are higher.
- Be Patient: Patience is key when trading divergences. Wait for confirmation before entering a trade. It’s tempting to jump in as soon as you spot a divergence, but waiting for the oscillator to start moving upwards after forming a higher low can make all the difference between a successful trade and a losing one.
- Practice and Backtest: Like any trading strategy, the more you practice spotting and trading classic bullish divergences, the better you’ll become. Use historical price data to backtest your strategy and see how it would have performed in the past. This practice will help you refine your approach and build confidence in your trading decisions.
In the next sections, we’ll explore other types of bullish divergences and how you can incorporate them into your trading strategy to achieve even better results.
What is Extended Bullish Divergence?
Extended bullish divergence is a less common but powerful variation of the classic bullish divergence. It occurs over a more prolonged period, often spanning several weeks or months, and typically signals a significant upcoming reversal. This divergence is marked by the price making a series of lower lows while the oscillator forms higher lows over an extended timeframe. The extended nature of this divergence suggests that while the bearish momentum has persisted for some time, it is gradually weakening, setting the stage for a potentially strong bullish reversal.
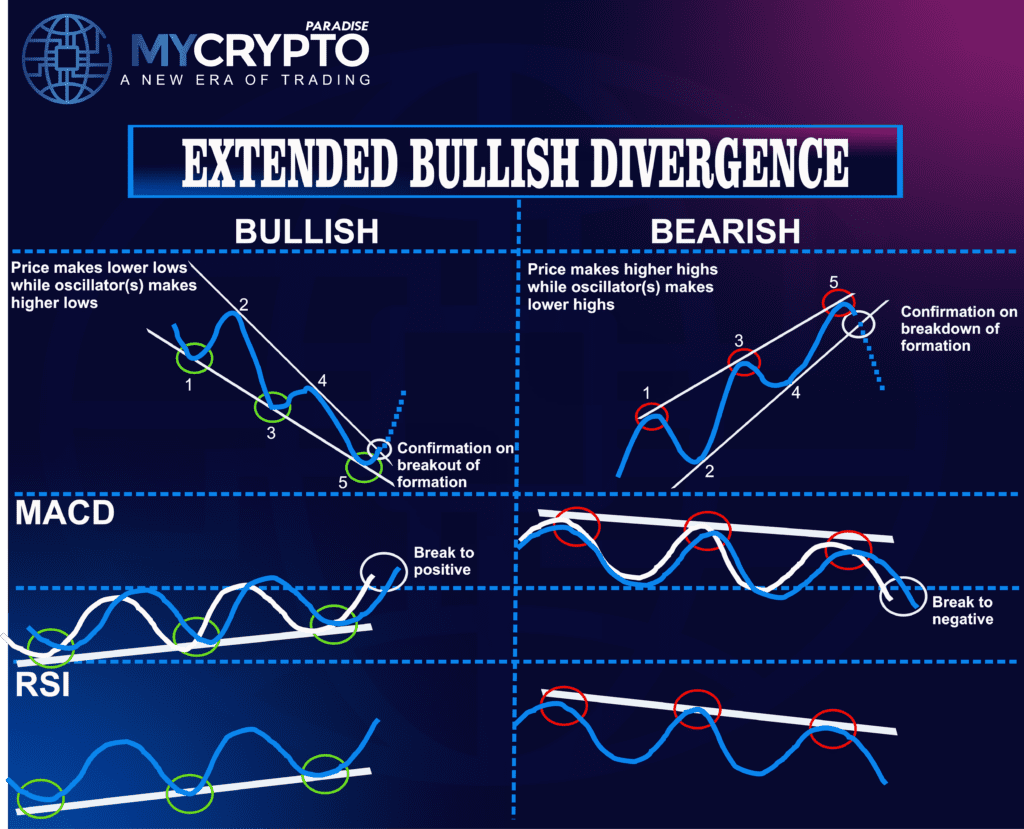
In terms of strength and reliability, extended bullish divergence is highly regarded, particularly in longer-term trading and investing. It’s often observed after prolonged downtrends and can signal the beginning of a significant new uptrend. Because it develops over a longer period, extended bullish divergence tends to produce fewer false signals compared to shorter-term divergences, making it a trusted indicator for those looking to capture major market turns.
How to Spot Extended Bullish Divergence
Identifying extended bullish divergence requires patience and a focus on the long-term trends. Here’s how you can spot this powerful pattern using various technical indicators.
Using the RSI (Relative Strength Index)
The RSI is particularly effective for identifying extended bullish divergence, especially on longer timeframes:
- Identify a Series of Lower Lows in Price: First, observe the price action over a longer period (e.g., daily, weekly charts) and identify a series of lower lows. This pattern should develop over several weeks or months, indicating a persistent downtrend.
- Look for a Series of Higher Lows in the RSI: While the price makes lower lows, the RSI should form higher lows over the same period. This divergence suggests that the bearish momentum is weakening, even though the price continues to decline.
- Confirmation: Once the RSI starts moving upward after the extended period of divergence, this confirms the extended bullish divergence and suggests that a significant bullish reversal is on the horizon.
Using the MACD
The MACD is also useful for spotting extended bullish divergence, particularly on longer timeframes:
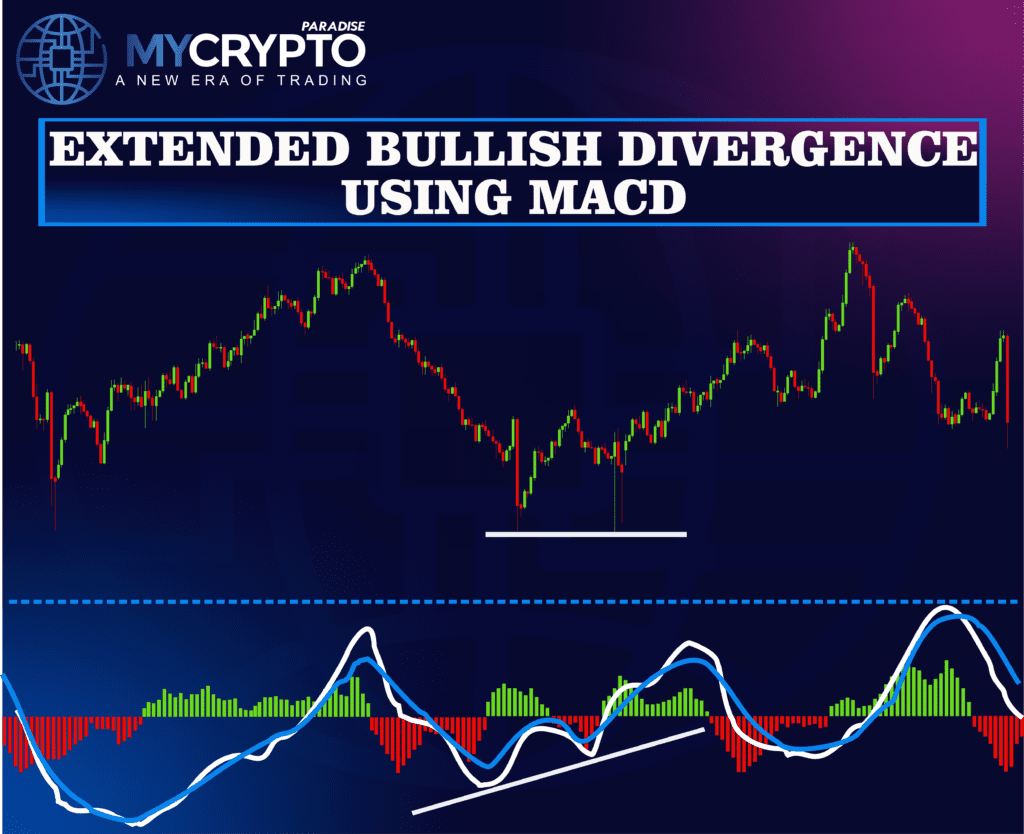
- Check for a Series of Lower Lows in Price: Look for a prolonged downtrend where the price makes lower lows over several weeks or months.
- Observe a Series of Higher Lows in the MACD Line or Histogram: During this period, the MACD line or histogram should be forming higher lows. This divergence indicates that, despite the extended downtrend, the bearish momentum is losing steam.
- Confirmation: Wait for the MACD line to cross above the signal line or for the histogram to tick upwards, confirming the extended bullish divergence and signaling a potential bullish reversal.
Using the Stochastic Oscillator
The Stochastic Oscillator can also help you identify extended bullish divergence on longer timeframes:
- Find a Series of Lower Lows in Price: Identify a downtrend where the price consistently makes lower lows over an extended period.
- Check for a Series of Higher Lows in the Stochastic Oscillator: While the price is trending downward, the Stochastic Oscillator should be forming higher lows, indicating a weakening downtrend.
- Wait for the Oscillator to Turn Up: Once the Stochastic Oscillator starts rising after the prolonged period of divergence, it confirms the extended bullish divergence and the likelihood of a strong bullish reversal.
Class B: Medium-Strength Bullish Divergences
Let’s look at the further types of the Class B divergences:
What is Hidden Bullish Divergence?
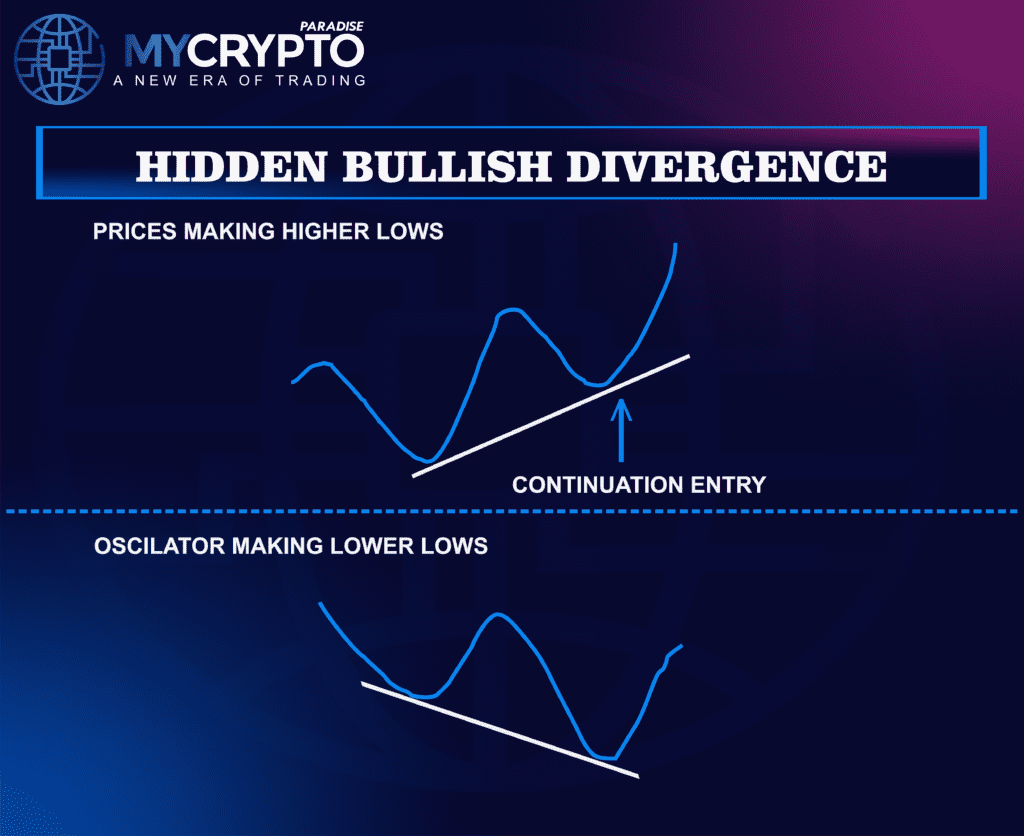
Hidden bullish divergence is another powerful tool in the technical analyst’s arsenal, though it tends to be less well-known compared to the classic bullish divergence. Unlike the classic version, which signals a potential reversal, hidden bullish divergence is typically a continuation signal. This means that rather than indicating the end of a downtrend, hidden bullish divergence suggests that the current uptrend is likely to continue, even if the price has pulled back temporarily.
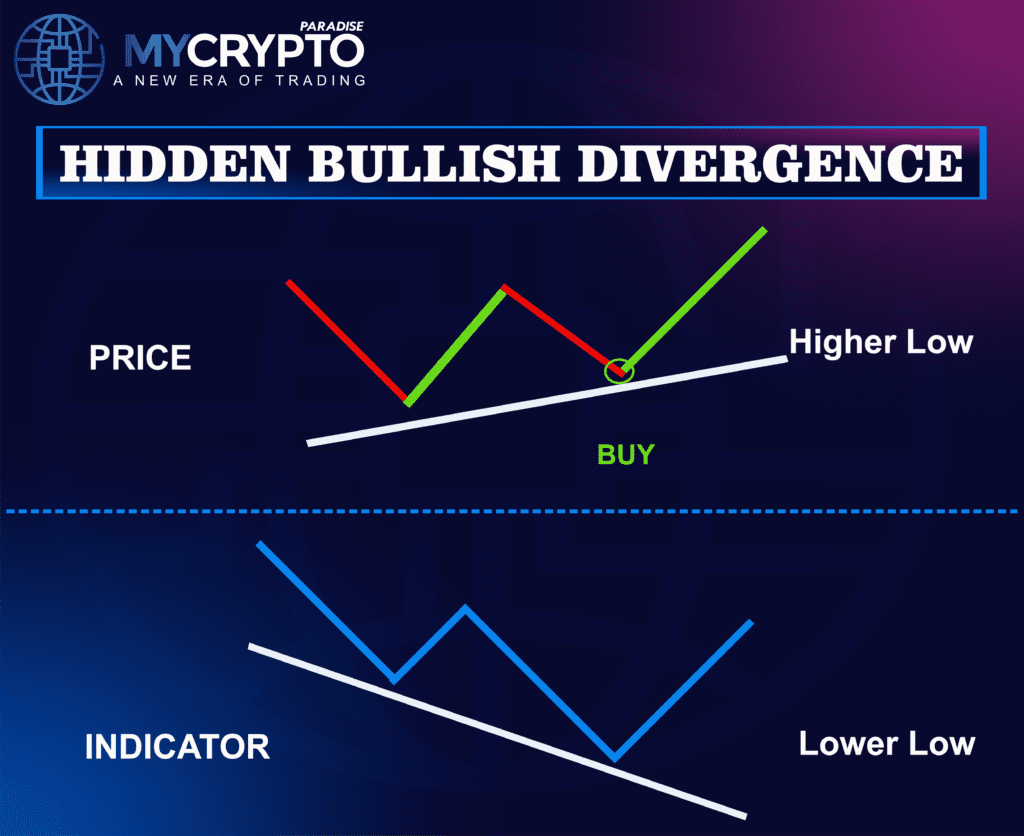
Here’s how it works: Hidden bullish divergence occurs when the price makes a higher low, but the oscillator (such as the RSI, MACD, or Stochastic Oscillator) makes a lower low. This pattern indicates that while the price is maintaining its overall uptrend structure, the pullback has temporarily increased the bearish momentum. However, this bearish momentum is likely to be short-lived, and the uptrend should resume.
In terms of strength, hidden bullish divergence is highly reliable, particularly when it comes to trend continuation. It’s a favorite among trend traders because it allows you to enter a trade or add to an existing position with the expectation that the current trend will persist.
How to Spot Hidden Bullish Divergence
Identifying hidden bullish divergence requires careful attention to the relationship between the price and the oscillator. Let’s dive into how you can spot this pattern using some of the most popular technical indicators.
Using the RSI
The RSI is a handy tool for spotting hidden bullish divergence. Here’s how you can use it:
- Identify Higher Lows in Price: First, observe the price action and identify a point where the price makes a higher low compared to a previous low. This higher low should occur within the context of an overall uptrend.
- Look for Lower Lows in the RSI: While the price is making a higher low, check the RSI. The RSI should be making a lower low, indicating that the pullback has increased bearish momentum temporarily.
- Confirmation: Wait for the RSI to start rising after forming the lower low. This confirms that the bearish pressure is weakening and that the uptrend is likely to resume.
Using the MACD
The MACD is another excellent indicator for spotting hidden bullish divergence. Here’s how you can identify it:
- Check for Higher Lows in Price: Begin by spotting higher lows in the price action, consistent with an ongoing uptrend.
- Observe Lower Lows in the MACD Line or Histogram: While the price makes higher lows, the MACD line or histogram should form lower lows. This divergence suggests that the selling pressure during the pullback is temporary.
- Confirmation: Wait for the MACD line to cross above the signal line or for the histogram to start ticking upwards. This indicates that the uptrend is likely to continue.
Using the Stochastic Oscillator
The Stochastic Oscillator can also help you identify hidden bullish divergence:
- Find Higher Lows in Price: Identify points on the chart where the price makes higher lows, indicating an uptrend.
- Check for Lower Lows in the Stochastic Oscillator: As the price makes higher lows, the Stochastic Oscillator should be forming lower lows. This discrepancy signals a potential continuation of the uptrend.
- Wait for the Oscillator to Turn Up: Before making your move, wait for the Stochastic Oscillator to start rising after forming the lower low. This confirms that the uptrend is likely to resume.
How to Trade Hidden Bullish Divergence?
Once you’ve spotted a hidden bullish divergence, the next step is to translate this insight into a practical trading strategy. Here’s how you can do it:
Entry Point:
The best time to enter a trade based on hidden bullish divergence is when the oscillator starts to move upward after forming the lower low. This movement confirms that the pullback is likely over and the uptrend is set to resume.
For example, suppose you’re tracking a crypto that’s been in an uptrend. The price recently made a higher low at $100, while the RSI made a lower low. Once the RSI begins to rise, you’d enter a long position with the expectation that the uptrend will continue.
Stop Loss:
Even though hidden bullish divergence is a reliable signal, it’s essential to protect yourself in case the trend fails to continue. To manage your risk, set a stop loss just below the higher low in price.
In our previous example, if the higher low in price was $100, you might set your stop loss slightly below this level—perhaps at $98. This way, if the price unexpectedly reverses and breaks below the higher low, your loss is limited.
Take Profit:
When setting a take profit target, you can aim for the next significant resistance level. Alternatively, you could use a risk-reward ratio to determine your take profit target. If your stop loss is $2 below your entry price, you might set a take profit target that’s $4 or $6 above your entry price, depending on your risk-reward ratio.
For example, if you enter the trade at $102 with a stop loss at $98, you could set your take profit at $106 or $108, depending on your preferred risk-reward ratio.
How Prominent is Hidden Bullish Divergence?
Hidden bullish divergence is particularly prominent among trend traders for several reasons:
- Supports Trend Continuation: Unlike classic bullish divergence, which signals a potential reversal, hidden bullish divergence suggests that the current trend will continue. This makes it a valuable tool for traders who prefer to trade with the trend rather than against it.
- Reliable Signal: Hidden bullish divergence is considered highly reliable, especially when it occurs in a strong uptrend. It’s a clear indication that the pullback is temporary and that the bullish momentum will likely resume.
- Less False Signals: Because hidden bullish divergence aligns with the existing trend, it tends to produce fewer false signals compared to other divergence patterns. This makes it a trusted signal for traders who want to minimize their risk.
- Versatility Across Assets: Like classic bullish divergence, hidden bullish divergence can be used across various markets and timeframes. Whether you’re trading stocks, forex, commodities, or cryptocurrencies, hidden bullish divergence is a versatile tool that can help you stay on the right side of the trend.
Practical Tips for Trading Hidden Bullish Divergence
To get the most out of hidden bullish divergence, consider these practical tips:
- Combine with Trend Indicators: Since hidden bullish divergence is a trend continuation signal, combining it with trend indicators like moving averages or trendlines can enhance your confidence in the trade. For example, if you spot a hidden bullish divergence and the price is also above a key moving average, it’s a strong signal that the uptrend will continue.
- Analyze Higher Timeframes: While hidden bullish divergence is effective on any timeframe, analyzing higher timeframes can give you a better sense of the overall trend strength. If you see hidden bullish divergence on a daily chart, for example, it’s more significant than on a 15-minute chart.
- Be Mindful of Market Conditions: Hidden bullish divergence works best in trending markets. If the market is choppy or ranging, the signal may be less reliable. Always consider the broader market conditions before acting on a hidden bullish divergence.
- Practice Discipline: As with any trading strategy, discipline is key. Wait for confirmation before entering a trade and stick to your stop loss and take profit levels. Emotional trading can lead to poor decisions, so always approach hidden bullish divergence with a clear plan.
In the following sections, we’ll delve into other types of bullish divergences and discuss how you can use them to enhance your trading strategy even further.
What is Exaggerated Bullish Divergence?
Exaggerated bullish divergence, also known as “reverse divergence,” is a less common but equally important type of divergence that traders use to spot potential trend reversals. Unlike classic or hidden bullish divergence, exaggerated bullish divergence occurs when the price forms a double bottom or nearly equal lows, while the oscillator (such as the RSI, MACD, or Stochastic Oscillator) forms higher lows. This pattern signals that although the price has reached a similar low point, the underlying bearish momentum is weakening, increasing the likelihood of a bullish reversal.
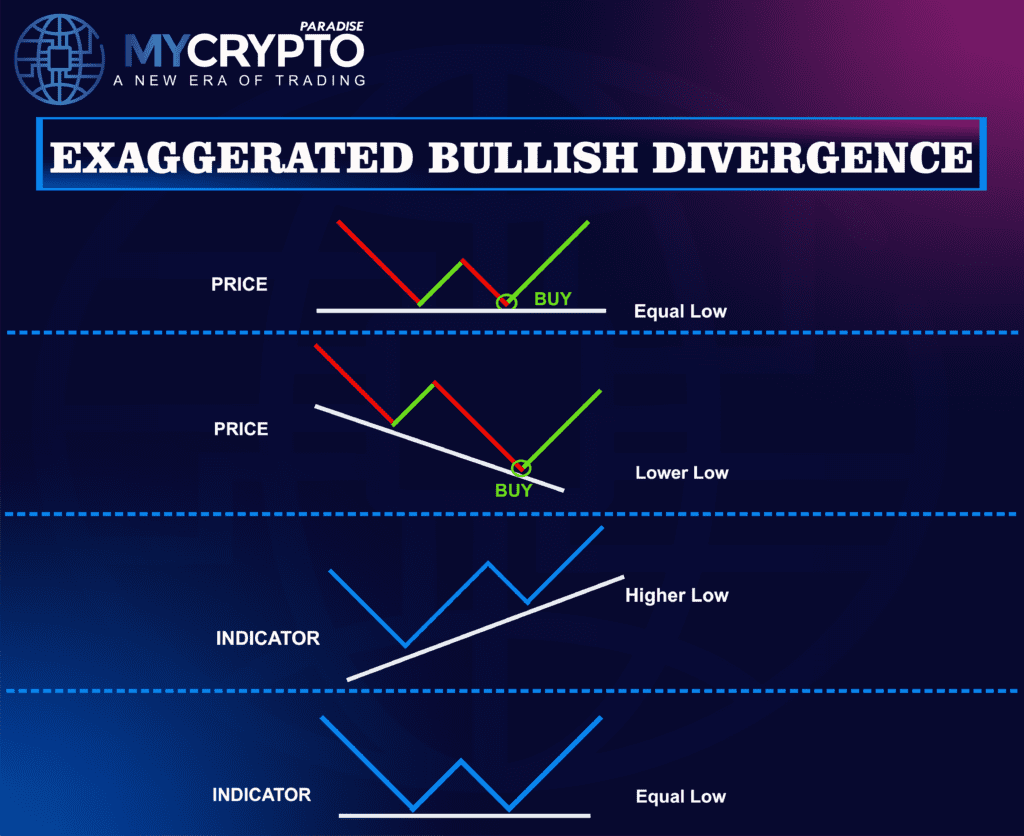
In terms of strength, exaggerated bullish divergence tends to be a strong indicator of a reversal, particularly when it forms after an extended downtrend. This pattern can often mark the end of a prolonged bearish phase, signaling that buyers are starting to regain control. While not as frequently discussed as classic or hidden divergences, exaggerated bullish divergence can be a powerful tool when you understand how to spot and trade it.
How to Spot Exaggerated Bullish Divergence?
Spotting exaggerated bullish divergence involves carefully comparing the price action with the behavior of the oscillator. Let’s explore how you can identify this pattern using some popular technical indicators.
Using the RSI
The RSI is particularly useful for identifying exaggerated bullish divergence. Here’s how you can spot it:
- Identify Equal Lows in Price: Begin by observing the price action and look for a situation where the price forms a double bottom or nearly equal lows. This pattern indicates that the price has tested a support level twice.
- Look for Higher Lows in the RSI: While the price forms these equal lows, the RSI should be making higher lows. This indicates that the bearish momentum is diminishing, even though the price hasn’t dropped further.
- Confirmation: Once the RSI starts moving upward after forming the higher low, this confirms the exaggerated bullish divergence and suggests a potential bullish reversal.
Using the MACD
The MACD is another excellent tool for spotting exaggerated bullish divergence:
- Check for Equal Lows in Price: Look for points on the chart where the price makes equal lows, indicating that the price is holding a particular support level.
- Observe Higher Lows in the MACD Line or Histogram: While the price remains flat at these lows, the MACD line or histogram should form higher lows, signaling that the bearish pressure is fading.
- Confirmation: Wait for the MACD line to cross above the signal line or for the histogram to tick upwards. This confirms the exaggerated bullish divergence and indicates that a bullish reversal is likely.
Using the Stochastic Oscillator
The Stochastic Oscillator is also effective in identifying exaggerated bullish divergence:
- Find Equal Lows in Price: Start by identifying points where the price forms equal lows, suggesting that a support level is being tested.
- Check for Higher Lows in the Stochastic Oscillator: While the price remains steady, the Stochastic Oscillator should be forming higher lows. This divergence suggests that the downtrend is losing steam.
- Wait for the Oscillator to Move Up: Once the Stochastic Oscillator begins to rise after forming higher lows, it confirms the exaggerated bullish divergence and the likelihood of a bullish reversal.
How to Trade Exaggerated Bullish Divergence?
Once you’ve identified an exaggerated bullish divergence, it’s essential to have a clear trading strategy to capitalize on the potential reversal. Here’s how you can approach trading this pattern:
Entry Point:
The ideal time to enter a trade based on exaggerated bullish divergence is when the oscillator starts to move upwards after confirming the divergence. This upward movement signals that the bearish momentum has faded and that a bullish reversal is likely.
For instance, if the price forms a double bottom at $50 and the RSI makes a higher low, you would wait for the RSI to begin rising before entering a long position. This approach allows you to enter the trade with the confirmation that the reversal is underway.
Stop Loss:
Setting a stop loss is crucial when trading exaggerated bullish divergence to protect yourself from unexpected market moves. A good place to set your stop loss is just below the recent low in price.
For example, if the price forms a double bottom at $50, you might set your stop loss slightly below this level, say at $48. This placement helps you manage your risk while allowing for normal market fluctuations.
Take Profit:
When determining your take profit target, consider aiming for previous resistance levels, where the price has struggled to move higher in the past. Alternatively, use a risk-reward ratio to set your target. For example, if your stop loss is $2 below your entry price, aim for a take profit target that’s $4 or $6 above your entry price, depending on your desired risk-reward ratio.
If you enter the trade at $52 with a stop loss at $48, you could set your take profit at $56 or $58, depending on your trading strategy.
What’s the Reliability of Exaggerated Bullish Divergence?
Exaggerated bullish divergence stands out as a powerful reversal signal for several reasons:
- Strong Reversal Indicator: Unlike hidden bullish divergence, which signals trend continuation, exaggerated bullish divergence is a robust indicator of a potential reversal. This makes it especially useful after a prolonged downtrend.
- Reliable in Key Support Areas: Exaggerated bullish divergence is often found at significant support levels, where the price has tested and held a certain level multiple times. This reliability makes it a trusted signal for traders looking to capitalize on reversals.
- Clear and Distinct Pattern: The pattern of equal lows in price combined with higher lows in the oscillator is relatively easy to spot, making it accessible even to traders who are still honing their skills.
- Versatility Across Markets: As with other types of divergences, exaggerated bullish divergence is applicable across various markets, including stocks, forex, commodities, and crypto market. Its versatility makes it a valuable tool for traders in different asset classes.
Practical Tips for Trading Exaggerated Bullish Divergence
To maximize your success when trading exaggerated bullish divergence, keep these tips in mind:
- Combine with Support and Resistance Levels: Exaggerated bullish divergence is particularly powerful when it coincides with key support levels. Combining this divergence with horizontal support lines, trendlines, or Fibonacci retracement levels can increase the reliability of the signal.
- Use Multiple Timeframes: To confirm the strength of an exaggerated bullish divergence, analyze the pattern across multiple timeframes. A divergence that appears on both the daily and weekly charts, for example, carries more weight than one that only appears on a 15-minute chart.
- Watch for Market Sentiment: While exaggerated bullish divergence is a technical pattern, it’s important to consider the broader market sentiment. If the market is generally bullish, a divergence at a key support level can be an even stronger signal.
- Practice Patience: As with other divergence patterns, patience is key. Wait for confirmation before entering a trade, and avoid the temptation to jump in too early. A well-timed entry can make all the difference in your trading success.
Class C: Low-Strength Bullish Divergences
Let’s discuss the type of low-strength bullish divergences:
What is Complex Bullish Divergence?
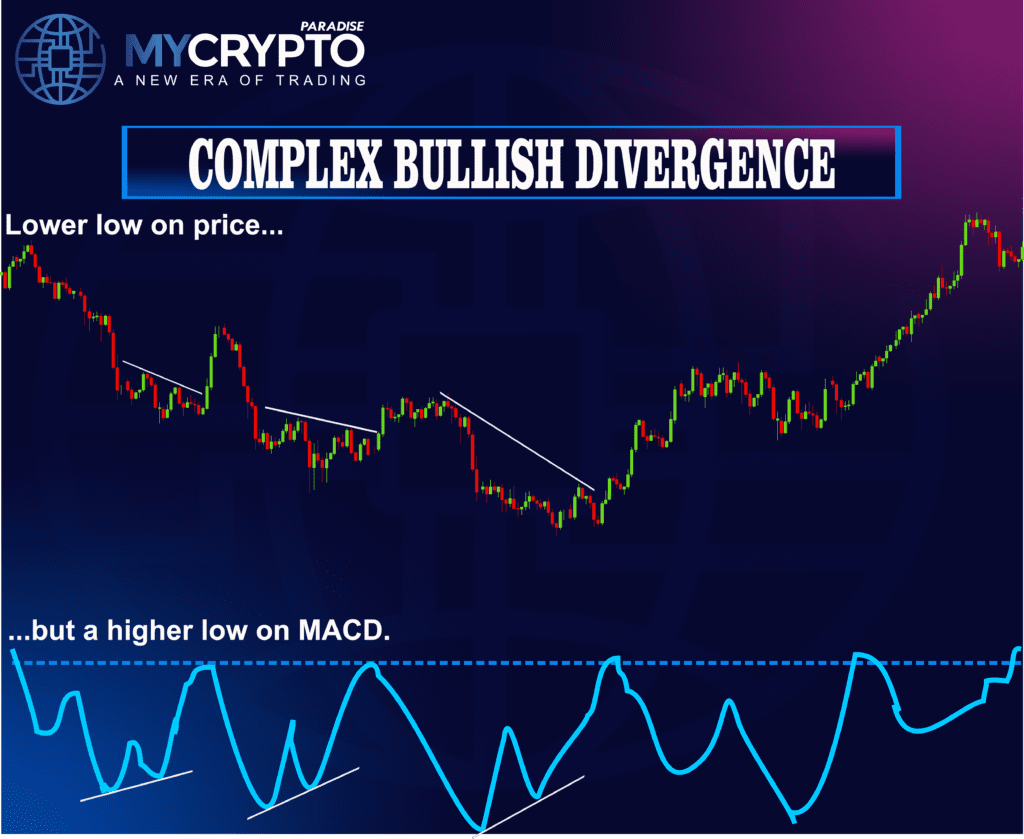
Complex bullish divergence is a variation of the traditional divergence patterns, where the divergence isn’t as straightforward or clear-cut as in the other types. It involves multiple waves of price action and oscillations before the actual divergence is confirmed. Essentially, this divergence occurs when the price makes a series of lower lows with complex oscillations, while the oscillator either makes higher lows or forms a pattern that indicates a divergence over several swings.
Complex bullish divergence is generally considered less reliable and more challenging to trade due to its intricate nature. The pattern often requires a more experienced eye to identify and trade successfully, and it’s typically observed in markets with high volatility or during periods of consolidation. However, when correctly identified, complex bullish divergence can signal a significant reversal, especially when it forms after a prolonged and volatile downtrend.
The strength of this divergence lies in its complexity, which can provide a more nuanced understanding of market sentiment and the potential for a reversal. However, the difficulty in identifying and confirming the pattern means it’s often best suited for advanced traders who are comfortable with more sophisticated technical analysis.
How to Spot Complex Bullish Divergence
Spotting complex bullish divergence requires a keen eye and an understanding of the market’s broader context. Here’s how you can identify this pattern using various technical indicators.
Using the RSI
The RSI can help identify complex bullish divergence, though the pattern may be more intricate than with standard divergences:
- Identify a Series of Lower Lows with Complex Price Action: Look for a price action where the price makes multiple lower lows, but not in a smooth or straightforward manner. The price may exhibit whipsaws, false breakouts, or other irregularities that make the pattern complex.
- Look for Higher Lows or Complex Patterns in the RSI: While the price is making these lower lows, observe the RSI. The RSI may form higher lows or exhibit a complex pattern, such as multiple divergences within a larger structure.
- Confirmation: Once the RSI confirms the divergence by starting to rise after completing its complex pattern, this suggests that the bearish momentum is exhausted, and a bullish reversal is possible.
Using the MACD
The MACD is also effective for identifying complex bullish divergence:
- Check for a Series of Lower Lows with Erratic Price Action: Monitor the price for a pattern of lower lows, but with irregular movements or a lack of clear structure, indicating a complex scenario.
- Observe the MACD for Higher Lows or Complex Divergence Patterns: The MACD line or histogram might not just form higher lows but could display a more intricate pattern, such as multiple crossovers or divergences within a broader trend.
- Confirmation: Wait for the MACD to confirm the divergence by turning upward after the complex pattern completes, signaling a potential bullish reversal.
Using the Stochastic Oscillator
The Stochastic Oscillator can also identify complex bullish divergence, though the pattern may be more subtle:
- Find a Series of Lower Lows with Chaotic Price Movement: Look for chaotic or irregular price action that still results in lower lows, indicative of a complex market environment.
- Check for Higher Lows or Multiple Divergences in the Stochastic Oscillator: The Stochastic Oscillator may form higher lows or exhibit a series of divergences within the same broader structure, pointing to the complex nature of the market.
- Wait for the Oscillator to Rise: Once the Stochastic Oscillator begins to rise after completing its complex pattern, it confirms the complex bullish divergence and suggests a possible bullish reversal.
What Trading Strategy Is Suitable for Complex Bullish Divergence?
Trading complex bullish divergence requires a nuanced approach, given the intricacies involved. Here’s a strategy that can help you effectively trade this pattern:
Entry Point:
The best time to enter a trade based on complex bullish divergence is when the oscillator confirms the divergence after completing its complex pattern. Given the intricate nature of this divergence, it’s crucial to ensure that the pattern has fully developed and that the oscillator is clearly signaling a potential reversal.
For example, if the price has made several erratic lower lows and the RSI has formed a complex pattern of higher lows, wait for the RSI to start rising clearly before entering a long position.
Stop Loss:
In volatile or complex market environments, setting a stop loss is even more critical. Place your stop loss below the recent low in price, but give it enough room to account for the increased volatility or irregular price action.
For instance, if the price’s recent low was $45 after a series of erratic moves, you might set your stop loss slightly below this level—perhaps at $43. This placement helps protect your position while allowing for some market noise.
Take Profit:
When setting your take profit target, consider the potential for continued volatility. Aim for key resistance levels or use a risk-reward ratio that accounts for the market’s complexity.
For example, if your entry price is $47 with a stop loss at $43, you could set your take profit target at $52 or $54, depending on your risk-reward strategy. You can join us at ParadiseFamilyVIP 🎖️ if you want to start your professional crypto trading journey.
The Challenges and Opportunities of Complex Bullish Divergence
Complex bullish divergence is a nuanced signal that offers both challenges and opportunities:
- Advanced Signal: Complex bullish divergence is more suited to experienced traders due to the difficulty in identifying and confirming the pattern.
- Indicates Market Exhaustion: This pattern often appears when the market is in a state of exhaustion, signaling that a significant reversal may be on the horizon.
- Higher Risk, Higher Reward: The complexity of this divergence means it often appears in more volatile markets, offering the potential for larger moves but also greater risk.
- Requires Patience and Skill: Successfully trading complex bullish divergence requires patience and a deep understanding of market dynamics, making it a tool for more PRO traders.
Practical Tips for Trading Complex Bullish Divergence
Here are some practical tips to help you navigate the complexities of trading this divergence:
- Use Multiple Indicators: Given the intricacies of complex bullish divergence, combining it with other technical indicators like volume, trendlines, or moving averages can provide additional confirmation.
- Be Patient: Wait for the pattern to fully develop and for the oscillator to confirm the divergence before entering a trade. Premature entries can lead to losses in such complex setups.
- Focus on Long-Term Trends: Complex bullish divergence is often more reliable on longer timeframes, where the market has had time to fully develop its pattern.
- Stay Disciplined: Stick to your trading plan, and don’t let the complexity of the pattern lure you into overtrading or taking excessive risks.
Complex bullish divergence is a sophisticated pattern that, while challenging to identify, can offer significant trading opportunities in volatile or complex market environments.
Final Thoughts
Mastering the art of trading bullish divergences can be a game-changer in your trading strategy. Whether you’re identifying a classic divergence or spotting a more complex pattern that requires a deeper understanding of market dynamics, each type of divergence offers unique insights into market sentiment and momentum.
The technical knowledge you’ve gained from this article is valuable, but it’s not enough to achieve long-term profitability as a trader. While it can give you an edge when applied correctly, consistent success over the next 3+ years requires pairing it with sound trading strategies and tactics.
At ParadiseFamilyVIP 🎖️, we combine technical analysis, on-chain insights, precise sentiment tracking, and a deep understanding of whale behavior with proven strategies to deliver top-tier crypto signals and portfolio management, ensuring long-term profitability.
👉To check availability in ParadiseFamilyVIP 🎖️ (Click it)
We operate openly with our trading capital, offering insight into our strategies to help you transform into a professional trader.