


Listen: the breakdown
Market briefing: US spot Bitcoin and Ether ETFs lost about 549 million dollars last week, with Ether funds down nearly a billion in October. BTC was trading near 82,633 dollars, up 1.3 percent on the day.
- US spot Bitcoin and Ether ETFs shed roughly $548.5M for the week ending October 16.
- Ether funds alone bled about $954.8M from October 1 to 16, with BTC funds down $228.4M.
- BTC held near $82,633 and ETH near $2,428, up on the day despite the regulated selling.
US spot Bitcoin and Ether ETFs just shed $549M in a week, yet price barely flinched. So who is quietly buying what these ETF outflows are selling?
US spot Bitcoin and Ether ETFs lost roughly $548.5 million in the week ending October 16. That is a clean, confirmed number, and it is not a small one.
Ether funds carried most of the weight. They gave back about $320.1 million over the week, extending a brutal run. From October 1 to October 16, ETH products bled around $954.8 million, closing in on a full billion for the month.
Bitcoin funds added to the pain. They logged about $228.4 million in net outflows across the five sessions, a second straight weekly withdrawal. BlackRock's IBIT and Fidelity's FBTC drove roughly 98 percent of that figure.
The month started differently. Bitcoin ETFs pulled in around $293 million early in October, then handed back about $615 million as sentiment cooled. One bright spot stood out on October 13, when Ether funds took in $24.8 million, with Fidelity's FETH gathering $10.5 million.
Here is the part that matters. Despite half a billion dollars leaving regulated vehicles, BTC traded near $82,633 and ETH near $2,428, both green over 24 hours. That gap between heavy ETF selling and firm spot prices is the real story. There is no single confirmed catalyst behind the exodus, so we read it as broad de-risking and rebalancing, not panic. Someone is absorbing the supply the ETFs are releasing.
Regulated demand is draining from crypto
ETF flows are the cleanest proxy we have for institutional appetite. When money leaves these vehicles, it signals that the regulated, risk-managed crowd is trimming exposure, not adding it.
That matters because spot ETFs became a primary demand channel this cycle. Creations force authorized participants to buy underlying BTC and ETH. Redemptions do the reverse. So a net outflow is not just sentiment on a screen. It is actual coins hitting the market.
Nearly $955 million leaving Ether funds in sixteen days tells you the de-risking is concentrated in the higher-beta asset. ETH tends to lead both the rallies and the retreats, and this October it has led the retreat.
The macro read is straightforward. Capital is rotating toward caution. Investors who hold crypto through traditional channels are rebalancing, likely toward cash or other assets, which thins the demand side precisely when the market needs steady bids.
There is no dramatic trigger here, which is almost the point. Big flows do not always need a headline. Sometimes allocators simply decide the risk no longer pays, and the glossy inflow projections from January quietly meet the redemption desk.
For transmission, the chain is simple. Weaker ETF demand means fewer forced buyers, which means spot has to find support from somewhere else. When that somewhere else is smart money rather than fresh institutional inflows, the base is thinner than the price suggests.
Thin regulated bids leave spot exposed
Start with Bitcoin, because it sets the tone. BTC absorbed $228 million of ETF selling and still printed green, near $82,633. That resilience is real, but it is resilience against a headwind, not a tailwind.
Without ETF creations pulling coins off the market, the marginal buyer has to come from spot. Right now that buyer appears to be present, yet every day of outflows chips at the cushion beneath price.
Ether sits in a weaker spot. With nearly a billion dollars gone this month, ETH has less structural demand defending it. That is why it trades near $2,428 while the ETF story screams distribution from regulated holders.
The liquidity picture then rolls downhill. When BTC and ETH lack a strong institutional bid, altcoins lose their reflexive support fastest. Capital does not rotate into smaller tokens while the majors are leaking regulated demand. So the honest read is a market walking uphill. Price is holding, but it is holding into selling, not buying.
That creates a fragile kind of calm. If spot buyers stay, the outflows get absorbed and the floor holds. If they step back, there is little between current levels and the next support zone, because the regulated bid that once cushioned dips has gone quiet.
Does the ETF bleed finally stop
The first thing to track is whether these outflows slow or deepen. One green day of ETF flows, like the $24.8 million that hit Ether funds on October 13, is noise. A full week of net creations would be the real tell that the de-risking is over.
Watch Ether especially closely. It has carried the heaviest redemptions, so it is where a shift in regulated demand would show up first. ETH flows turning positive would signal institutions returning to the higher-beta trade.
On Bitcoin, the question is concentration. With IBIT and FBTC driving almost all of last week's outflows, a reversal in those two funds alone could flip the weekly number back to green.
Price confirmation matters too. If BTC holds firm while outflows persist, that divergence strengthens the case that spot buyers are absorbing the supply. If price finally cracks as the flows continue, the absorption story was weaker than it looked.
Invalidation is simple. A fresh wave of redemptions paired with falling spot prices would confirm genuine demand destruction, not strategic rotation.
Keep one eye on the broader tape. The outflows have no single catalyst, so a clear macro shift, easier liquidity or a risk-on turn, could reverse sentiment quickly. Until flows stabilize, treat every bounce as provisional and let the ETF data, not the hope, lead the conclusion.
What the outflows mean for the floor
The ParadiseTeam frames these outflows against a market that was trading near $82,633 as of the latest read. The key question is simple: who is on the other side of half a billion in ETF selling?
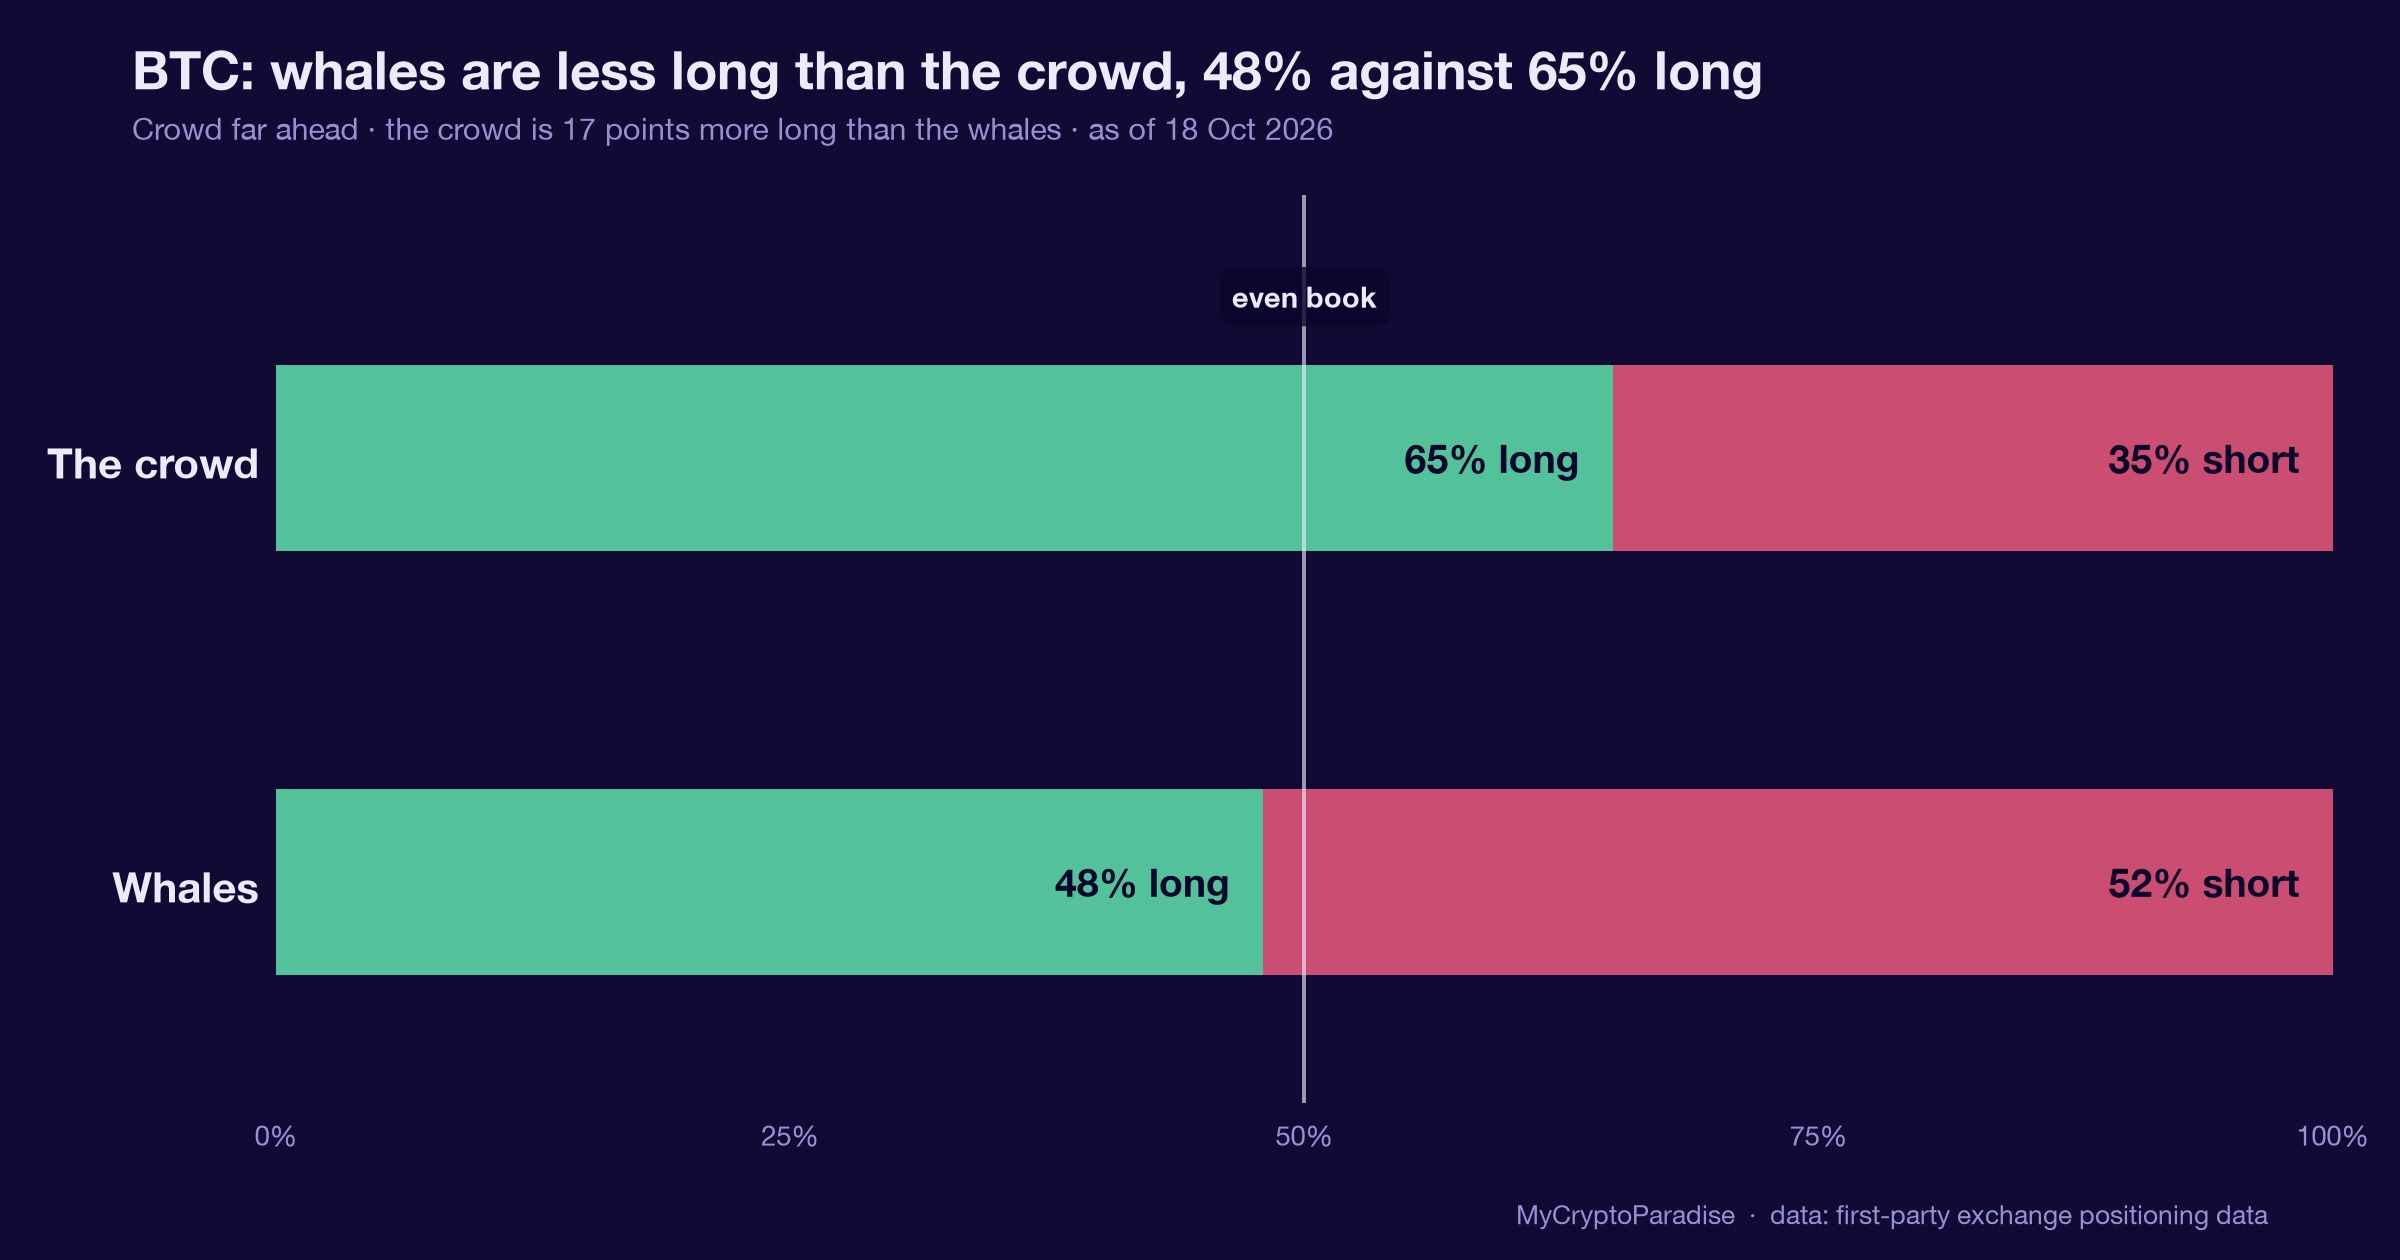
Our working view holds that smart money and whales are absorbing this supply. Spot buying has been carving higher lows on cumulative volume delta, our term for CVD, the running tally of buyers minus sellers. That is accumulation meeting distribution, and so far accumulation is holding the line.
The structure beneath price is the $78,000 to $79,800 support zone. That band stacks a long liquidation cluster and key Fibonacci levels. As long as it holds, we treat ETF-driven dips as supply the stronger hands are happy to take.
Above, $85,000 marks the first short liquidation cluster, with $88,400 and $90,000 beyond. Those are the levels that overleveraged shorts should fear if spot keeps absorbing the redemptions.
Be clear about risk. The outflows themselves are bearish for near-term demand, and a flush toward $79,000 would liquidate the overleveraged longs sitting there. That dip, if it comes, fits our read rather than breaks it.
The invalidation is a clean, sustained loss of the $78,000 floor on heavy volume while ETF selling continues. Until then, the ParadiseTeam reads firm spot prices into regulated outflows as quiet accumulation, not strength to chase.
The read behind this: we framed this story through our own market analysis, Can Bitcoin Rally Back to $90K?
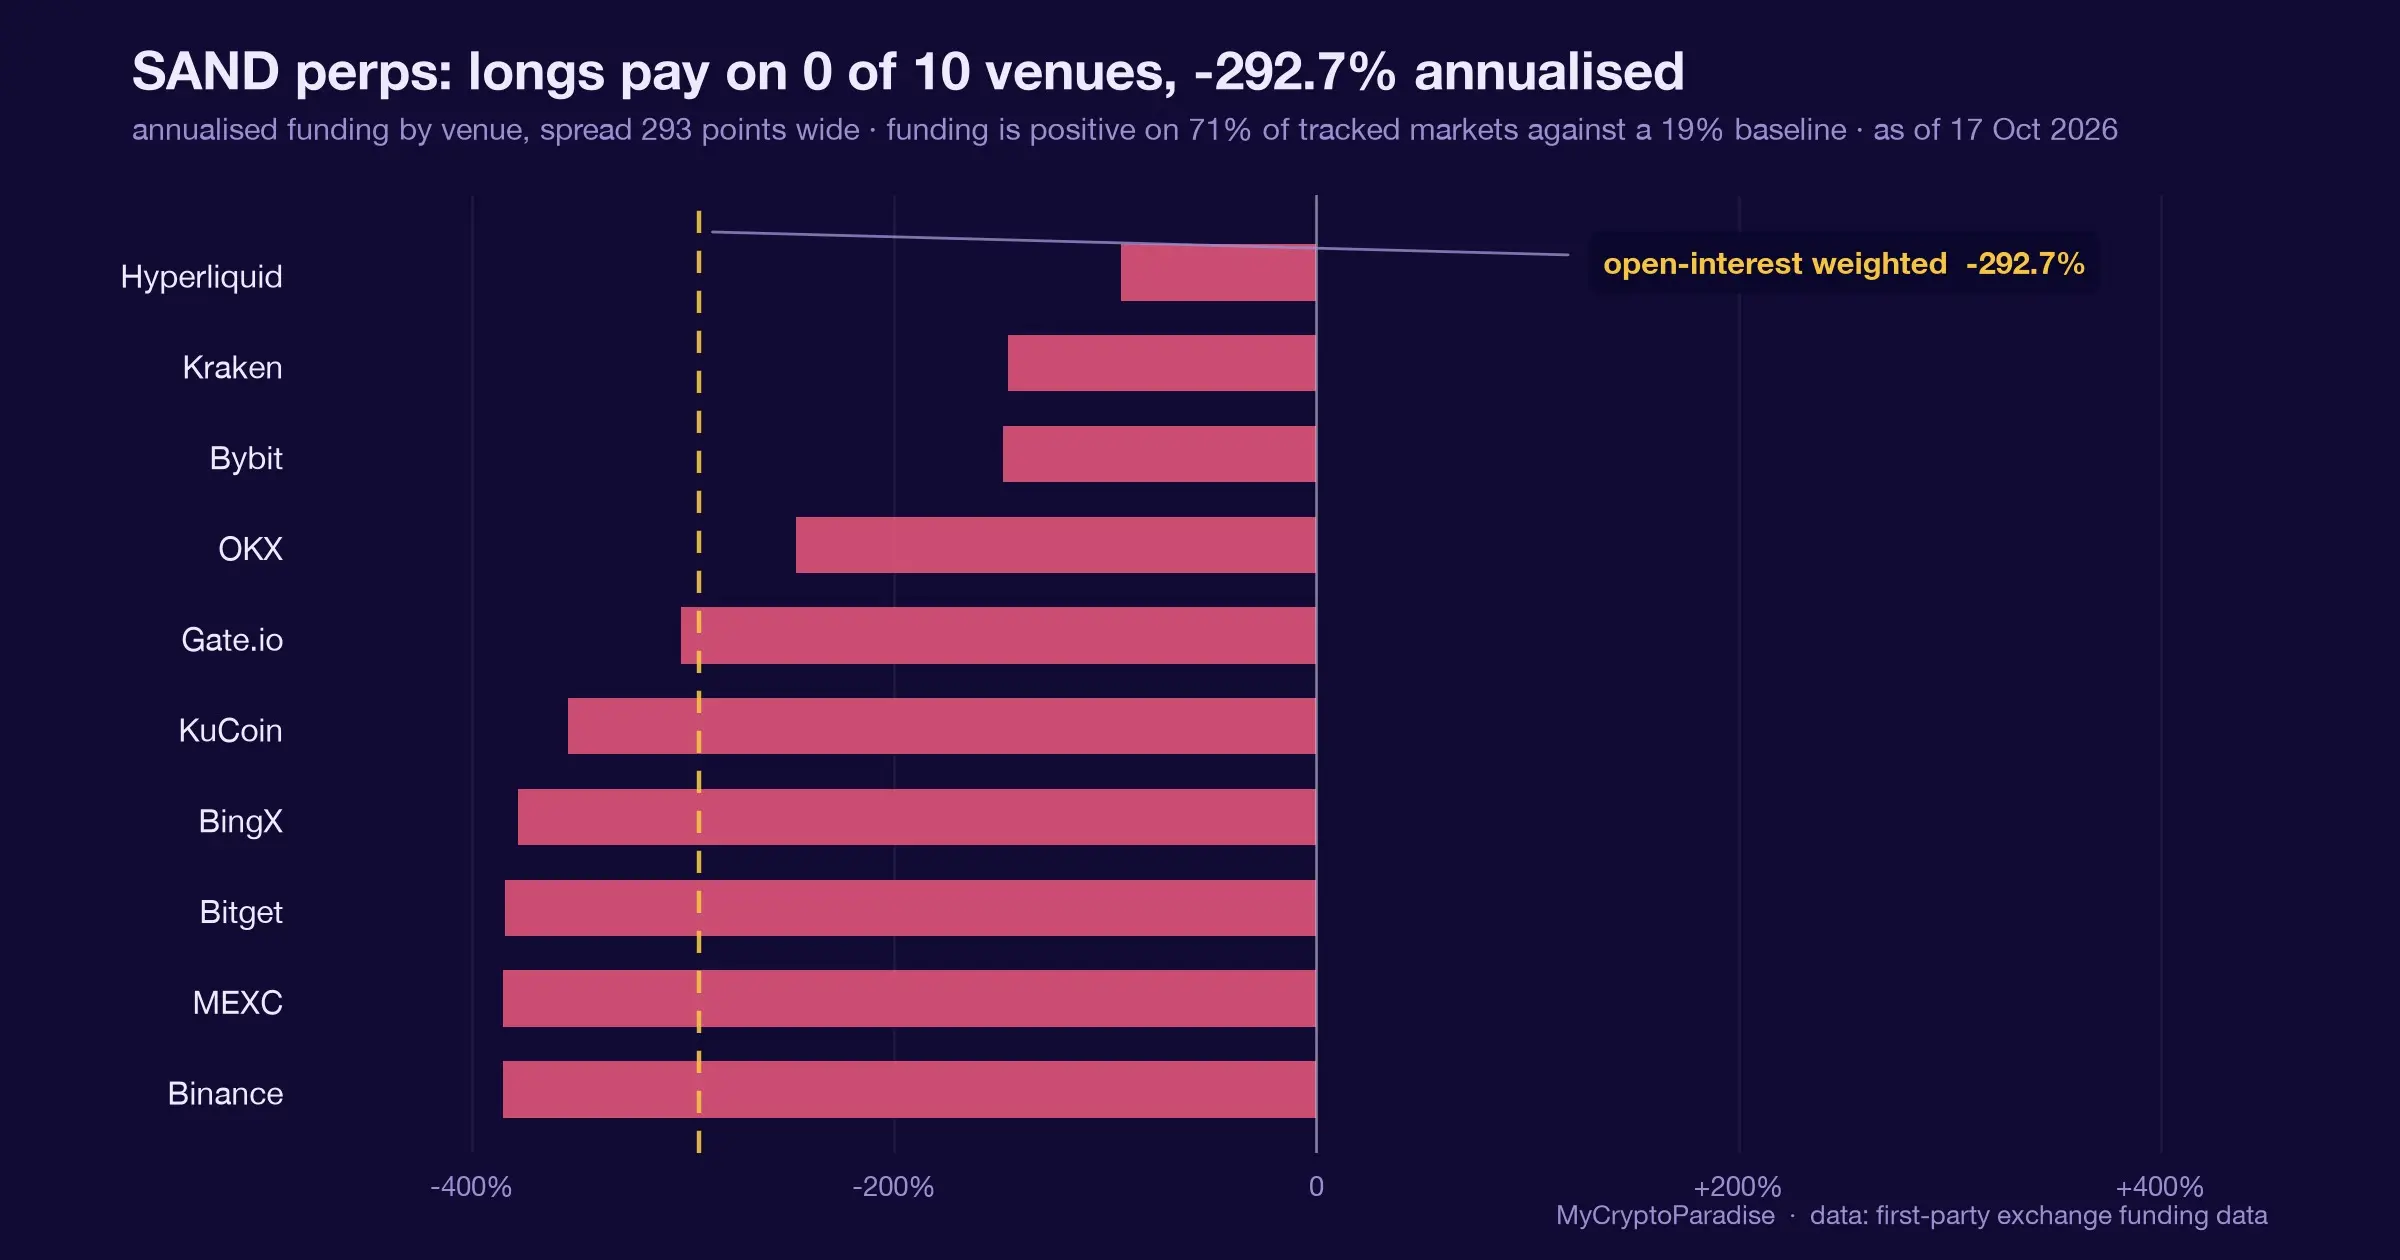
Track it live: our live crypto funding rates and the Crypto Fear and Greed Index both update in real time, so you can watch this shift for yourself.
Related coverage
For exact entries, targets, and stop losses with full risk management, that is what ParadiseFamilyVIP is for. New to reading these moves? Start with our crypto trading strategies guide.
ParadiseTeam is monitoring the market situation closely, and we are taking these developments into consideration while building our trading tactics inside ParadiseFamilyVIP.
Crypto trading involves substantial risk. Prices are volatile and you can lose money. This article is educational and is not financial advice. Past performance does not guarantee future results.
With ETFs bleeding, does BTC hold the $78K to $79.8K support zone?
This is how 1 Paradiser is calling it. Tap your call.
No calls on this one yet. Tap yours to be the first.
Free account, no password. Members just sign in.
Follow this topic: Ethereum ETF news












Join the discussion
No comments yet. Members, share how you are reading this.