MCP Insights
 PRO Paradiser
 MCP MasterClass
  ParadiseFamilyVIP Crypto Signals💰
Introduction
In the exciting world of crypto trading, technical analysis plays a key role in identifying patterns and predicting future price movements. One such pattern that traders often encounter is the bullish descending triangle.
This article aims to provide crypto traders with a comprehensive understanding of the bullish descending triangle pattern, its characteristics, and how it can be leveraged to enhance trading strategies.
Understanding the Bullish Descending Triangle

The bullish descending triangle is a continuation pattern that typically forms within an uptrend. It represents a temporary consolidation phase before the price resumes its upward movement. Traders often interpret this pattern as a bullish signal, indicating a potential breakout to the upside.
Key Characteristics of Bullish Descending Triangle
1. Shape and Structure:
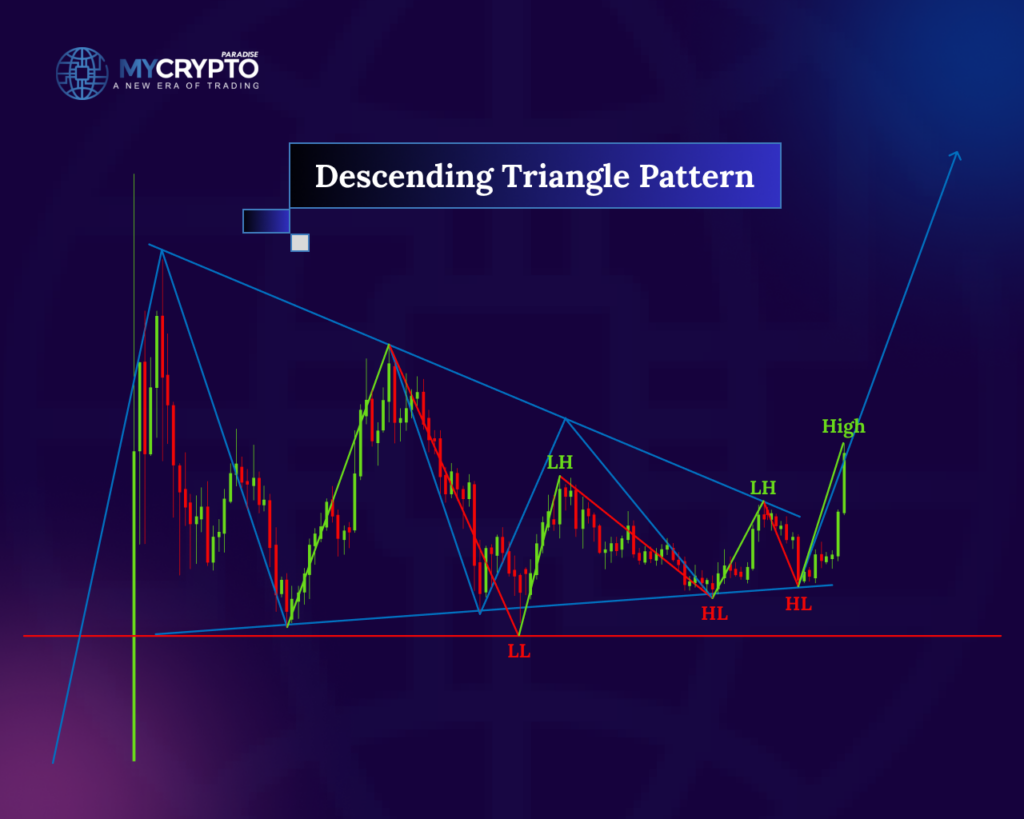
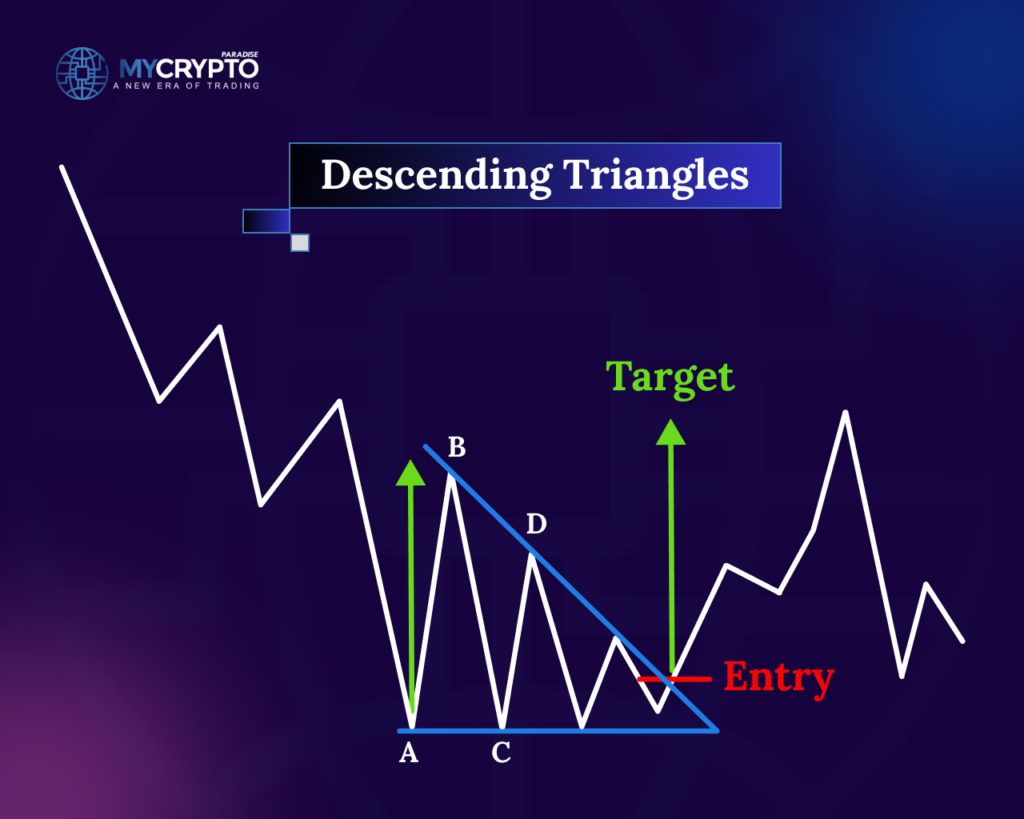
The bullish descending triangle is characterized by a flat or slightly downward-sloping upper trendline and a series of lower highs, forming a descending line. The lower trendline remains relatively horizontal, acting as a support level. The converging trendlines create a triangle-like shape.
Volume Analysis:
Volume analysis is crucial when identifying the bullish descending triangle pattern. During the formation of the pattern, volume tends to contract, indicating a decrease in market participation and a lack of selling pressure. However, when the breakout occurs, volume typically expands, signifying renewed buying interest.
3. Timeframe:
The timeframe in which the bullish descending triangle pattern forms can vary. It can manifest over a few weeks or even several months, depending on the specific cryptocurrency and market conditions.
Interpreting the Bullish Descending Triangle Pattern
The bullish descending triangle pattern can be interpreted using three key components: trendlines, support, and resistance levels.
1. Trendlines:
The upper trendline connects the series of lower highs, while the lower trendline acts as a support level, connecting the swing lows. These trendlines provide valuable insights into the pattern’s structure and help traders anticipate potential breakouts.
2. Support and Resistance Levels:
The lower trendline serves as a support level, preventing the price from falling further. On the other hand, the upper trendline acts as a resistance level, inhibiting the price from moving higher. Traders monitor these levels to identify potential entry and exit points.
Profitability Insights for a Bullish Descending Triangle Pattern
Determining the potential profitability of a bullish descending triangle signal requires a combination of technical analysis, risk management, and market awareness. While no strategy can guarantee profits, the following factors can assist in evaluating the likelihood of a profitable outcome:
Confirmation of the Breakout
One of the critical factors in determining potential profitability is the confirmation of the breakout. Traders should wait for the price to convincingly break above the upper trendline with a significant increase in volume. This confirms that buying pressure has overcome the resistance and increases the probability of a profitable move.
Volume Analysis
Volume analysis plays a vital role in assessing the strength of the breakout. A substantial increase in volume during the breakout suggests a higher level of market participation and reinforces the bullish sentiment. Higher volume provides greater confidence in the potential profitability of the trade.
Target Projection
Another important aspect is projecting a target price based on the pattern’s measurement. By measuring the vertical distance between the highest point of the triangle and the lower trendline, traders can estimate a potential target for the breakout. However, it is essential to note that this projection is an estimate and not a guarantee. Other factors, such as market conditions and overall trend strength, should also be considered.
Market Context
Considering the broader market context is crucial to assess the potential profitability of a bullish descending triangle signal. Traders should evaluate the overall trend of the cryptocurrency, market sentiment, and any significant news or events that may impact the price. A bullish descending triangle within a strong uptrend and favorable market conditions is more likely to yield profitable results.
It is crucial to remember that no trading strategy or pattern can guarantee profits in every trade. The market is inherently unpredictable, and unexpected events can impact the outcome of a trade. Therefore, it is recommended to combine the analysis of the bullish descending triangle pattern with other indicators, technical analysis tools, and fundamental analysis to make well-informed trading decisions.
How to Trade Bullish Descending Triangle Pattern
Setting appropriate stop-loss, take-profit, and entry levels for trading the bullish descending triangle pattern requires careful consideration of the pattern’s characteristics and individual risk tolerance. Here are some guidelines to help you determine these levels:
Entry Level
The entry level is the price at which you enter the trade after the breakout occurs. It is typically set slightly above the upper trendline to confirm the breakout. Traders may wait for the price to close above the upper trendline and look for increased volume as confirmation. The specific entry level can vary based on personal trading strategies, risk appetite, and market conditions.
Stop-loss Level
The stop-loss level is the price at which you exit the trade to limit potential losses if the trade goes against you. It is crucial to place the stop-loss order below the breakout point or the lower trendline of the bullish descending triangle pattern. This level should be determined based on individual risk tolerance and the volatility of the cryptocurrency being traded.
One approach to setting the stop-loss level is to consider the recent price action and support levels. Traders often place the stop-loss order below the nearest significant support level or a certain percentage below the breakout point. This allows for a buffer to account for potential market fluctuations and false breakouts.
Take-profit Level
The take-profit level is the price at which you exit the trade to secure profits. It is typically determined by projecting a target price based on the pattern’s measurement. By measuring the vertical distance between the highest point of the triangle and the lower trendline, traders can estimate a potential target for the breakout.
However, it is important to consider other factors, such as market conditions and overall trend strength, when setting the take-profit level. Traders may choose to scale out of positions by taking partial profits at predetermined levels while letting the remaining portion ride the trend if the market conditions warrant it.
Additionally, trailing stop-loss orders can be used to lock in profits as the price continues to move in your favor. This allows you to capture additional gains while protecting against potential reversals. You can consult our professional team of crypto traders at ParadiseFamilyVIP🎖️.
Conclusion
The bullish descending triangle is a powerful continuation pattern that can assist crypto traders in identifying potential buying opportunities within an uptrend. By understanding its key characteristics, interpreting trendlines, and leveraging support and resistance levels, traders can enhance their trading strategies and potentially profit from upward breakouts.
While the technical knowledge you’ve gained in this article is a great starting point, it’s not enough on its own to ensure long-term profitability. To turn that knowledge into consistent success, you need to integrate it with established trading strategies and effective tactics that will serve you for years.
At ParadiseFamilyVIP🎖️, we combine our expertise in technical analysis, on-chain insights, sentiment analysis, and whale psychology with proven trading strategies. This combination enables us to consistently deliver high-quality crypto signals and expertly manage our portfolios for maximum profitability.
👉To check membership availability in ParadiseFamilyVIP🎖️ (Click it)
If you’re ready to see how we trade and improve your skills, joining our exclusive PRO membership is the way to go.