


Crypto Chart Basics
In short
Reading crypto charts is similar to interpreting traditional stock market trading charts, utilizing many of the same analytical tools and concepts. Traders can identify patterns like bullish and bearish trends and various trading signals within these charts. Understanding how to read these charts is fundamental for navigating the cryptocurrency market effectively.
Learn how to read crypto charts like a pro!
Reading crypto charts is just like reading stock market trading charts from Wall Street or the London stock exchange. Just like these exchanges, traders in cryptocurrency have to learn the intricacies involved in selling and buying of stocks linked to digital currency.
As a novice in the crypto world, you begin to realize that everything you find in the regular stock market from trading signals to bullish and bearish trends can also be found with crypto trading.
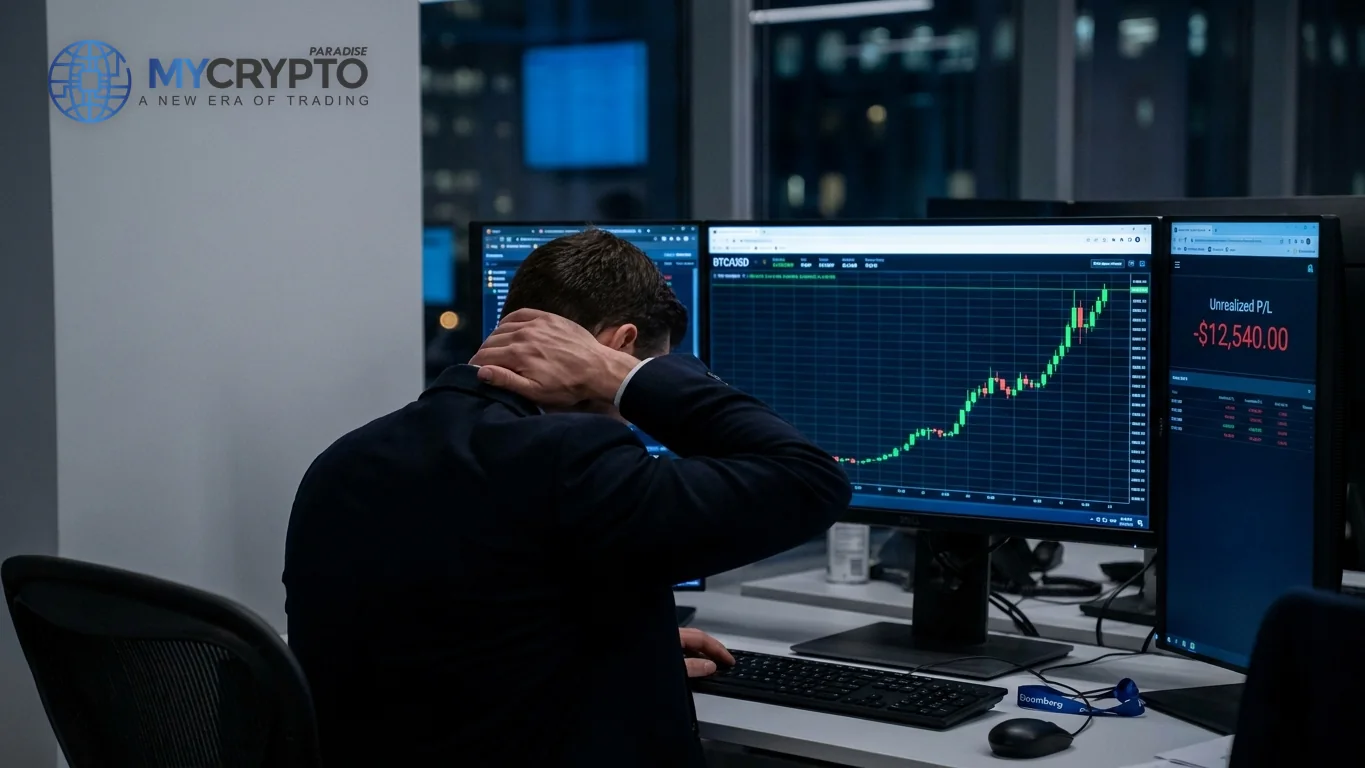
If you’re not used to day trading, you are most likely to lose your hard-earned bitcoins. Day trading crypto should not be treated as one; that is why you need a company that helps to provide crypto trading signals.
While the stock market has been around for what seems like forever, trading in cryptocurrency is a new trading arena that has gains ground in a short time.
Cryptocurrency has opened up a whole new world of finance and business to millions of people. These days, everyone wants a piece of cryptocurrency and therefore, must learn how to identify cryptocurrency trading signals, Bitcoin trading signals, free and paid crypto signals.

The crypto cap market keeps increasing every day. Most investors are entering into the cryptocurrency market. Even for the most seasoned traders, reading trading charts can be a tedious chore because of the infinite amount of information you have to wrap your head around.
If you’re a beginner or advanced in crypto trading, Mycryptoparadise.com is the best place to start. While the journey may not be easy, this article will smoothen the road for you by laying out the basics you need to know about trading signals.
What are Crypto Charts?
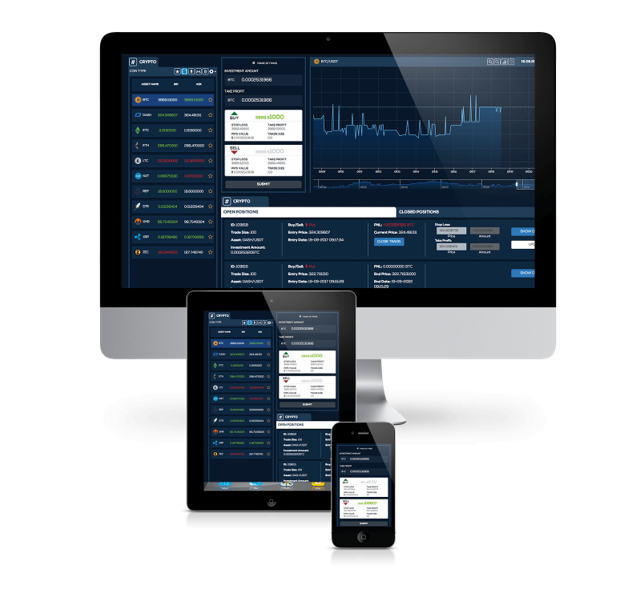
Crypto charts or Cryptocurrency charts are graphic displays of current prices of cryptocurrency, trading volumes and the overall momentum of the crypto market.
These charts are used by crypto traders to determine when to buy, sell or hold on (HODL). These are the features you can find on a crypto chart;
- Timescale setting, usually at the top left of the chart
- Custom Timescale Option, Top Right
- Dates, along the bottom of the chart
- All History Graph, this is below the dates with a bar that allows you customize the date range.
- Bitcoin Market Cap, this is a blue line that correlates with the left side of the crypto chart.
- Bitcoin Price, this is a green line that correlates with the right side of the chart. It shows then price of Bitcoin in US Dollars.
- When you hover for some seconds on the green line it brings out a detailed pop-up info for that particular period in time.
- 24 Hour Trading Volume, this is a secondary chart in black underneath the line chart, right above the dates.
- A Key to help understand various elements of the crypto chart; usually located at the very bottom of the chart.
How to Read them?
As a newbie or advanced trader in crypto, you need to understand the basic elements of a cryptocurrency trading chart so you are able to read market charts accurately and take control of your crypto trade.
These include; Time Frames, Candlesticks, Trend Identification, Line Charts, Support and Resistance Levels, Bar Charts, Trading Volumes, Bullish and Bearish as well as Moving Average Convergence Divergence Charts (MACD).
Time Frames: this is the most basic element of a crypto chart (you can see how to select a time frame in Mycryptoparadise.com VIP channels). Time frames in a crypto chart can be set between 1 minute and 1 month.
For example, selecting a 1 minute chart means the candlesticks will be based on the closing price every 60 seconds.
As a beginner, the type of time frame you select will be entirely dependent on the type of trader you want to become.
You could decide to become a scalper and operate in a lower time frame (usually between 5-30 mins) or a mid to long term trader where you get to use daily or weekly trading charts.
As a beginner, Mycryptoparadise.com would advise that you select time frames that fall between 1 and 4 hours until you become better.
Candlesticks: most crypto traders and analysts make use of candlesticks to set up their crypto trading charts.
Candlesticks represent the price activity of an asset during a specified period of time. Four main components make up a candlestick; the open, close, high and low.
If the closing price of a crypto based asset is higher than the opening price, the candlestick will turn green; it will turn red if the closing price is lower than the opening price.
The candlestick color is pretty selective although most traders use bullish (green) and bearish (red) colors.
Trend Identification : this is the first step in the analytical part of a crypto trading process. Trend identification is an important element in crypto trading that sets the mood for the entire market.
Proper trend identification will ensure you have profitable trading signals from a crypto chart. Trends are grouped into three possible outcomes; uptrend, sideways and downtrend. A basic rule of trend identification is to pay close attention to the direction of the price action.
Within the crypto trading chart, the price action is moving up, down or sideways as it prepares to move upside or downside.
While paying attention to the price action, multiple higher highs in a sequence is an indication of an uptrend. A series of lower highs is an indication of a downward trend. The price action also enters a ranging mode when markets are ranging.
This means the price action has entered a sideways direction and a move up or down is imminent as the crypto market prepares to move to the next stage.
The longer it takes the market to fully consolidate for the next phase, the higher the chance of a powerful move. You should check Mycryptoparadise for recent Bitcoin analysis and market sentiment to learn more about how to identify trends.
Line Charts: this looks like a regular basic chart you would encounter in an accounting or math class. They work by showing the simple progression of an object over a period of time represented by a single line.
In a crypto chart, the line represents the performance of the cryptocurrency over a period of time. Most crypto charts have multiple lines (linear graphs) tracking different aspects of the crypto market like price and market share. The lines give the traders an idea of how the crypto has performed over time.
This is an easy way of checking out if a crypto asset is worth investing in or not. Before you choose to invest, observe the performance of the cryptocurrency over the last 12 months especially during the last 3 months.
What you’re looking for here is trajectory. You have to get a really good indication of the crypto is on an upward or downward trajectory. This will tell you if the crypto is stable or volatile as well as its market performance in the short term.
Support and Resistance Levels: this is a very useful technique in the market analysis of cryptocurrencies as well as related stocks.
It functions by identifying price levels of crypto where the price reacted by reversing or slowing down. The price behaviour at these identified points leave enough clues to predict the future performance of the crypto in question.
There is no sure method to identifying these levels but traders find their own means and the higher the timeframe, the more relevant the applicable level becomes.
Examples of support and resistant levels are important turning points and areas of congestion or round numbers that is of significant value to the trader.
These levels exist because of a rush of buyers and sellers at particular points during a trading session. The volume of change between support and resistance can be used to illuminate a market range including trade reversals, breakouts and bounces.
While each trade have their own entry and exit rules, Mycryptoparadise can help you identify these levels on a crypto chart.
Bar Charts: These are similar to candlestick charts with the same basic elements except it has bars where the right hand vertical axis indicate the price instead of candlesticks.
You can also get the current price of a crypto stock by hovering over a particular point while the bottom horizontal axis has the dateline just like a candlestick chart. A bar comes in either red or black colors.
A red bar indicates that the closing price is higher than the opening price while a red bar means the closing price is lower than the opening price.
The bullish or bearish behaviour of an investor within a crypto bar chart is dependent on the positions of the left and right arms.
The left arm indicates the opening price while the right arm indicates the closing price. The highest price in a crypto bar chart is determined by the highest point off the bar while the lowest price is determined by the lowest point.
Moving Average Convergence Divergence Charts (MACD): this crypto chart indicated when you can buy or sell by indicating the direction of the market.
The chart also indicates when there is a change in direction towards bullish or bearish tendencies. It is also regarded as a lagging indicator that is used to confirm the direction of a trend in the crypto market.
A basic MACD chart has three components which include; The MACD line, the Signal Line and a Histogram.
Trading Volume: while trading volume is a term commonly used for regular stock exchanges, the term in relation to cryptocurrency refers to the price at which a particular crypto was traded during a specific period of time.
In a further crypto context, it can be said to mean the number of coins that have been exchanged between crypto traders on a regular market day.
The trading volume of a crypto over a lengthy period can be arrived at by taking the total amount traded during the said period and dividing this by the length of the period.
What you get is a unit of measurement that will represent the average trading volume per unit of time for each trading day.
Bullish and Bearish: while you may be used to these terms in the regular stock exchange market, they are also used to characterize trends in the trading and valuation of cryptocurrencies and commodities attached to digital currencies.
If an investor has the innate belief that the value of a particular crypto will increase over a period of time, that investor is said to be Bullish.
Investors who believe in the decline of a crypto in the market are referred to as Bearish. Unlike a regular stock exchange market, price points move pretty rapidly with a higher impact on the market.
In the cryptocurrency market, the higher volume of a crypto represents a higher liquidity in the market.
Predicting Crypto Charts
Predicting crypto charts requires keen attention to little details. The best way to predict an upward movement in a crypto chart is by understanding the variables that push up the price of the crypto been traded in the market. This can be done through the following steps;
- Observe the market sentiment surrounding a coin. Put feelers out for buzz or gossip regarding the coin you wish to trade.
- You have to observe the patterns that indicate a trend change over some time. This means you have to stay in touch with the market constantly. While many crypto sites can help you do this, Mycryptoparadise takes it a step further through telegram. The site has created crypto telegram groups that share daily market insights. You can follow them for more updates and in-depth training on how to predict crypto charts.
Time Frames: this is the most basic element of a crypto chart (you can see how to select a time frame in Mycryptoparadise.com VIP channels).
Time frames in a crypto chart can be set between 1 minute and 1 month. For example, selecting a 1 minute chart means the candlesticks will be based on the closing price every 60 seconds.
As a beginner, the type of time frame you select will be entirely dependent on the type of trader you want to become.
You could decide to become a scalper and operate in a lower time frame (usually between 5-30 mins) or a mid to long term trader where you get to use daily or weekly trading charts.
As a beginner, Mycryptoparadise.com would advise that you select time frames that fall between 1 and 4 hours until you become better.
Candlesticks: most crypto traders and analysts make use of candlesticks to set up their crypto trading charts. Candlesticks represent the price activity of an asset during a specified period of time.
Four main components make up a candlestick; the open, close, high and low. If the closing price of a crypto based asset is higher than the opening price, the candlestick will turn green; it will turn red if the closing price is lower than the opening price.
The candlestick color is pretty selective although most traders use bullish (green) and bearish (red) colors.
Trend Identification : this is the first step in the analytical part of a crypto trading process. Trend identification is an important element in crypto trading that sets the mood for the entire market.
Proper trend identification will ensure you have profitable trading signals from a crypto chart. Trends are grouped into three possible outcomes; uptrend, sideways and downtrend.
A basic rule of trend identification is to pay close attention to the direction of the price action.
Within the crypto trading chart, the price action is moving up, down or sideways as it prepares to move upside or downside.
While paying attention to the price action, multiple higher highs in a sequence is an indication of an uptrend. A series of lower highs is an indication of a downward trend. The price action also enters a ranging mode when markets are ranging.
This means the price action has entered a sideways direction and a move up or down is imminent as the crypto market prepares to move to the next stage.
The longer it takes the market to fully consolidate for the next phase, the higher the chance of a powerful move. You should check Mycryptoparadise for recent Bitcoin analysis and market sentiment to learn more about how to identify trends.
Line Charts: this looks like a regular basic chart you would encounter in an accounting or math class. They work by showing the simple progression of an object over a period of time represented by a single line.
In a crypto chart, the line represents the performance of the cryptocurrency over a period of time. Most crypto charts have multiple lines (linear graphs) tracking different aspects of the crypto market like price and market share. The lines give the traders an idea of how the crypto has performed over time.
This is an easy way of checking out if a crypto asset is worth investing in or not. Before you choose to invest, observe the performance of the cryptocurrency over the last 12 months especially during the last 3 months.
What you’re looking for here is trajectory. You have to get a really good indication of the crypto is on an upward or downward trajectory. This will tell you if the crypto is stable or volatile as well as its market performance in the short term.
Support and Resistance Levels: this is a very useful technique in the market analysis of cryptocurrencies as well as related stocks. It functions by identifying price levels of crypto where the price reacted by reversing or slowing down.
The price behaviour at these identified points leave enough clues to predict the future performance of the crypto in question.
There is no sure method to identifying these levels but traders find their own means and the higher the timeframe, the more relevant the applicable level becomes.
Examples of support and resistant levels are important turning points and areas of congestion or round numbers that is of significant value to the trader.
These levels exist because of a rush of buyers and sellers at particular points during a trading session. The volume of change between support and resistance can be used to illuminate a market range including trade reversals, breakouts and bounces.
While each trade have their own entry and exit rules, Mycryptoparadise can help you identify these levels on a crypto chart.
Bar Charts: These are similar to candlestick charts with the same basic elements except it has bars where the right hand vertical axis indicate the price instead of candlesticks.
You can also get the current price of a crypto stock by hovering over a particular point while the bottom horizontal axis has the dateline just like a candlestick chart.
A bar comes in either red or black colors. A red bar indicates that the closing price is higher than the opening price while a red bar means the closing price is lower than the opening price.
The bullish or bearish behaviour of an investor within a crypto bar chart is dependent on the positions of the left and right arms. The left arm indicates the opening price while the right arm indicates the closing price.
The highest price in a crypto bar chart is determined by the highest point off the bar while the lowest price is determined by the lowest point.
Moving Average Convergence Divergence Charts (MACD): this crypto chart indicated when you can buy or sell by indicating the direction of the market.
The chart also indicates when there is a change in direction towards bullish or bearish tendencies. It is also regarded as a lagging indicator that is used to confirm the direction of a trend in the crypto market.
A basic MACD chart has three components which include; The MACD line, the Signal Line and a Histogram.
Trading Volume: while trading volume is a term commonly used for regular stock exchanges, the term in relation to cryptocurrency refers to the price at which a particular crypto was traded during a specific period of time.
In a further crypto context, it can be said to mean the number of coins that have been exchanged between crypto traders on a regular market day.
The trading volume of a crypto over a lengthy period can be arrived at by taking the total amount traded during the said period and dividing this by the length of the period.
What you get is a unit of measurement that will represent the average trading volume per unit of time for each trading day.
Bullish and Bearish: while you may be used to these terms in the regular stock exchange market, they are also used to characterize trends in the trading and valuation of cryptocurrencies and commodities attached to digital currencies.
If an investor has the innate belief that the value of a particular crypto will increase over a period of time, that investor is said to be Bullish.
Investors who believe in the decline of a crypto in the market are referred to as Bearish. Unlike a regular stock exchange market, price points move pretty rapidly with a higher impact on the market.
In the cryptocurrency market, the higher volume of a crypto represents a higher liquidity in the market.
Predicting Crypto Charts
Predicting crypto charts requires keen attention to little details. The best way to predict an upward movement in a crypto chart is by understanding the variables that push up the price of the crypto been traded in the market.
This can be done through the following steps;
- Observe the market sentiment surrounding a coin. Put feelers out for buzz or gossip regarding the coin you wish to trade.
- You have to observe the patterns that indicate a trend change over some time. This means you have to stay in touch with the market constantly. While many crypto sites can help you do this, Mycryptoparadise takes it a step further through telegram. The site has created crypto telegram groups that share daily market insights. You can follow them for more updates and in-depth training on how to predict crypto charts.

Their channel is made of a team of skilled crypto expert traders, and they seek to make profits every day. If you have more enquires then you can contact them on telegram @paradiseslavebot, or on Facebook or VIA email, or you can make a call.
More info at CONTACT section here on the website and in their FREE CHANNELS. Happy Trading !
Related guide: charts show you the setup, the signal turns it into a plan. Read How to Read a Crypto Signal (Step by Step) next.
What is different here
Most guides stop at the theory. The MyCryptoParadise team shares the live trades, and the reasoning behind each one, inside ParadiseFamilyVIP. Everything here is education, not financial advice.
Crypto trading involves substantial risk. This is education, not financial advice. For terms, see our crypto glossary.


Join the discussion
No comments yet. Pro Paradiser members, share how you are reading this.