


- Bitcoin drops below $80K after U.S. strikes on Iran trigger global risk-off panic
- More than $300 million in long liquidations wipe out leveraged traders within hours
- Whale longs near resistance now raise fears of a larger BTC liquidity trap
Bitcoin just lost the $80K level after Iran tensions exploded again, but is this panic selling nearly over or only the beginning of a deeper correction?
Bitcoin plunged below the critical $80,000 level after U.S. airstrikes in Iran triggered a violent cross-market reaction that sent oil prices sharply higher and risk assets lower across the board. The selloff rapidly accelerated into a liquidation cascade, wiping out more than $300 million in leveraged long positions as traders rushed to de-risk exposure amid fears of broader geopolitical escalation.
The move marked one of the sharpest leveraged flushes seen in recent weeks. BTC dropped more than 4% within a single hour, slicing through key support zones that had previously held firm during recent volatility. At the time of writing, Bitcoin is attempting to stabilize near the $79,000 region after briefly touching the high-$78K area during peak panic selling.
Why Bitcoin Falling Below $80K Matters for Crypto Markets
The trigger came from outside the crypto market itself. U.S. airstrikes in Iran pushed Brent crude sharply higher, with oil briefly trading above $100 per barrel before pulling back. That immediately reignited inflation fears and shifted market positioning toward a defensive risk-off environment.
Bitcoin reacted like a high-beta macro asset rather than a safe haven.
That distinction matters because many investors still frame Bitcoin as protection against geopolitical instability and monetary uncertainty. However, when liquidity conditions tighten rapidly and traders move into cash positioning, Bitcoin continues behaving more like a risk-sensitive technology asset than digital gold.
The break below $80K also carried major psychological importance. Large liquidation clusters were sitting directly below that zone, meaning once price lost support, automated deleveraging accelerated the move lower. Markets did not slowly drift downward. They collapsed through leverage.
Market Impact of Bitcoin’s $300M Liquidation Event
The derivatives market absorbed the biggest damage.
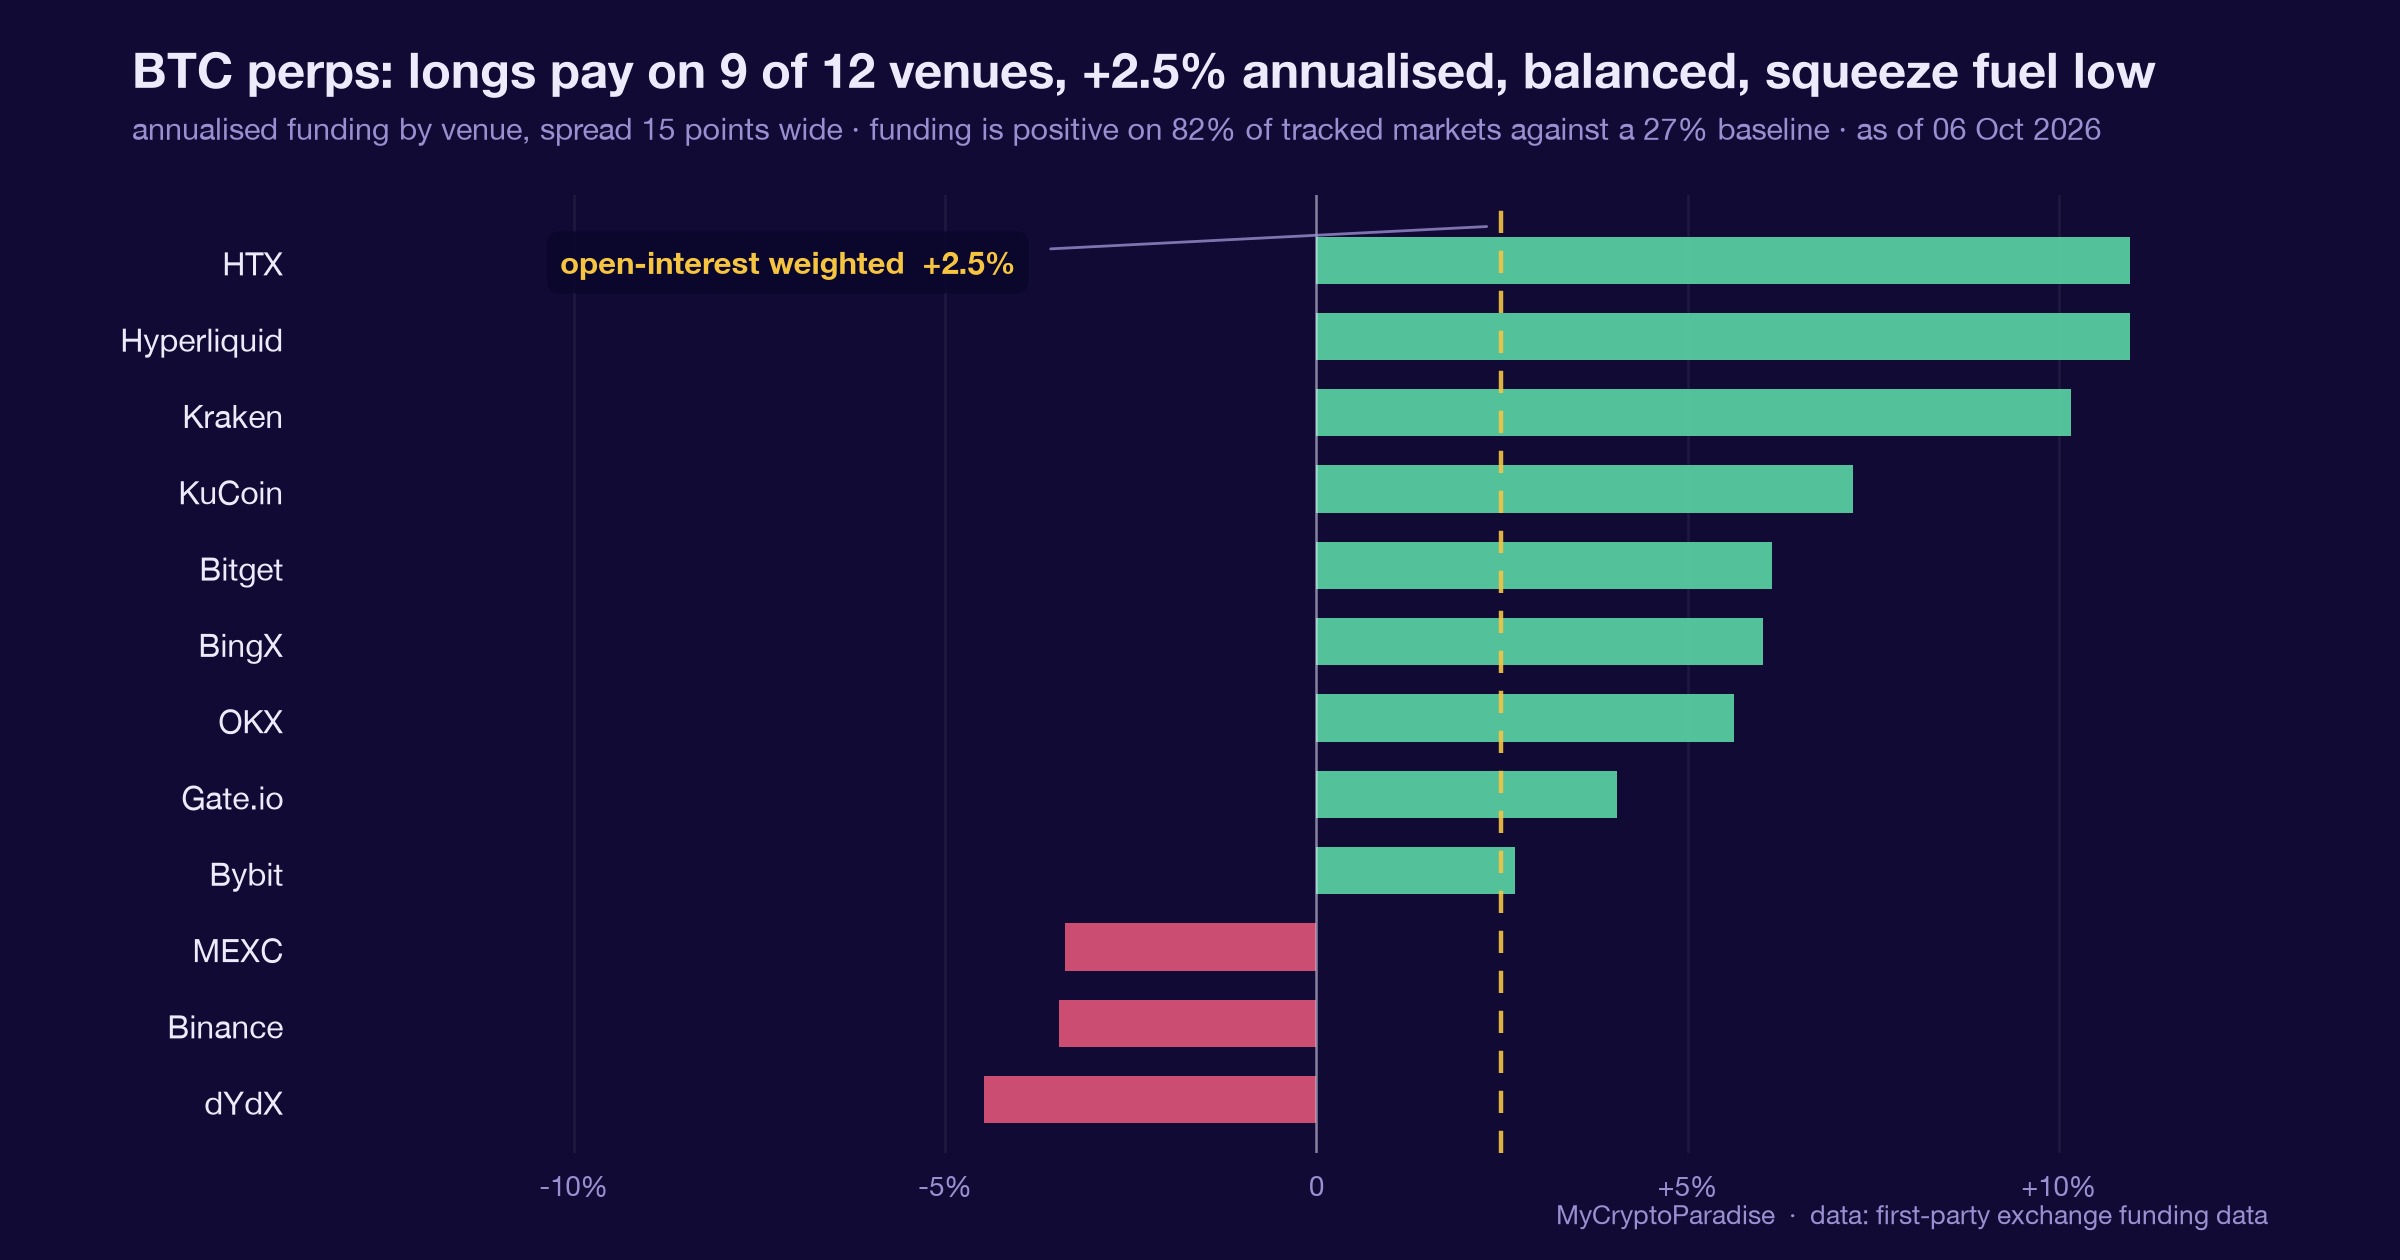
More than $300 million in long positions were liquidated as traders who had aggressively positioned for upside continuation got trapped by the sudden macro reversal. Funding rates flipped negative across several exchanges while open interest sharply declined, signaling a broad reset in speculative positioning.
This matters because leverage had already become stretched before the geopolitical escalation.
Options markets also shifted quickly into defensive positioning. Put demand surged, volatility pricing jumped, and traders began aggressively hedging downside exposure as uncertainty around Iran and oil markets intensified.
Meanwhile, Bitcoin miners face another layer of pressure. Recent estimates suggest production costs for many miners now sit above current market prices.
If BTC remains below those operational thresholds for an extended period, miners may be forced to increase treasury sales to cover expenses, adding additional spot-market supply during an already fragile period.
Altcoins also weakened alongside BTC as liquidity conditions deteriorated. Ethereum fell in tandem while high-beta altcoins experienced sharper intraday volatility due to thinner order books and reduced market-making activity.
What to Watch Next for Bitcoin After the Iran Shock
The next major catalyst remains geopolitical.
Markets are closely monitoring whether tensions between the U.S. and Iran continue escalating or stabilize through diplomacy. Oil prices remain one of the most important variables because higher energy prices directly impact inflation expectations and broader market liquidity.
From a technical perspective, traders are now watching whether Bitcoin can defend the upper-$70K region.
This becomes especially important because recent market structure analysis in MCP Youtube stream continues pointing toward unfinished downside liquidity zones below current prices. One major CME futures gap remains open near the $67K area, and historically these gaps often act like magnets during periods of volatility and sentiment exhaustion.
At the same time, Bitcoin previously attempted to push toward another imbalance zone near $84K before momentum weakened.
This creates a dangerous environment where both upside continuation and sharp downside repricing remain possible depending on how macro conditions evolve over the coming days.
Trader Insights on Bitcoin Falling Below $80K
Professional traders are not blindly chasing either direction here. They are studying positioning, liquidity behavior, and sentiment exhaustion.
Market analysis from ParadiseTeam showed several warning signs before this drop accelerated. Fear and Greed indicators were already showing excessive optimism, while bearish divergences between momentum and price action suggested weakening strength underneath the rally.
Funding rates and derivatives positioning also revealed increasingly crowded longs near resistance.
That setup matters because markets often punish consensus positioning at critical zones.
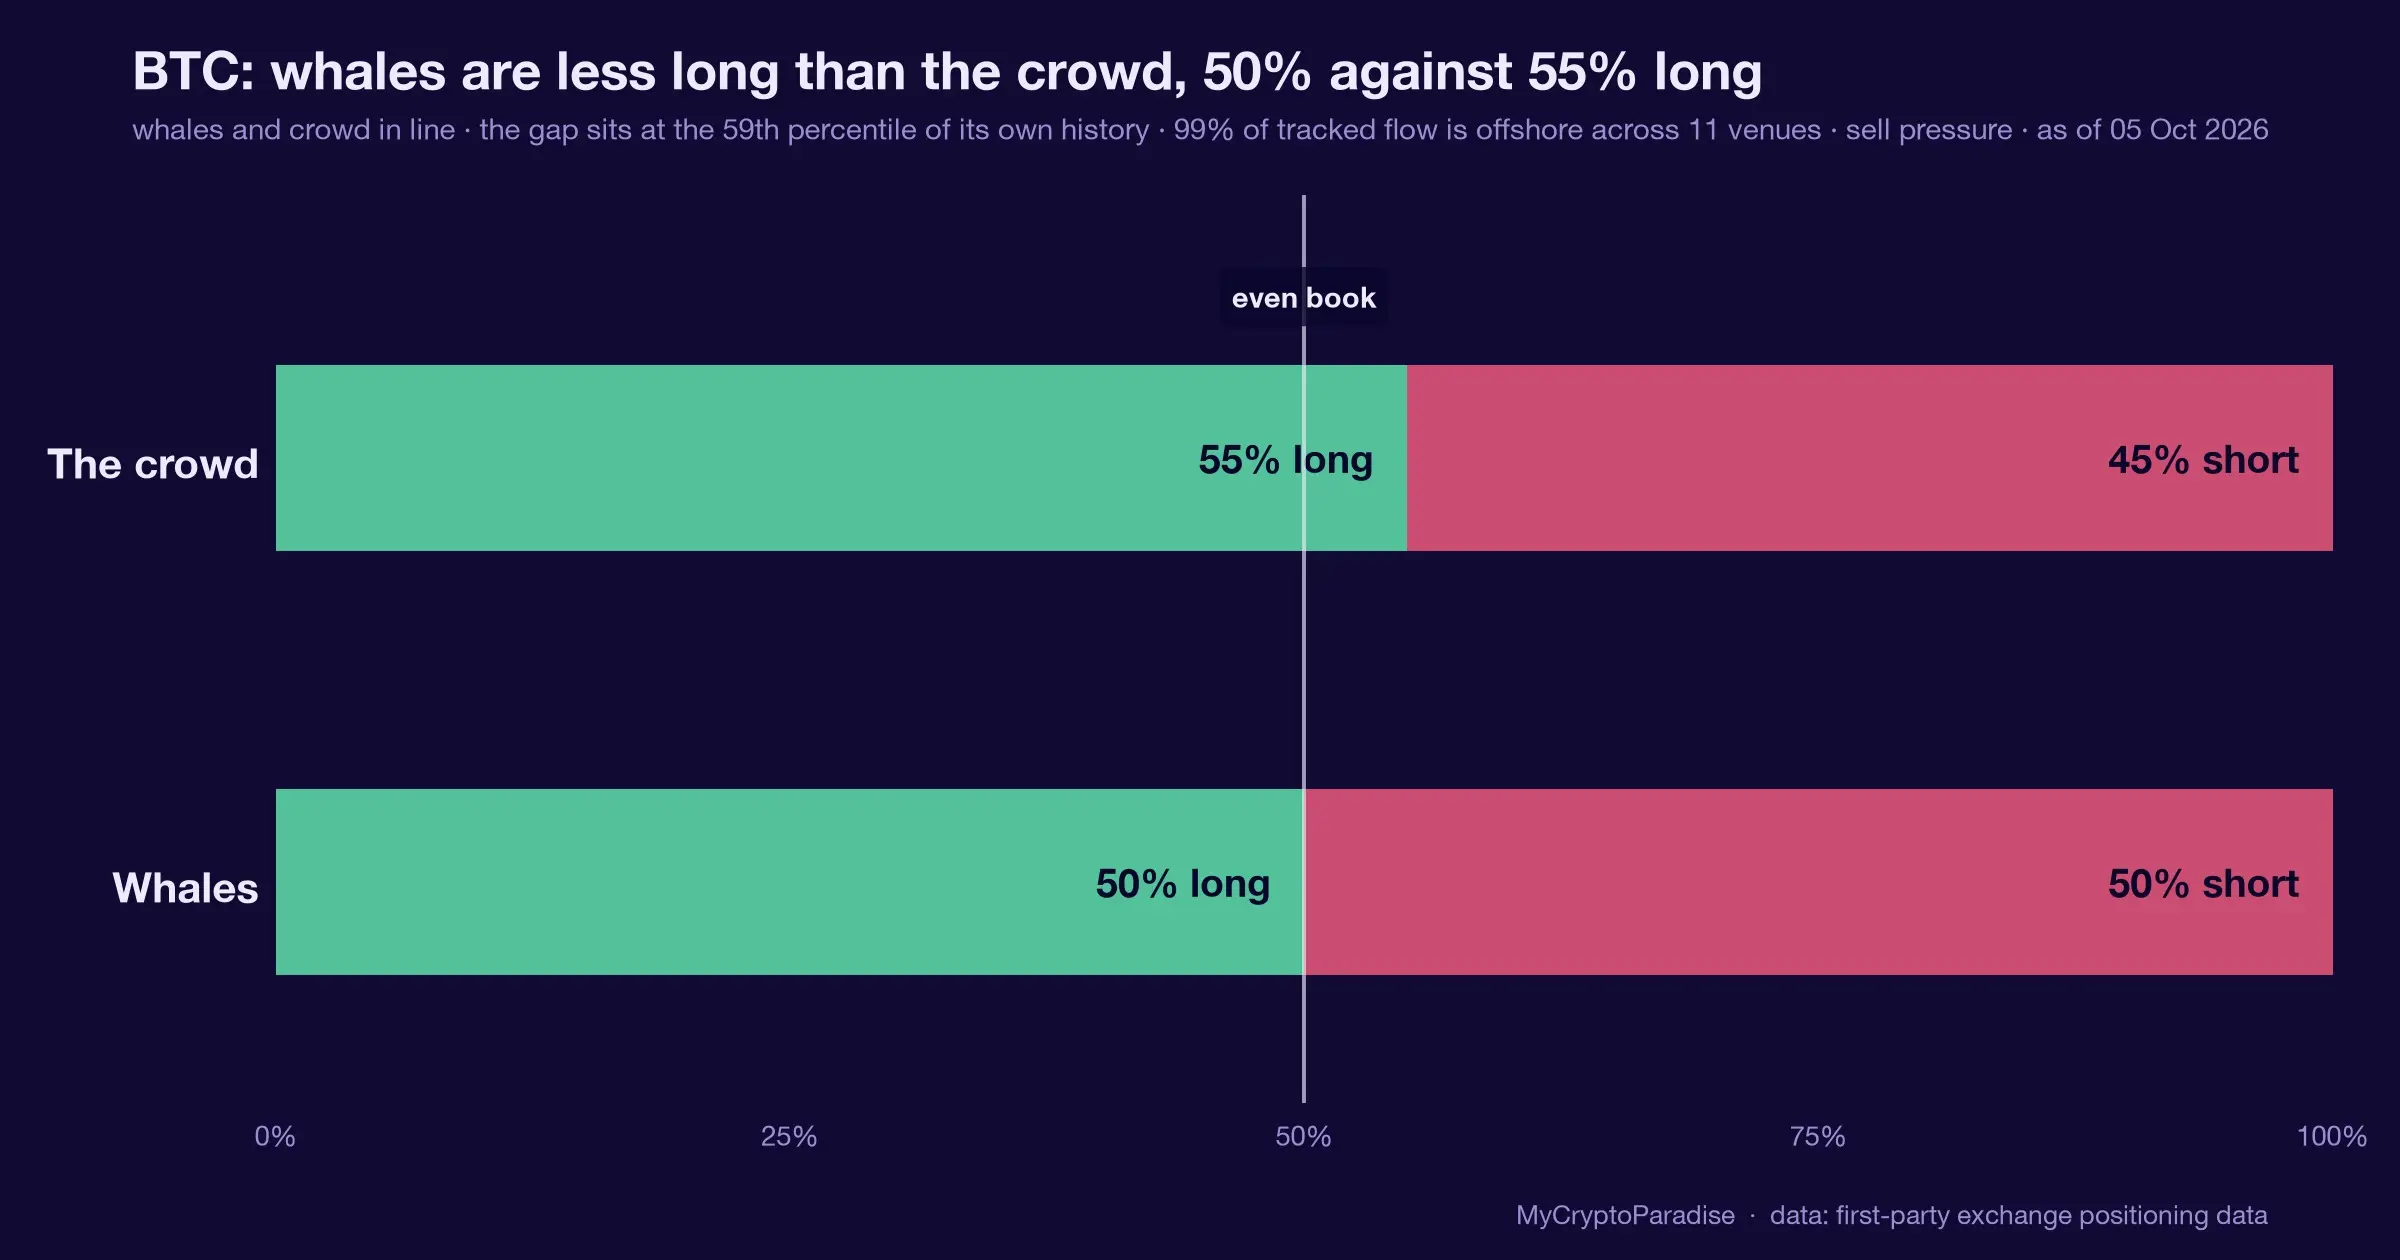
Another important observation is that smart money rarely enters or exits positions emotionally. Large players use liquidity cycles, slippage management, iceberg orders, and retail overconfidence to execute size efficiently. That means visible whale longs near resistance do not automatically confirm bullish continuation. Sometimes they simply attract additional liquidity into vulnerable positioning.
The bigger picture remains clear.
Bitcoin may still attempt another push higher toward the $84K region if geopolitical pressure eases and liquidity stabilizes. However, if resistance continues rejecting price while macro fear remains elevated, the probability of a deeper retracement toward lower liquidity zones grows significantly.
This is why professional traders are currently prioritizing discipline, probability, and capital preservation over emotional directional bias.
Right now, Bitcoin is not just trading charts. It is trading liquidity psychology, macro fear, and geopolitical volatility simultaneously.
ParadiseTeam is monitoring the market situation closely, and we are taking these developments into consideration while building our trading tactics inside ParadiseFamilyVIP.
Video transcript
Auto-captioned from the video audio and lightly cleaned. It is what was said, not a written article; for the structured breakdown read the sections above.
Bitcoin well, just few minutes ago, opened a massive [music] BTC long position worth 25 million dollars. But, is it a smart idea [music] to do so if we are approaching our major resistance zone? Let's analyze the probabilities. >> [music] >> My [singing] Crypto Paradise.
Hello, ladies and gentlemen. Paraleloscopio, this is someone from My Crypto Paradise. Welcome back. It's great to be here. Today is Thursday, and that means that you're watching the second video of this week. So, previously we have been talking about this CME futures gap that we have created back in January.
Ladies and gentlemen, we have almost closed it. As you can see, the price created a high at $83,300. The gap the CME futures gap is going to be closed if Bitcoin will hit $84,000. So, there is only a little bit left before it's going to be closed.
Afterwards, no major CME futures gap is above us. The next closest one CME futures gap is sitting below us and exactly at $67,000. It's this small gap right here, ladies and gentlemen. So, what is the probability that the price action in the upcoming weeks and months might look something like this?
We will be talking about this. So, let's first of all skip We'll skip the weekly time frame because we have been going through it in the previous videos. We will not be doing this right now, but we will definitely take a look on the daily, 4-hour, and also 1-hour time frame, all right?
And that will help us to understand if Bitcoin has some probability and if it's a higher probability or a low probability that we might have a final push before we might be dumping to the downside. And if this price action is actually a high probability one or if it's actually something different.
If If it's a higher probability and what will need to happen for Bitcoin to actually reclaim this resistance into a support and start pushing higher because it might happen as well, right? This is the high of the secondary wave that we have been talking about.
So, we will be talking look at that, ladies and gentlemen, right now. However, since we are starting on the daily time frame, let's also put our focus on the Fear and Greed Index, all right? It's probably one of the best indicators that we are doing for you with the help of the AI.
We are analyzing a lot of details for making sure that our live crypto Fear and Greed Index on many time frames is absolutely as accurate as possible and it really reflects as accurately as possible the current sentiment around the retail traders. And by the way, if you are analyzing and you you might be analyzing this with me on our website mycryptoparadise.com.
If you are analyzing the live crypto Fear and Greed Index, you need to understand that as a professional traders, what we care mostly about is this kind of extremes, right? When we are analyzing the crypto Fear and Greed Index, we are very interested in extremes and we are also interested in divergences between the price action of Bitcoin and how far and how basically high or low is the Fear and Greed Index,
okay? So, you understand, for example, when the price action of Bitcoin is going down, but the Fear and Greed Index is going higher and higher, that's a divergence, right? And also you are interested about the extremes. So, on this scale, the extremes for us is 80, that's kind of extreme greed, and 20, that's something like extreme fear.
Then you can also have a look at this picture right here to have it visually like in front of you. So, right now on the daily timeframe, the pri- we can we can analyze the price action and some kind of potential divergence on the lower timeframes, but there is none at the moment and we can see that on the daily timeframe, we are at 70, right?
66.5 to be absolutely exact. So, we are kind of close to 80, but not just there yet, all right? You know that if we can confluence the number 80 on our Fear & Greed Index with some important resistance on Bitcoin, it's usually working as a top-in signal.
But why? Because a lot of people are trying to long Bitcoin and expecting a breakout above the resistance, right? But when the price action the sentiment is there at 80, but when the price action starts to consolidate at that resistance, right? Like this for example, and the sentiment is getting higher and higher, that means more and more people believe that the price will break above the resistance, but the price is just
consolidating at that resistance zone, it usually means what? It usually means that the smart money, the people, the minority of people that are actually working with the majority of the money in the market, they are actually absorbing all that buying pressure and they are selling their backs on it, right?
So, some hidden force, this smart people, this this minority of smart people, smart money basically, is distributing that buying liquidity that the masses are giving right then to work with. And it's all about liquidity. You know that for the market, the news doesn't matter.
It's all about liquidity, all right? It doesn't matter what's going to happen in the world, it doesn't matter some events, it It matter if there is a war or not. When you are analyzing the markets, you need to understand the overall context of the market and then you need to understand how the money is are flowing from crypto market to other industries, all right, from AI to tech, etc., to metals, housing,
real estate, you know? And then you can understand how the money is actually cycling, right? The money is cycling and then you understand that actually everything is about the liquidity. So, if you are handling a lot of money, let's say $10 million, you already need some liquidity, right?
To dump your bags or to pump or to basically buy your bags back, right? So, in order for you not to create a slippage, that mean if you buy, you definitely don't want to create some big slippage, like a big candle like this one, for example, because that decreases the potential profit you will be able to make, right?
So, let's say you basically bought and you bought at low time frame support and once you stopped buying, you already are at low time frame resistance, that's not really good. There is already a slippage like 5%, right? So, it actually diminishes the potential profitability you can make.
So, as a smart whale, and this is just $10 million. Now, imagine you are handling billions of dollars, all right? So, as a smart smart money, you basically the only thing you don't want to do, first of all, you don't want to get attention from >> [clears throat] >> professional traders that are watching in the order books, they are watching the footprints, etc., so they can spot these kind of imbalances if
something is happening behind the candles, right? So, that's one thing you don't want to do and the second one is to create some slippage, right? So, the best thing senior you can do is actually to do some kind of iceberg in that basically you will create a sell limit order, very small one that hits, you immediately create another one.
That's ice broken, right? That's the opposite of spoofing. So, that's one thing what you can do, or you can just keep the sentiment high. That means you can be pushing like some bullish news at resistance. Let the retail really start feeling bullish, all right?
And they will provide you with the liquidity, and you just you can just keep on market selling to them, okay? And then, because you understand that it's all about liquidity, there is not going to be enough people to keep on buying. Once you see that uh the the momentum is already decreasing, all right?
And the powder is actually diminishing from the market, then you start the actions to start uh pushing the market down. So, is that is that an easy way for you to do? Well, for that, you need to have some kind of imbalances, right?
We've been talking about the imbalances in the previous video. If we will start going to the downside, we might liquidate over 16 billion dollars worth of long positions. If you will start pushing towards 67,000 dollars, and that is the level where there is the next important CME futures gap, you know?
So, you know that the gaps are working as a magnets, basically, right? Uh not a smile, but you know what I mean, right? This kind of magnet, like this. All right? So, this is the magnet. So, it's already giving us some kind of probabilities that basically, if you measure the gaps on the market, and you see that like which gaps are closer closest, so you can see that actually, there might be
some small ones that I have not been able to spot, but I don't even see any of them until 126,000 dollars, until the previous all-time high. So, the next important CME futures gap is at that 67,000 dollars, and it's working as a magnet, you know?
So, the probabilities are increasing, and then when you start getting more confluences towards that level, it's just increasing the probabilities, right? And you know that as a professional traders, all we care about is protection of our capital, right? And surviving long enough that our probability point system can start giving us profit, right?
So all we focus on is survivor in the short run and making profit in the long run. Most people, they are doing it the different way. Why? Because they lack patience, they lack discipline, they don't want to follow some disciplined approach trading system, right?
So they are doing the opposite. So they want to have as much profit in the short run as possible. Everybody just want to get rich quick with trading, right? And only after that they start to think about survivor, but it's usually too late already.
So protection of the capital is our main important thing and that's also what Paradise Mini VIP is all about. As you know, in Paradise Mini VIP we are sharing with you our personal trade setups. We have had a very great time in scalping because of these small movements, ladies and gentlemen.
I do believe that very soon, because the market is changing its phases, all right? So very soon the market will start becoming extremely good for swing trading strategy as well. We are really about to have a big move, I do believe, after this slow price action that we have been experiencing for around 3 months.
I do believe that the market will start picking up on some volume and on some big moves and that will be absolutely beautiful for swing trading strategies, ladies and gentlemen. So right now, what we can see on the daily time frame is something that is just giving more credibility to bears again, all right?
So right here you can see that the market is creating a higher highs and higher lows, but the momentum indicator, in our case we are looking at MACD histogram right here, moving average divergence convergence, right? And we can see that the momentum the histogram is creating lower highs, all right?
So, take a look at this histogram. Lower highs, higher highs on the price action, lower highs on our histogram. This is what we call a bearish divergence, ladies and gentlemen. When And it's actually the strong one. When the price action is creating higher highs, but the indicator is creating lower highs, that's usually a bearish divergence that basically tells us what's going on behind the scenes.
Behind the scenes is happening that the market keeps on pushing to the upside, but when we see losing like momentum and really nothing extraordinary on the volume, you can see that we are below the moving average volume trend line all the time as we are going higher and higher.
It's usually tell us that not a real buying pressure from spot market driving this action to the upside, and it's more something like short squeezing, right? But that cannot be going on infinitely. If we take a look on our right here accumulated funding rates, we can see that on the altcoins, they are already starting to turn negative.
We still do have on the daily time frame and the accumulated funding rates Bitcoin in positives, altcoins are already turning positives, but Bitcoin is still negative, but already is going into to neutral numbers, and very soon we'll start shifting into positives as well.
And that means that long positions will start to pay short positions, and it will tell us that in the market there is much more fresh long contracts in the market, and that's going to really help us to start this kind of domino effect, right?
And start pushing towards that $67,000, and we might liquidate even $17 billion right here as we have been saying already, right? So, the change will be as we have been speaking about in the previous video, if you will start changing the market structure.
But, right now we need to really focus on the logical part of trading and that is that we are at resistance on the daily time frame and we have created just so far a shooting star candlestick pattern, right? So, the whale that just opened $25 long position that we have been speaking about and I have been showing you in the intro is probably not one of the whales that is basically handling
the trading smartly. You know that there is a lot of people that is having a lot of money and they are not managing their money very well. It's usually old money, right? The new money, they can manage their capital very wisely because they have been grinding from zero, right?
So, they understand what's building business is about and you know that trading is very similar, professional trading is very similar to building a business, right? It's step by step. It's step by step and you are just waiting for the positive outcomes because luck is very important in trading, right?
So, as a professional trader, you need to understand that even though if there is like 80% probability of winning, in 20% of times you will still lose, right? So, you need to understand that the luck is involved there and you can really use it in your favor or you can use it against yourself.
Most people use it against themselves, but if you want to use it in your own favor, you need to work with your probability point system, right? And you know that sometimes you will be hitting these kind of winning streaks, right? The thing is that sometimes you will be also hitting these kind of losing streaks.
And what you want to do is basically to make sure that with your strategy you have a great reward, right? That means that you will win always more than you lose on every trade, on every single trade, and that you are only entering the highest probability trade setups, and that you are working with a proper risk management, and basically make sure that during these losing streaks, you will not lose everything that
you have made during this winning streaks, right? So, it's very important that basically this is how professional trading looks like, yeah? So, the curve in the long run is upward, right? And sometimes you have the winning streaks that should be much larger than the losing streaks, all right?
But most of the people, they are doing like this. They win win win win win, all right? Like they win win win, and then they hit like some losing streak, all right? And then win win win, win big, and then again a losing streak, because the strategy is basically bad, right?
Sorry about my drawing, I'm not the best drawer, but I hope that you get my idea. So, risk reward is extremely important when you enter a position, not only if you go long or short. It's also how much you position yourself aggressively into long position, how much into short position when you go short, and where you place your stop loss, how much you win basically when you are all correct on your
trading idea, and how much you lose when you are wrong on your trading idea, okay? So, right now, ladies and gentlemen, we are starting to get to extremes, all right? We are at this resistance, and as you can see, the bullish momentum is diminishing, all right?
And already right now, this is very dangerous for bulls. We have created a new higher high on this kind of bullish momentum. You can see the bulls are just basically decreasing and decreasing. It's because we are getting overbought. On the RSI, it's visible.
We are getting overbought, so there is there is less and less people willing to buy at the current market, okay? So, I would be very careful about that. If you will play close the daily candle as a bull bearish engulfing, it will be another a bearish sign.
Together with that, once we start having a bearish cross right here on the MACD graph, you know what happened previously. You know what happened previously. As we have seen in this indicator right here, we have got a bearish cross, all right? And then, the price action that was basically the initial initial confirmation for the price action to continue to go to the downside.
And you know that after the cross, we have crashed by around 33% ladies and gentlemen. It's not a small amount. That's the big move, all right? That's the big move, ladies and gentlemen. So, if that's going to happen and we will start crashing, you know exactly from previous videos where my next target is, right?
So, if you don't know, watch the previous videos where we have been talking about it. So, let's right now talk about this price action of this impulse. And I'm saying it's impulse because it subdivided itself into five smaller waves, ladies and gentlemen. So, this is the first one, second one, third one, fourth one, and this is the fifth wave, all right?
If we analyze the fifth wave sub-waves, we can actually understand that we might have one more push higher, all right? This is right now acting as a support at $78,000. So, let's have a look at this. So, this is the this is the final fifth wave that we started from $75,000, all right?
So, take a look at this. 1 2 3 4. As you can see, we are nicely following this kind of rule of alternation. If you are analyzing the market for long enough, you know exactly what I mean by this. This breathing pattern is basically inhale exhale inhale exhale.
And then, the second exhale in this five breaths, all right, is usually larger but much more shallow than the second exhale. As you can see, this exhale is very deep, all right? Very deep, but very short as well. It's like all [clears throat] right, and then you you have the you have the highest, most aggressive inhale right here.
Then you have very shallow inhale, right? And then you have the final inhale, and because this third wave wasn't the extended one, it wasn't the largest inhale, the one that there we would see beautifully the sub waves of that. Fifth inhale is usually the largest one if the third wave is not going to take the the position of that.
So, here we can see a beautiful first wave secondary wave, then third inhale. Right now we are doing the exhale, all right? And we might be preparing for a next final inhale, ladies and gentlemen, that if the if it's going to happen, I do believe that it will help us very nicely to close the CME futures gap that is sitting at around $84,000.
All right, so that's this next important resistance from the low time frame perspective. So, ladies and gentlemen, trade with a professional trading strategy, focus on protection of your capital, focus on making sure that you just want to basically protect your capital, and focus on your process.
Most people are focusing on the outcome, all right? You as a professional traders, we need to focus on the process because that's what matters. How we get to the profit, that's what matters. It doesn't matter if you lose or win, it matters how you get to that profit and how you get to that loss, all right?
Because as we have been speaking about in the beginning of the video, even if you have an 80% probability on a trade, in 20% of cases, you can lose on that trade. And you know that there is luck involved. So, in a row, there is a probability that even though you are taking 80% of probability trades, you might even lose five trades in a row.
It's possible. It's just a probability, not a certainty. That's why risk management matters, so you can survive and you can, in the long run, really show the market your edge. And the market always awards the people with an edge in the long run.
So, it's about the process. If you have got to that loss with following your strategy, following your system, then the outcome is not that important, right? You know that the luck is involved. But, when you have got to that profit with a bad process, that's usually what's going to get you wrecked in the long run.
All right? So, it's about the process, not about the outcome. So, focus on your trading strategy, focus on a survival, ladies and gentlemen, focus on protecting your capital, focus on risk management, and I will see you safely again with a nice Bitcoin analysis update on Saturday.
Until then, take care. Cheers. I think in probabilities, not emotions, and I remain calm [singing] and disciplined [music] in every market condition. I follow my trading system with precision and patience, waiting only for high probability [music] setups. I respect risk management and protect my capital above all else.
Losses are feedback that sharpen my strategy, and wins are the result of disciplined [music] execution. I detach from outcomes.
Educational content, not financial advice. Crypto trading carries substantial risk; you can lose your capital. Past performance does not guarantee future results.
Follow this topic: Crypto liquidation news











Join the discussion
No comments yet. Members, share how you are reading this.