

In short
Bitcoin spot exchange-traded fund (ETF) flows measure the net dollars created or redeemed across the US funds each session. On 21 October 2026, our MCP Insights ETF flow recon logged a $528.4 million inflow, the leader again BlackRock’s fund, and a third straight inflow day worth $1,078.2 million week to date. We called this neutral, constructively tilted: inflows are real, but we refused to call it sustained demand. The tide gauge agrees. It reports a 90 percent inflow impulse and, in the same breath, zero directional edge: a little better than even. That honesty matters, because last week this same series printed a $228.6 million outflow, and the 30-day net is still a positive $1,796.4 million. The reading is a model estimate, not a calibrated grade. This piece shows you how to read ETF flows yourself, streak and edge separately.
Key facts
- Latest session net flow
- $528.4M
- Net flow over the last five sessions
- $1.00B
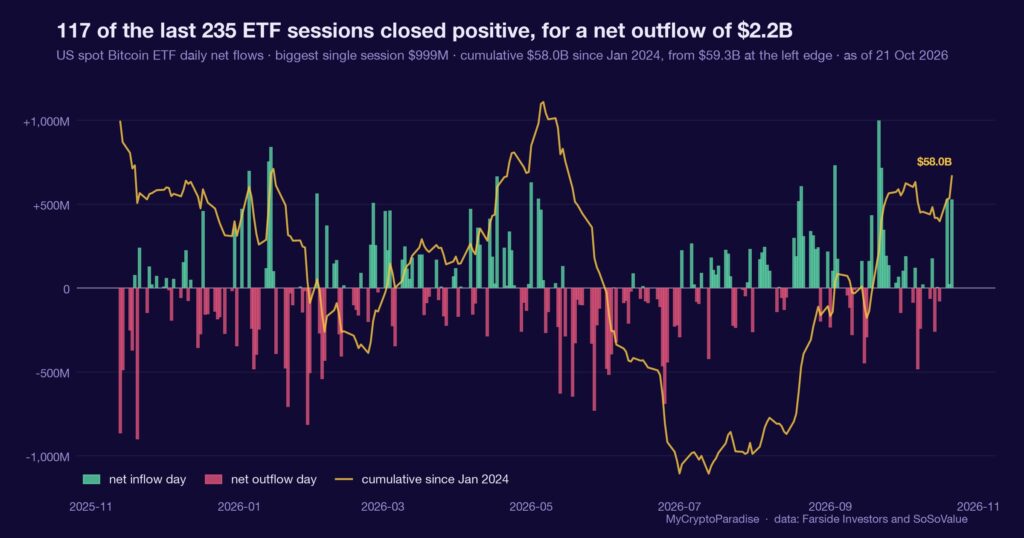
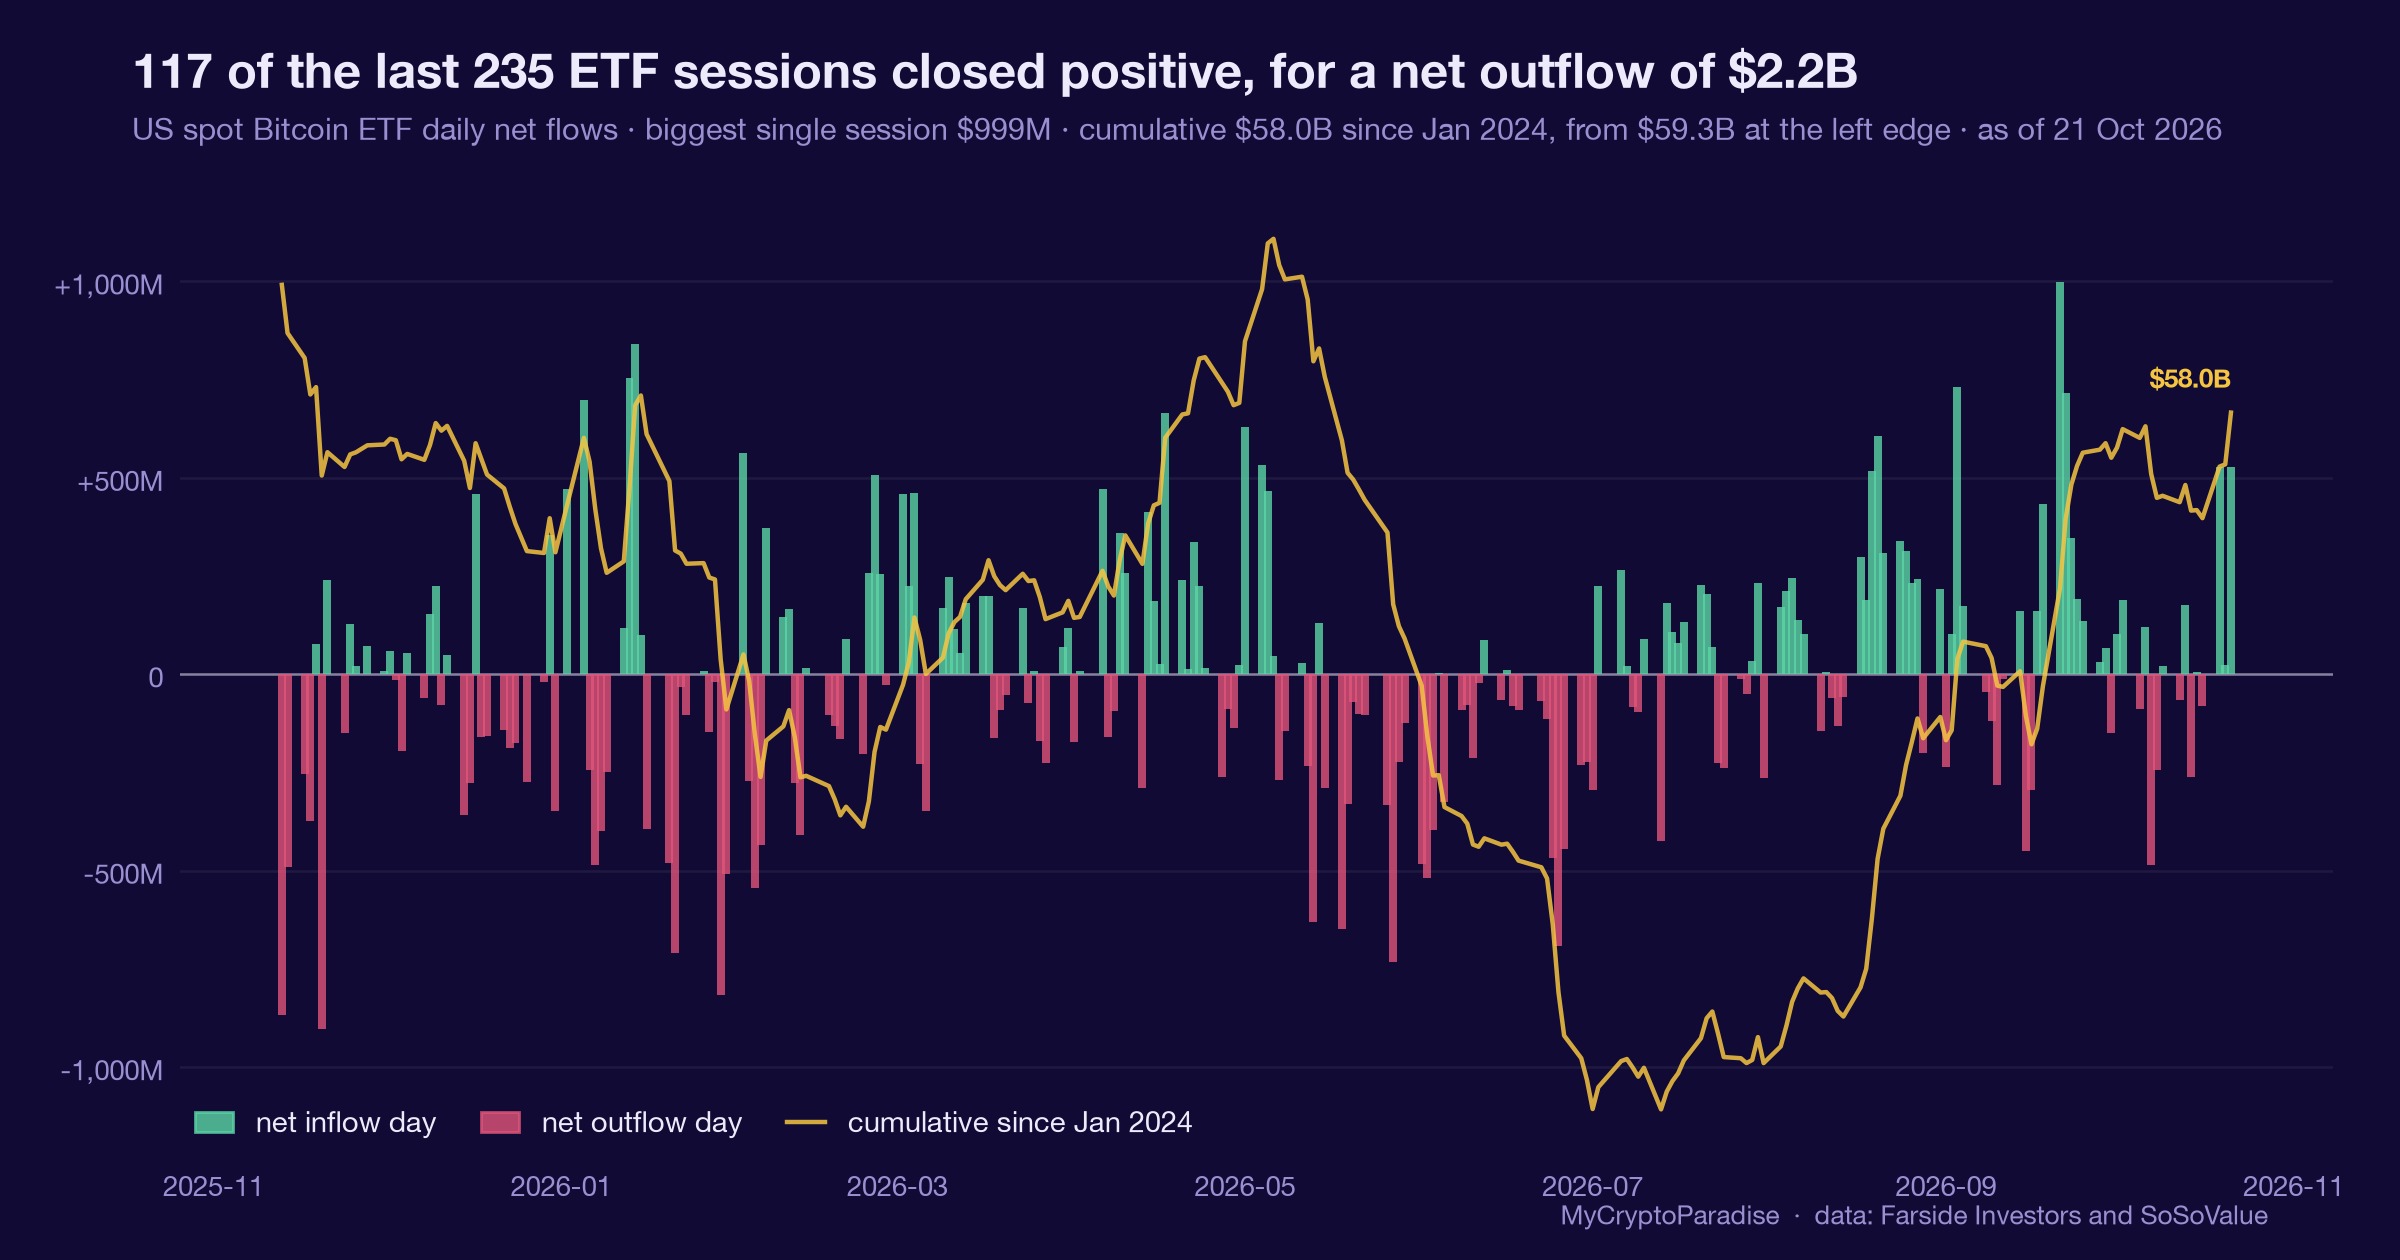
- Cumulative net flow since January 2024
- $58.02B
- What would prove this read wrong
- A single net outflow day that ends the three-day inflow streak, or the week-to-date net sliding back below zero toward last week’s minus $228.6 million outflow.
- Reading taken
- 21 October 2026
- Source
- Our MCP Insights tools, from Farside Investors and SoSoValue. Upstream data published by Farside Investors
A flow is a creation, not a vote
A spot ETF inflow is not sentiment. When demand for shares outruns supply, the fund’s authorized participants create new shares and the issuer buys the underlying Bitcoin to back them. The dollar figure is that creation, settled and reported.
So a net inflow is real coin leaving the float, bought by someone who had to buy it to balance the book. That is its whole appeal: it is forced by mechanics, not surveyed from a mood.
A flow you can reconcile to settlement beats a sentiment poll you cannot. The question is never whether it happened, only whether it persists.
The week flipped from outflow to inflow
Per our MCP Insights ETF flow recon, 21 October 2026 booked a $528.4 million net inflow, led again by BlackRock’s IBIT fund at $235 million, with Fidelity’s FBTC adding $212.7 million and Grayscale’s Mini fund $8.2 million.
That is the third straight inflow day, $1,078.2 million across the three sessions to 21 October, matching the feed’s reported $1.07 billion. The week before, 12 to 16 October, this same series was a $228.6 million outflow.
The 30-day net stands at a positive $1,796.4 million and the five-day flow at $1,000.9 million, while price rose 3.04 percent over those same five days: flows and price aligned, with no divergence flagged.
The tide gauge reads a 90 percent inflow impulse yet assigns no grade and names its edge none, calling the state a little better than even. A gauge that admits it has no edge is more useful than one that always finds a signal.
Three days is a streak, not a trend
The obvious misreading is that $1.07 billion in three days proves demand has turned. It does not. This same series printed an outflow seven sessions earlier, which is how a short streak behaves: it reverses without warning and owes you no continuation.
The honest frame is the gauge’s own: impulse is high, edge is none. Money is moving in, and whether it keeps moving in is precisely the thing a three-day window cannot tell you. We have no calibrated base rate wired for inflow streaks, so we do not quote one.
One confirming window is a lean, not a conclusion. The streak raises the probability that demand is real; it does not resolve it, and only the next prints can.
What is different here
The ParadiseTeam reconciles every flow to settlement and reports the gauge’s edge alongside the number, so a 90 percent inflow impulse that still carries no directional edge is printed as exactly that. Most coverage prints the dollar total and stops, which is how a three-day streak gets mistaken for a trend.
Where this sits among the other reads
A flow number alone decides nothing. It is one input, and it sits beside funding, open interest (OI) and spot taker flow, which today happen to lean the same way.
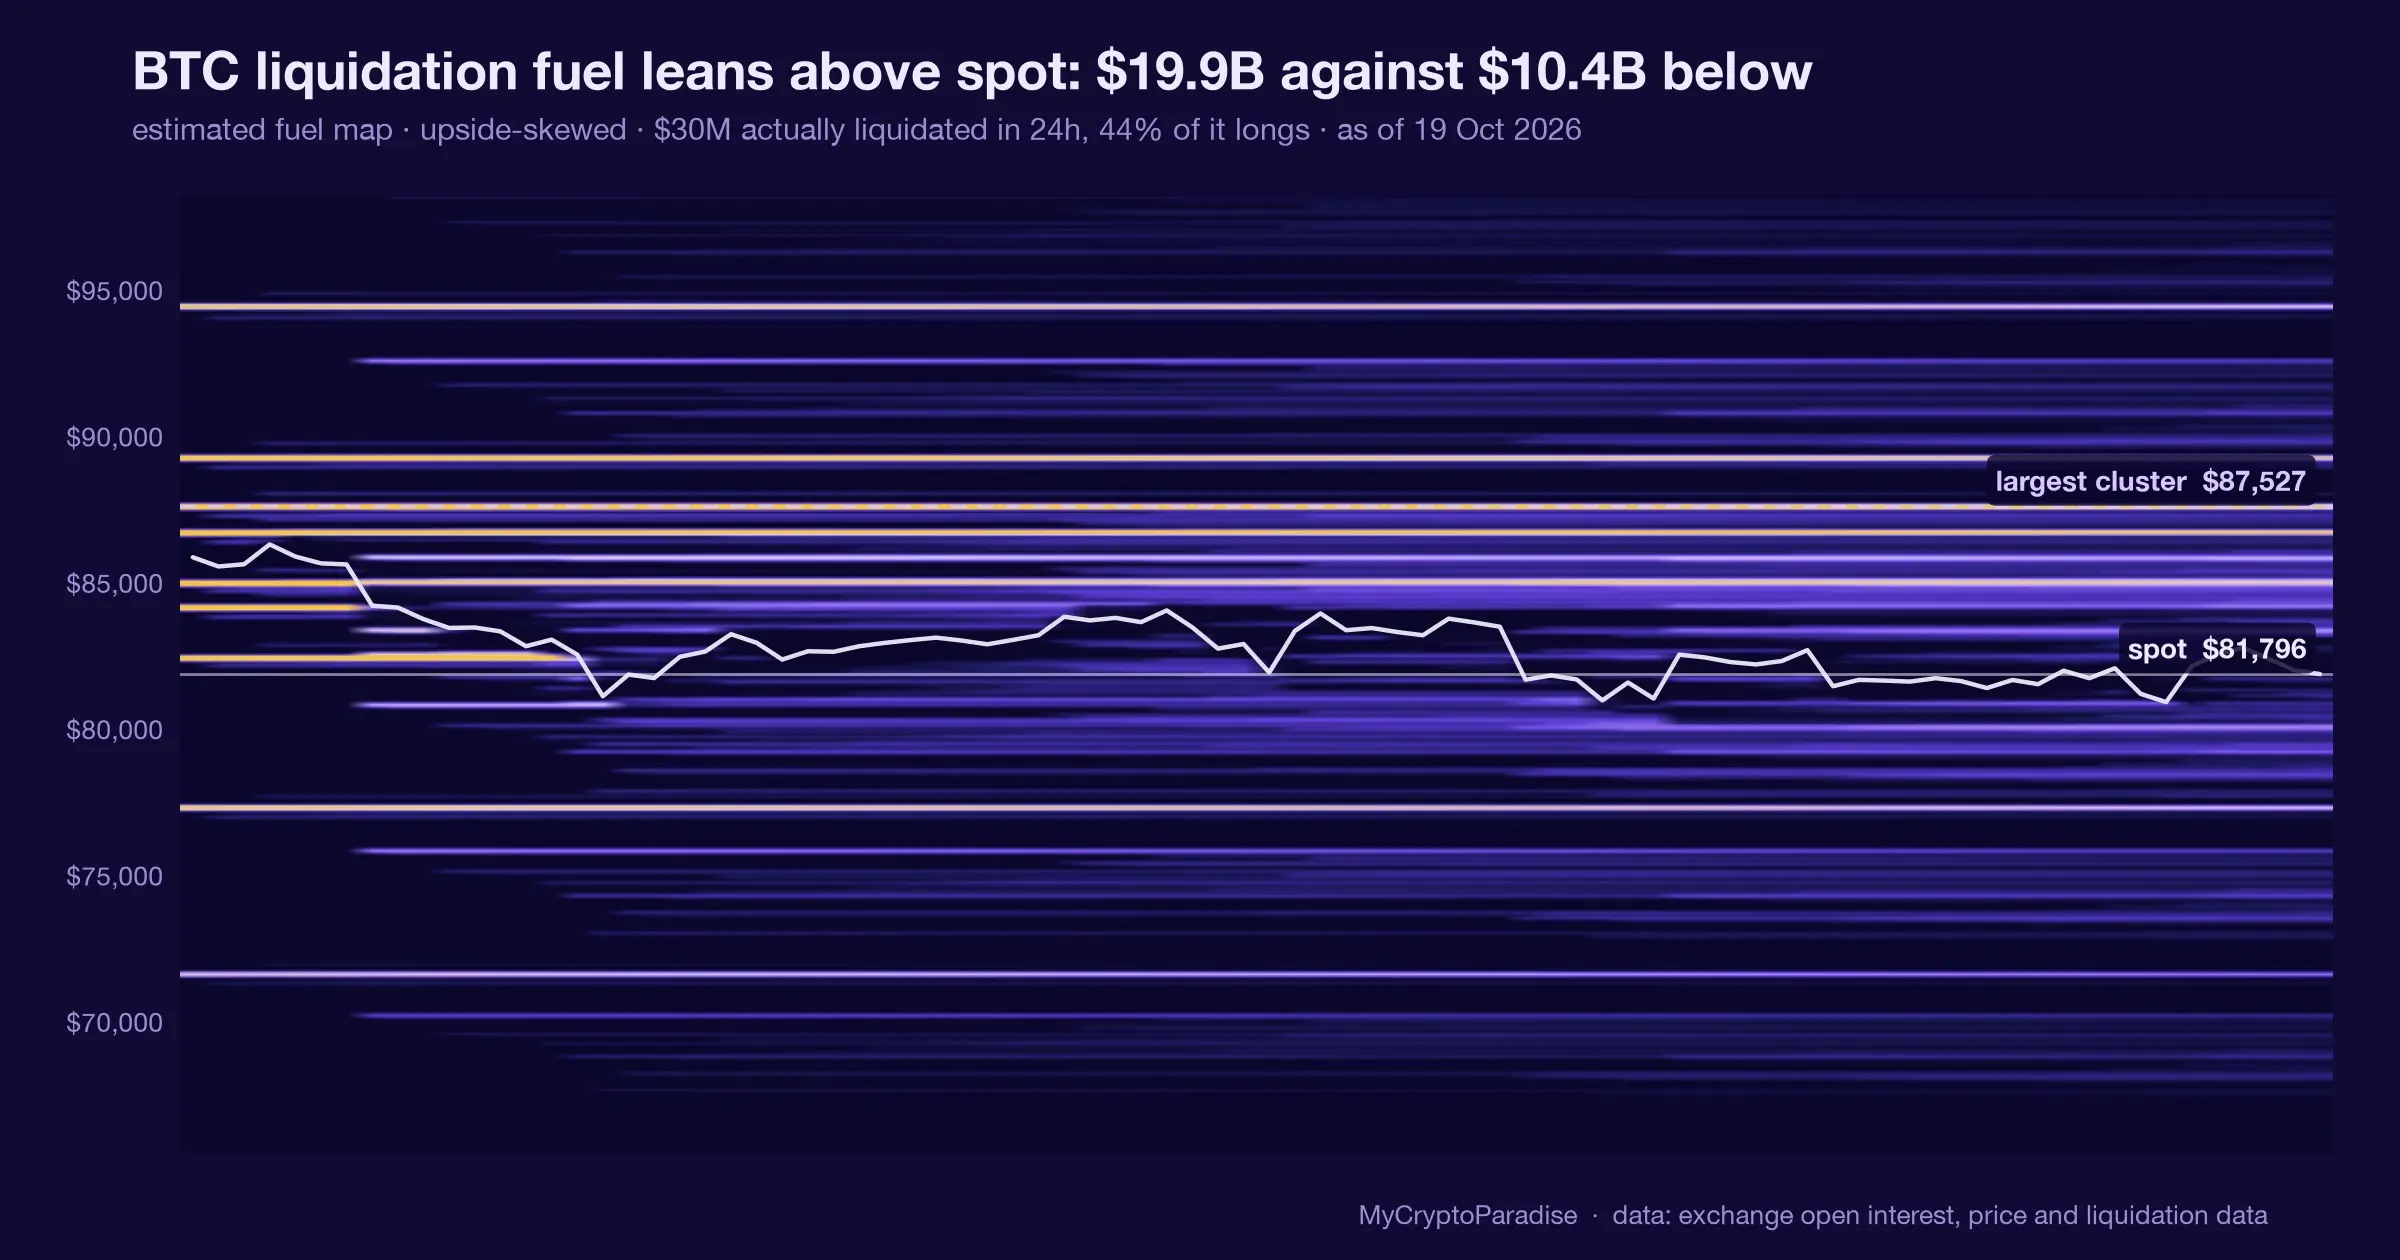
Our order-flow recon reads the advance as spot-backed: unlevered cash buyers leading while perpetual-swap shorts lean against them, with funding a mild 8.11 percent annualized, meaning longs pay shorts a small carry. That is a model estimate, not a calibrated grade, so weight it lightly.
The flows do not contradict that picture, and the feed logs no divergence between flows and price over the last five sessions. Agreement across inputs is comfortable, and comfort is when a single contradicting print costs the most.
The streak has one thing to prove
Here is the test. Last month the funds held a positive 30-day net of $1,796.4 million despite that mid-October outflow week, so the baseline is already constructive, and three more days extend it rather than redraw it.
Our Bitcoin ETF flow tracker shows the streak and the cumulative curve, which is where the read lives from here. What would change it is a single net outflow day that ends the streak, or the week-to-date number sliding back toward last week’s minus $228.6 million.
A streak is only evidence while it continues. The day it breaks it becomes history, and the only honest grade is the one we publish when the next print lands.
Reading Bitcoin ETF flows yourself, step by step
- Start with the single-day net, not the headline total: one $528.4 million day tells you less than its direction and its leader.
- Check the streak length and direction; three inflow days is a lean, while nine or more starts to look like a regime.
- Compare the week-to-date figure against the prior week: a flip from minus $228.6 million to plus $1,078.2 million is the real news.
- Read the 30-day net for the baseline, so a loud three-day run does not overwrite a quietly positive $1,796.4 million month.
- Check whether flows and price agree; when they diverge, the flow is doing something price has not yet confirmed.
The step most people skip is the prior-week comparison: an inflow streak reads very differently after an outflow week than it does after a long run of green.
Every number above is checkable against the live data. Start with the Bitcoin ETF flow tracker, then cross-read the MCP Insights hub and the Crypto Fear and Greed Index.
Act and invalidate
| Scenario | What confirms it | What kills it |
|---|---|---|
| Inflows persist, demand real | Streak extends past five days | A net outflow day |
| Three-day pop fades | Week-to-date rolls back negative | Fresh inflows above prior week |
| Flows and price diverge | Price stalls while inflows continue | Both rise together again |
Posture: Constructive but unconfirmed: the inflows justify patience, not conviction. Stay neutral until the streak either extends or the week-to-date net rolls back under zero.
Frequently asked questions
What counts as a Bitcoin ETF inflow?
An inflow is new money creating fund shares, which forces the issuer to buy spot Bitcoin to back them. It is settled and reported, not a survey of sentiment, so it reflects capital that actually moved rather than opinion.
Is a three-day inflow streak bullish?
It is a constructive lean, not a confirmed trend. Our tide gauge logs a 90 percent inflow impulse but zero directional edge, and the same series printed an outflow only a week earlier, so three days settles little.
How much came in over the three days?
Our ETF flow recon logged $1,078.2 million across the three sessions to 21 October 2026, which matches the feed’s reported $1.07 billion. The 21 October day alone was $528.4 million, led by BlackRock’s fund.
What would invalidate the constructive read?
A single net outflow day that ends the streak, or the week-to-date figure sliding back toward last week’s minus $228.6 million. Either would confirm the reversal the gauge hints at when it refuses to assign an edge.
Does one metric decide the Bitcoin trade?
No. ETF flows are one input beside funding, open interest and spot taker flow. Today those happen to align, but agreement across inputs raises probability rather than removing risk, which is why an invalidation level still matters.
Crypto trading involves substantial risk and is not suitable for everyone. Nothing here is financial advice; it is education only. Never risk more than you can afford to lose.
The private Extras feed, where the ETF flow streak, the tide edge gauge and the order-flow read update intraday with invalidation levels, is part of PRO Paradiser, the intelligence layer behind the ParadiseFamilyVIP strategies.












Join the discussion
No comments yet. Members, share how you are reading this.