- The Distribution Pattern is a market structure that reflects institutional selling activity after an extended bullish trend, where smart money gradually exits positions while retail traders continue buying.
- These patterns are generally bearish by nature. However, confirmation only occurs after support breaks and market structure shifts from bullish continuation into bearish momentum.
- Because distribution phases involve fake breakouts, liquidity grabs, and emotional market behavior, disciplined confirmation and proper risk management are essential for avoiding bullish traps.
The Distribution Pattern is a major market structure that often forms near cycle tops before strong bearish reversals begin. It reflects institutional selling into retail euphoria, creating hidden weakness before the market enters a markdown phase.
At MCP University FREE, this guide is part of our advanced trading series focused on market psychology, liquidity behavior, and smart money execution rather than emotional trading or lagging indicators. By the end, you will be able to identify Distribution Patterns, understand the manipulation behind them, and trade these structures with disciplined precision.
Introducing the Distribution Pattern
The Distribution Pattern is a market structure that signals weakening bullish momentum and increasing institutional selling pressure after an extended uptrend. Unlike healthy bullish consolidations that support continuation, distribution phases reveal hidden weakness near market highs.
The pattern forms when the price begins consolidating near resistance while smart money gradually exits positions into strong public demand. During this phase, the market often experiences sideways price action, failed breakouts, increased volatility, liquidity grabs, and weakening bullish momentum.
Although the market may still appear bullish initially, institutions quietly distribute supply into aggressive buying pressure from emotional traders. As momentum weakens, support eventually breaks, market structure turns bearish, and the markdown phase begins.
Distribution patterns frequently appear near market cycle tops, major resistance zones, euphoric bullish conditions, and overextended rallies. Understanding these structures helps crypto traders protect profits, avoid emotional entries, and identify high-probability bearish reversals before major market declines occur.
Key Characteristics of Distribution Patterns
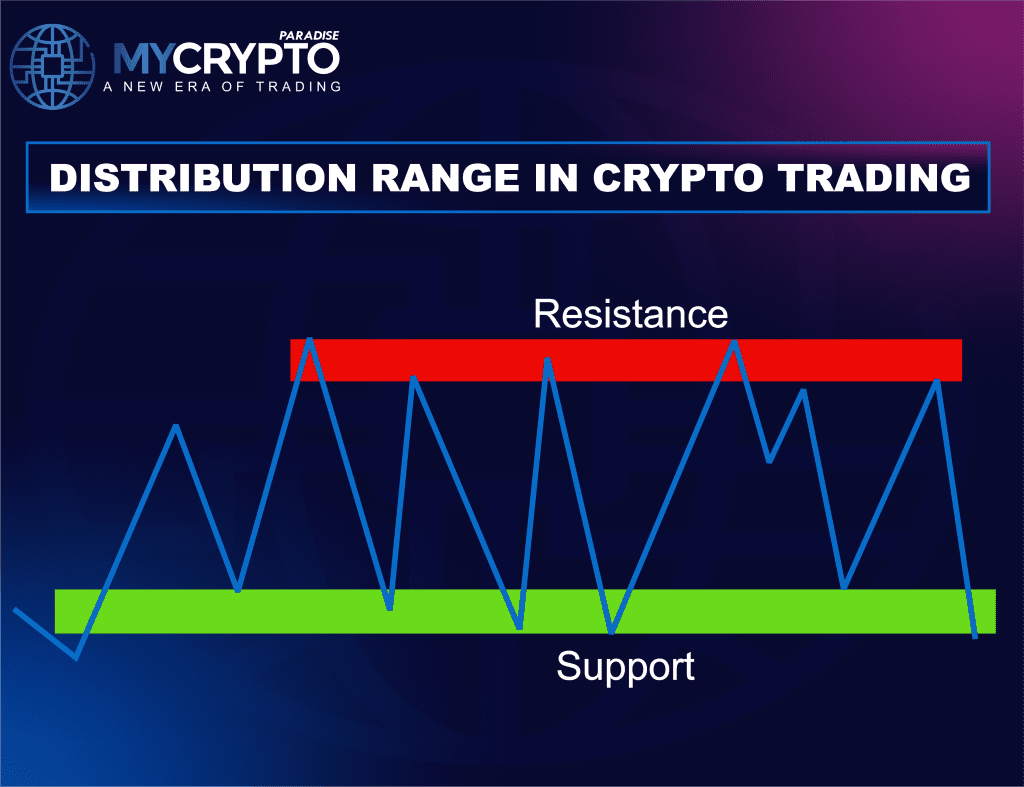
Sideways Consolidation Near Market Highs
One of the main characteristics of distribution is sideways consolidation after a strong bullish trend. Instead of continuing upward aggressively, the price begins moving inside a broad range near resistance.
This consolidation reflects a temporary equilibrium while institutions gradually distribute positions in public demand.
Weakening Bullish Momentum
As the distribution structure develops, bullish momentum weakens despite temporary higher highs. Breakouts lose strength. Rejection wicks increase. Price expansion slows, signaling buyer exhaustion and growing institutional selling pressure near market tops.
Increased Volatility and Fake Breakouts
Distribution environments are often highly volatile because institutions create liquidity through aggressive price manipulation and emotional traps. This frequently creates fake bullish breakouts, stop hunts, liquidity grabs, and sharp reversals. Retail crypto traders often become trapped in false continuation setups before the market moves lower.
Heavy Volume Near Resistance
Volume analysis becomes extremely important during distribution phases because volume often increases near resistance while price struggles to continue higher. This imbalance frequently signals institutional selling, weakening bullish demand, and exhausted continuation momentum.
Strong volume without strong bullish continuation can be a major warning sign of hidden distribution and potential market reversal.
Breakdown of Market Structure
As distribution develops, the bullish market structure begins to weaken completely. Lower highs, failed continuation attempts, support breakdowns, and expanding bearish momentum signal growing seller control. Once support breaks decisively, the market often enters an aggressive markdown phase.
Types of Distribution Patterns in Crypto Trading
Normal Distribution
A normal distribution pattern, also known as a bell curve, occurs when the majority of trading activity is concentrated around the average price level. In such cases, the market is considered stable, with relatively balanced buying and selling pressure.
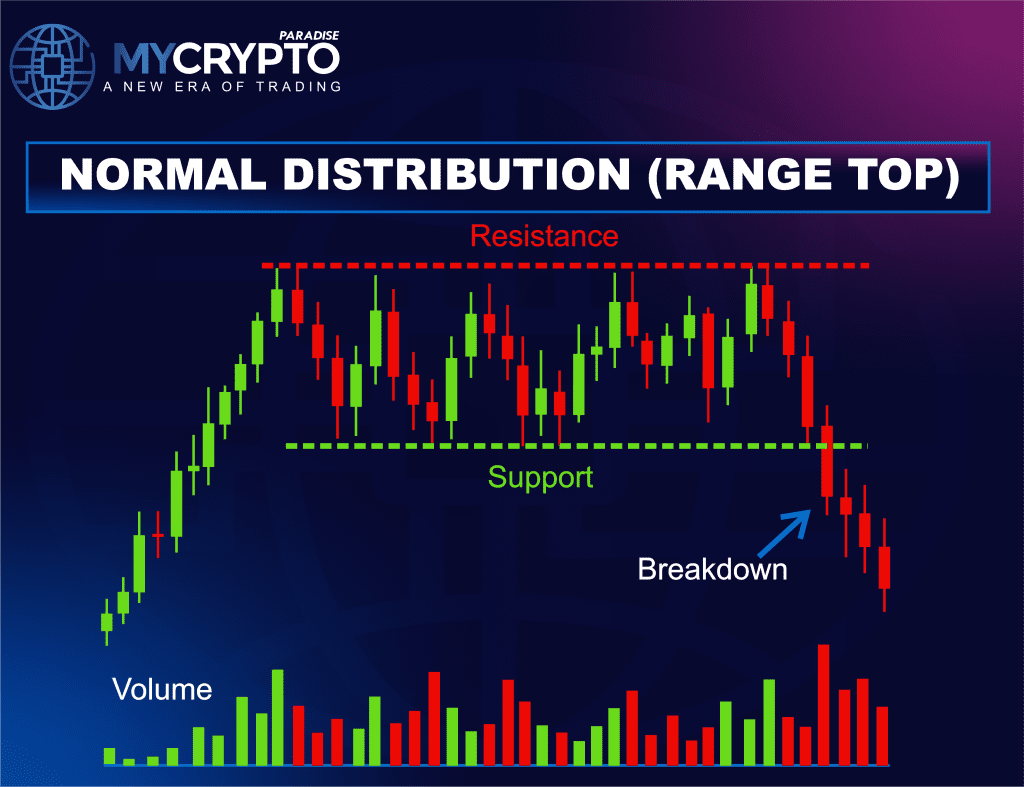
Normal distribution patterns suggest that the market is in equilibrium, and traders may expect limited price fluctuations.
Skewed Distribution
Skewed distribution patterns arise when there is an imbalance between buying and selling pressure in the market. This imbalance can result in either a positive skew (skewed to the right) or a negative skew (skewed to the left).
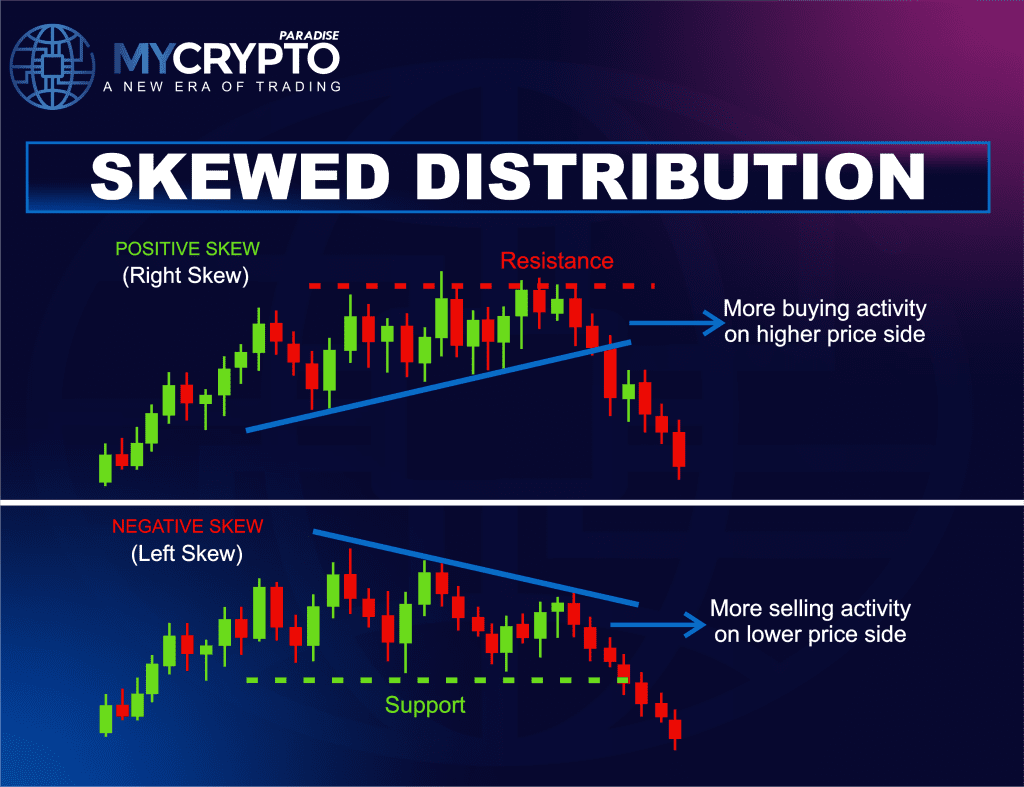
Positive skew indicates a higher concentration of buying activity, potentially leading to price increases. Conversely, negative skew suggests a higher concentration of selling activity, potentially leading to price decreases.
Bimodal Distribution
Bimodal distribution patterns occur when there are two distinct peaks of trading activity in the market. This indicates the presence of two groups of traders with different trading strategies or sentiments.
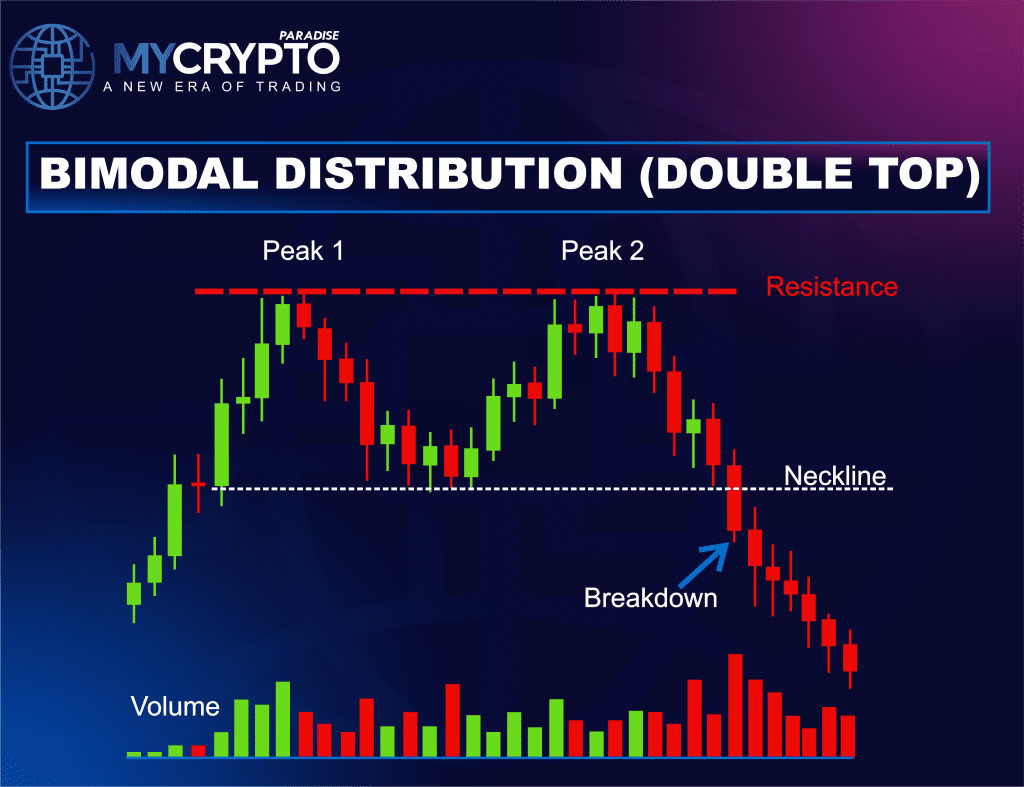
Bimodal distributions may suggest periods of uncertainty or conflicting market views. Crypto traders should closely monitor such patterns as they could potentially indicate upcoming price reversals or significant market shifts.
Major Distribution Patterns
Wyckoff Distribution Pattern
The Wyckoff Distribution Pattern is one of the most advanced and respected institutional distribution models in technical analysis.
This structure reflects a gradual transfer of assets from smart money to retail participants before a bearish markdown phase begins.
Key phases often include:
- Buying Climax (BC)
- Automatic Reaction (AR)
- Secondary Test (ST)
- Upthrust (UT)
- Sign of Weakness (SOW)
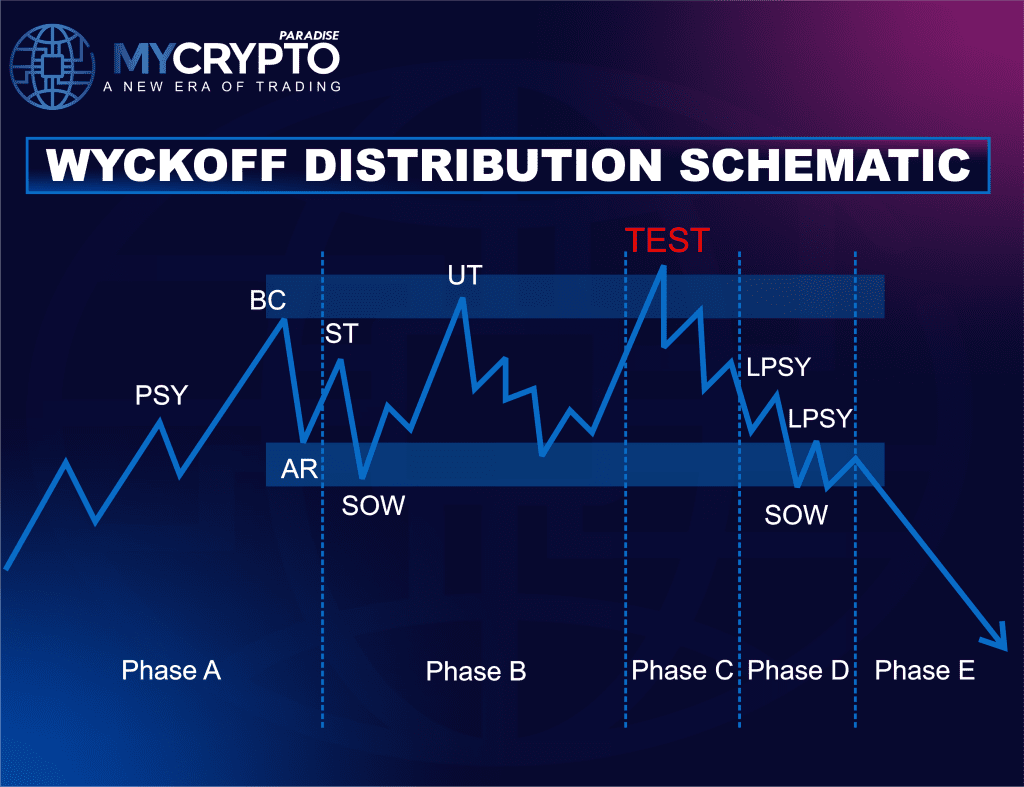
The Wyckoff model is heavily driven by market psychology, liquidity engineering, and institutional selling behavior. Want to learn more about this pattern? Click Here
Double Top Distribution
The Double Top is a classic bearish reversal structure that forms after a strong bullish trend. Price tests a major resistance level twice but fails to break higher, signaling weakening bullish momentum and increasing sell-side pressure.
As buyers lose control, smart money often begins distributing positions near the highs. Once the neckline support breaks, bearish continuation usually accelerates rapidly, confirming the transition from accumulation to markdown. Want to learn more about this pattern? Click Here
Head and Shoulders Distribution
The Head and Shoulders Pattern is one of the most reliable bearish distribution structures in crypto trading.
The pattern forms through:
- A left shoulder
- A higher peak (head)
- A lower right shoulder
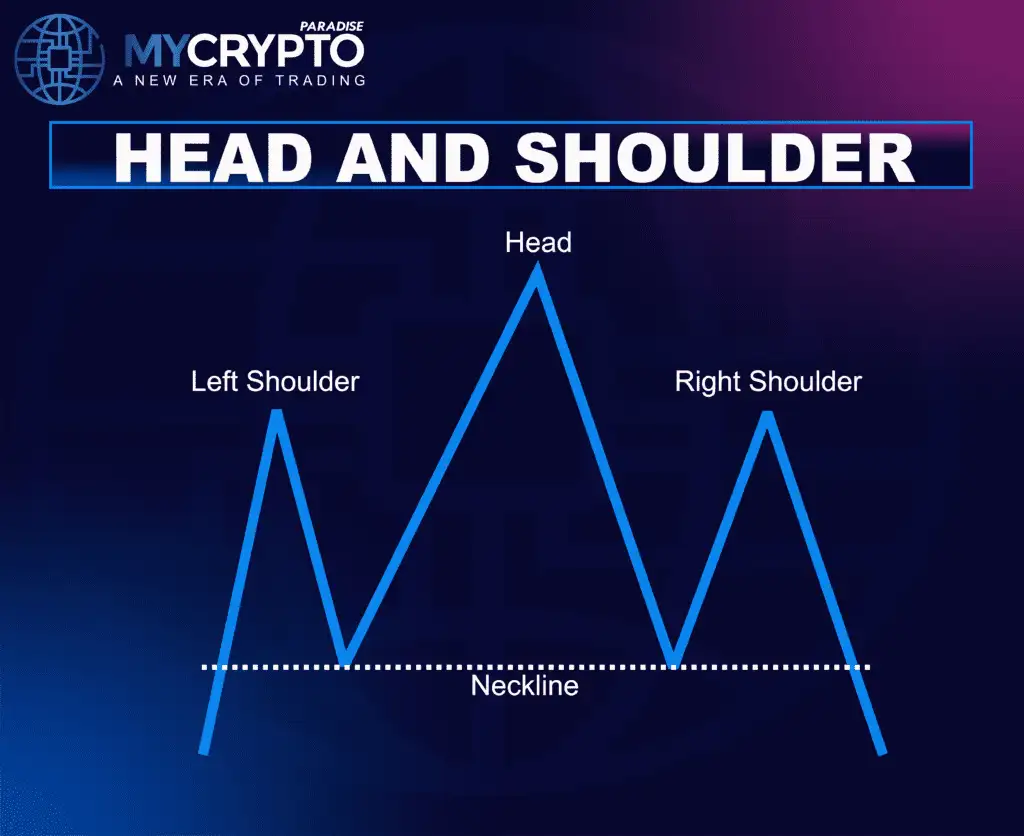
This reflects the gradual exhaustion of bullish momentum and increasing institutional selling pressure near market tops. A confirmed neckline breakdown often signals bearish continuation and market reversal. Want to learn more about this pattern? Click Here
Broadening Distribution Pattern
The Broadening Distribution Pattern reflects increasing volatility and emotional instability near market highs. Instead of forming price compression, the market creates higher highs, lower lows, and expanding volatility swings.
This structure signals a growing imbalance between buyers and sellers, often trapping traders on both sides of the market before a major reversal occurs. As volatility expands, smart money frequently uses the unstable environment to distribute positions before the market enters a bearish markdown phase.
Rising Wedge Distribution
The Rising Wedge is a bearish distribution structure where price continues rising within a narrowing range while bullish momentum gradually weakens. Although the trend initially appears strong, buying pressure begins fading as the pattern develops.
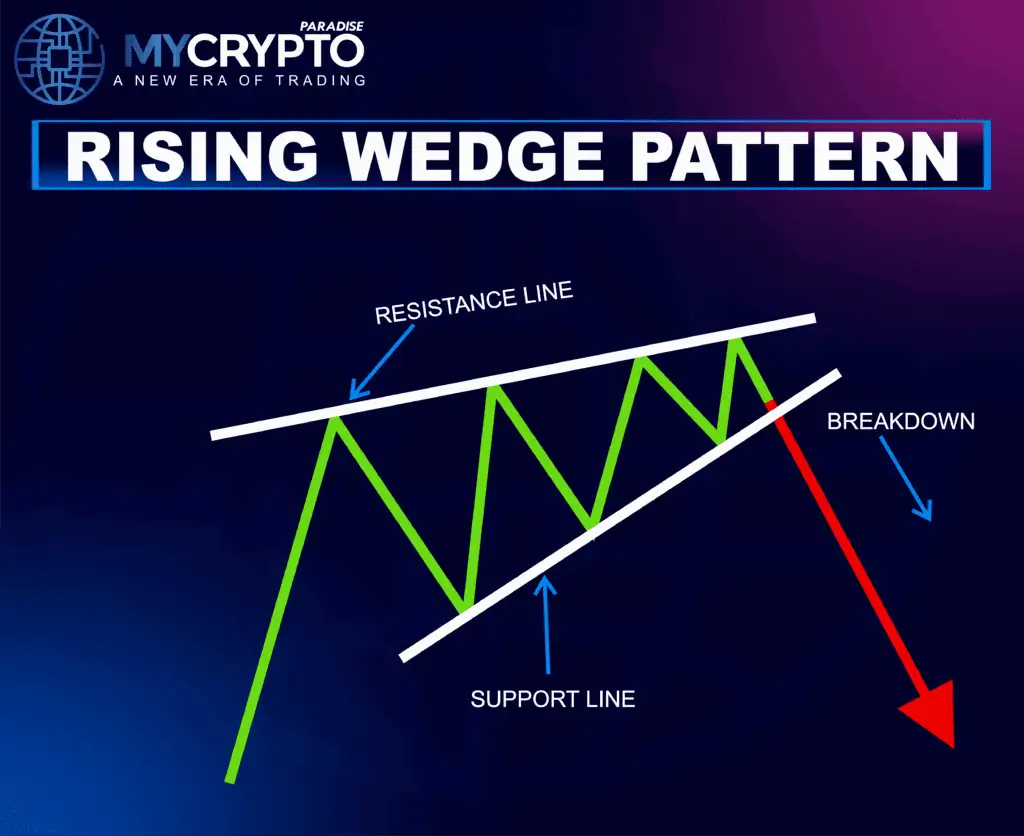
This structure often reflects hidden institutional selling near market highs as retail traders continue buying the breakout expectation. A confirmed breakdown below wedge support typically signals bearish continuation and the beginning of a markdown phase. Want to learn more about this pattern? Click Here
How to Identify Distribution Patterns
Identifying reliable distribution structures requires patience and a structured approach. Crypto traders must focus not only on chart formations but also on market behavior, volume activity, and liquidity conditions.
Confirm Prior Bullish Trend
Distribution patterns usually appear after strong bullish rallies or euphoric market conditions. Without a clear prior uptrend, the probability of true distribution decreases significantly.
Watch for Failed Breakouts
Repeated breakout failures near resistance often signal weakening bullish momentum and hidden institutional selling pressure. Strong markets typically continue aggressively after a breakout. Distribution markets struggle to sustain continuation.
Analyze Volume Behavior
Volume analysis plays a critical role during distribution phases.
Warning signs often include:
- Heavy volume near resistance
- Weak continuation after breakout
- Increasing rejection candles
- Volume divergence
These behaviors frequently indicate smart money activity.
Observe Market Structure Shifts
As distribution develops, the bullish market structure gradually weakens.
Important warning signs include:
- Lower highs
- Failed continuation moves
- Support breakdowns
- Increasing bearish momentum
Structure shifts often confirm the transition into bearish conditions.
Wait for Confirmation
Finally, avoid entering bearish positions too early.
Instead, wait for:
- Support breakdown confirmation
- Increased bearish volume
- Retest rejection
- Clear bearish continuation structure
Patience significantly improves trade quality and reduces exposure to fakeouts.
Market Psychology Behind Distribution
The Distribution Pattern is deeply rooted in market psychology because it reflects a transition from bullish confidence into hidden weakness.
Initially, retail crypto traders remain highly optimistic after a strong bullish continuation. Many believe the market will continue rising indefinitely. However, institutions understand that euphoric conditions create ideal liquidity for selling positions.
As the pattern develops:
- Smart money sells into public demand
- Retail traders chase breakouts emotionally
- Fake bullish continuation traps become common
- Liquidity grabs have increased significantly
At this stage, many traders fail to recognize weakening momentum because the price still appears relatively strong externally. Eventually, institutions complete the distribution process, support breaks, and bearish continuation begins. Therefore, the distribution pattern represents a transfer of assets from experienced market participants to emotional crypto traders before major market declines occur.
How to Trade Distribution Patterns
Trading distribution patterns requires patience, confirmation, and disciplined execution. Attempting to predict market tops aggressively often leads to losses because distribution structures can remain active longer than expected.
Breakdown + Retest Strategy
The most reliable way to trade distribution is through a confirmed breakdown followed by a retest. This approach helps traders avoid emotional entries and aligns positions with real market weakness.
Entry
Wait for price to:
- Break below the key support
- Confirm bearish market structure
- Show increased selling pressure
Avoid entering immediately during the initial breakdown candle. Instead, wait for the market to retest the broken support level.
If support flips successfully into resistance, enter the trade after bearish confirmation, such as:
- Rejection wicks
- Bearish continuation candles
- Weak bullish reaction
Stop-Loss Placement
Risk management is critical during distribution trading because volatility, liquidity grabs, and fake breakdowns are common near market tops.
For bearish setups, stop losses are typically placed above the retest high or above the main distribution resistance zone. This placement helps protect against failed breakdowns while allowing enough room for natural market volatility and smart money manipulation.
Profit Target
To calculate realistic bearish targets, measure the height of the distribution range and project that distance downward from the breakdown point. This approach provides a logical structure-based target rather than relying on emotional expectations or random price predictions.
Using the distribution range helps crypto traders maintain disciplined risk-to-reward planning while aligning targets with actual market structure and momentum.
Volume & Confirmation Guide
Volume analysis plays a major role when trading distribution patterns because it helps crypto traders distinguish between genuine bearish continuation and temporary fake breakdowns.
During Distribution
Volume often becomes inconsistent during the consolidation phase due to institutional activity and emotional trading behavior.
Common signs include:
- Heavy volume near resistance
- Weak bullish continuation
- Sharp rejection candles
- Increased volatility spikes
During Breakdown
A valid bearish breakdown should typically show:
- Strong bearish volume expansion
- Large momentum candles
- Aggressive selling pressure
- Increased market participation
Weak breakdown volume often significantly increases fakeout risk.
Additional Confirmation Signals
RSI Divergence
Bearish RSI divergence often signals weakening momentum even as price continues forming higher highs. This reflects fading buying strength and increasing probability of a bearish reversal.
Market Structure Shift
A transition from higher highs to lower highs and lower lows confirms a bearish shift in market structure and signals growing seller control.
Liquidity Grab Rejections
Sharp reversals following fake breakouts often indicate institutional distribution, where smart money traps breakout traders before pushing the price lower.
Higher Timeframe Resistance
Distribution patterns forming near major higher timeframe resistance zones typically produce stronger and more reliable bearish reactions.
Common Mistakes When Trading Distribution
- Shorting Too Early
Many crypto traders identify distribution early but enter before confirmation, increasing exposure to fake breakouts, liquidity grabs, and extended consolidation. Waiting for confirmation improves trade precision and reduces unnecessary risk.
- Ignoring Volume Behavior
Volume provides critical insight into institutional activity. Ignoring volume divergence and weakening continuation often leads to poor market interpretation.
- Emotional Trading
Bull market euphoria can distort judgment and cause crypto traders to ignore bearish warning signs. Professional traders remain objective even during highly emotional market conditions.
- Poor Risk Management
Distribution environments are volatile and unpredictable. Using excessive leverage or weak stop-loss placement can result in heavy losses. Proper risk management and disciplined execution remain essential.
Conclusion
The Distribution Pattern is one of the most important market structures in crypto trading because it often signals weakening bullish momentum before major bearish reversals begin. Its volatile behavior, fake breakouts, and liquidity manipulation make it a challenging environment for inexperienced crypto traders.
However, for crypto traders who understand market psychology, liquidity dynamics, and smart money behavior, distribution patterns can offer high-probability bearish opportunities.
At ParadiseFamilyVIP🎖️, traders are trained to handle advanced structures like distribution patterns with institutional-level precision and discipline. From identifying liquidity grabs and market manipulation to executing confirmation-based trades with structured risk management, every step is designed to build a professional trading mindset.
👉 Join ParadiseFamilyVIP🎖️ to trade crypto markets with confidence, structure, and institutional-level precision.
FAQS
What is a distribution pattern in crypto trading?
A distribution pattern is a market structure where institutions gradually sell positions during bullish and euphoric market conditions before a bearish reversal begins.
How can traders confirm a distribution breakdown?
A confirmed breakdown usually occurs when key support or neckline levels break with strong bearish momentum and increasing sell-side pressure.
What indicators work best with distribution patterns?
Traders commonly combine distribution structures with RSI divergence, volume analysis, liquidity grabs, and higher timeframe resistance zones for stronger confirmation.
What is the difference between distribution and accumulation?
Accumulation occurs when institutions buy during fear and bearish sentiment, while distribution occurs when institutions sell during bullish and euphoric market conditions.
Are distribution patterns reliable in crypto markets?
Distribution patterns can be highly effective when combined with market structure, liquidity analysis, and proper risk management rather than used in isolation.
Do distribution patterns ever fail?
Yes, distribution patterns can fail, especially during strong bullish market conditions or false breakdowns. This is why confirmation through volume, market structure shifts, liquidity behavior, and proper risk management is essential before entering a trade.