- The Bearish Engulfing pattern is a bearish reversal pattern that typically forms after a strong impulsive upward move or at key resistance levels.
- A confirmed close of the engulfing candle, supported by strong selling momentum, alignment with resistance or supply zones, and disciplined risk management, increases the precision of the setup.
- The pattern becomes more effective when it aligns with the broader market structure, higher timeframe trend direction, complementary technical confluence, and awareness of major market news or volatility conditions.
A lot of crypto traders get the Bearish Engulfing pattern wrong. The real power of this setup isn’t about picking tops out of thin air. It’s spotting the moment when buyers lose control, and sellers show up in force. When you use the Bearish Engulfing pattern the right way, you’re not just making a wild guess. You’re actually moving with the new momentum, stacking the odds in your favour.
This guide is part of our MCP University FREE advanced learning series for crypto traders. You’ll see how to spot, confirm, and trade the Bearish Engulfing pattern with real clarity, discipline, and the kind of precision the pros use.
Introducing the Bearish Engulfing Pattern
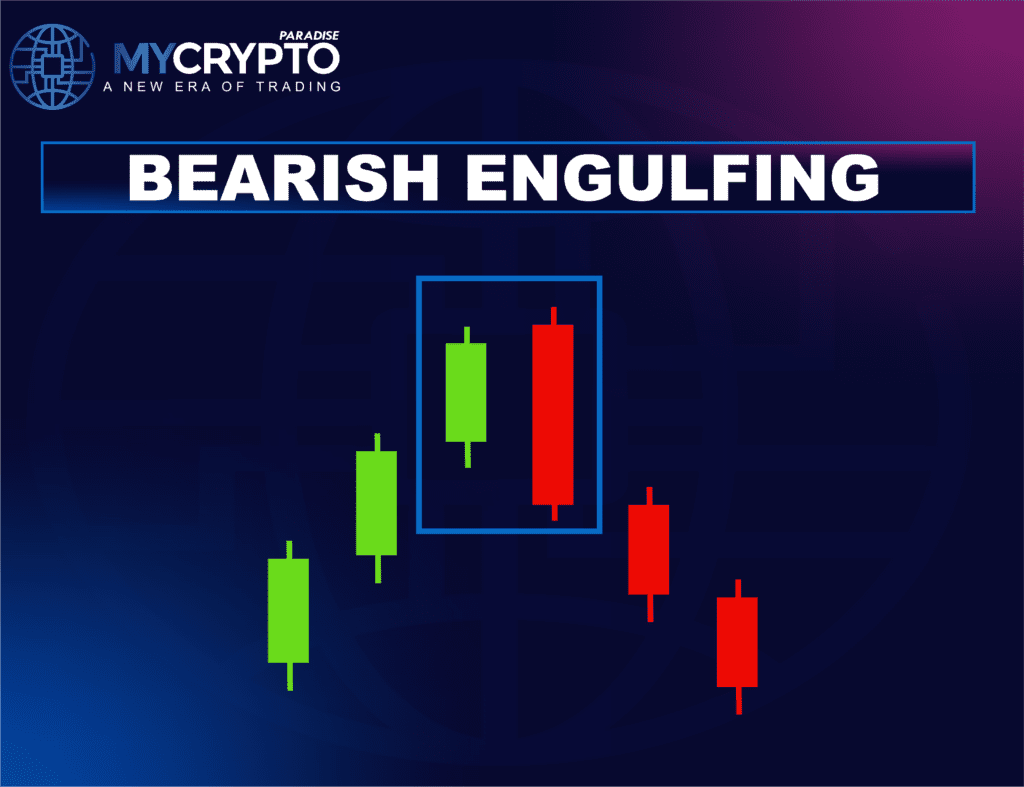
Let’s talk about the Bearish Engulfing pattern. Imagine the market’s been climbing, green candles stacking up, and buyers feeling good. Then, out of nowhere, a big red candle shows up and swallows the last green one whole. This isn’t random selling. It’s a clear sign that sellers just took the wheel, pushing back hard enough to soak up all that buying pressure and drag prices down.
The Bearish Engulfing pattern isn’t about guessing where the top is. It’s about spotting a real shift in momentum. The sharp crypto traders keep an eye out for it around tough resistance spots, supply zones, or after a run on stops above old highs. They are not making wild predictions, they’re responding to what’s right in front of them.
Still, don’t get fooled. Not every red candle after a green one counts. There are rules. If those aren’t met, you’re just looking at noise.
How to Identify the Bearish Engulfing Pattern
Here’s how you spot the real deal:
Prior Bullish Move
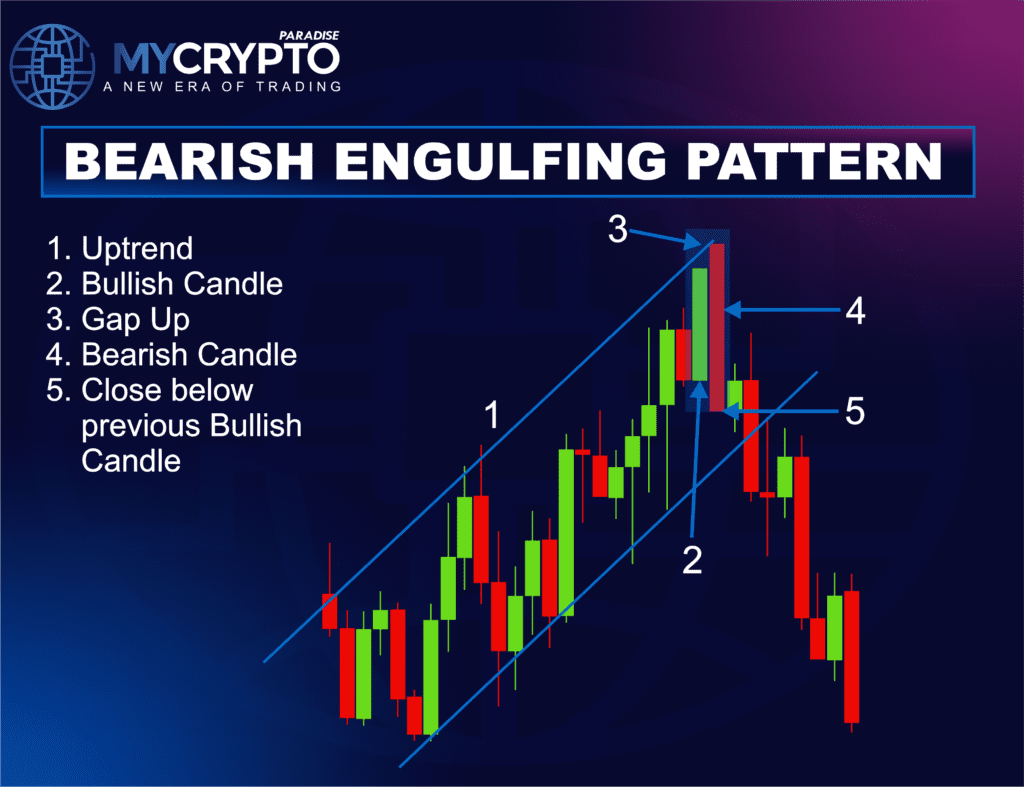
First, you need a proper bullish run. The market should be moving up, preferably with some force. If there’s no strong rally, the pattern doesn’t mean much.
The Bullish Candle
Next, you need a solid green candle, something that actually shows buyers in control, not just a tiny blip. This sets the stage for the reversal.
The Engulfing Candle
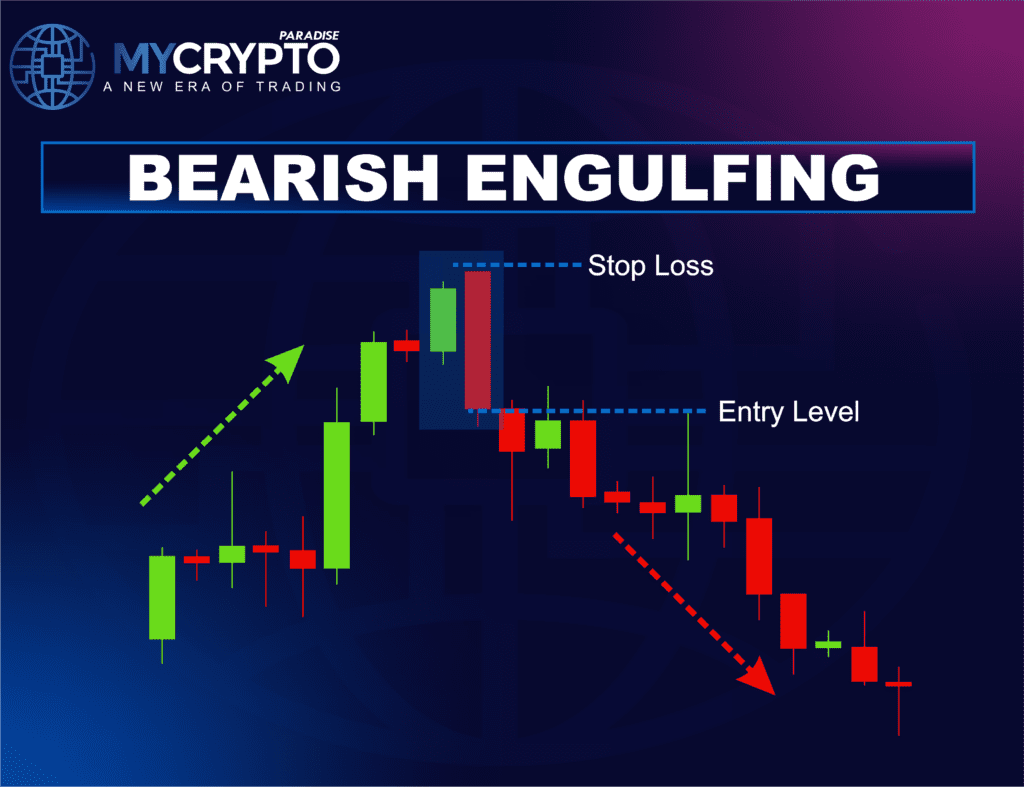
Then comes the key: a strong red candle that completely covers the previous green candle’s body. It needs to close well below where that green candle opened, ideally near its own low. That’s your signal that sellers have taken over.
If the red candle is weak or only partially covers the green one, forget it. The setup just isn’t there. But when everything lines up at the key level, this pattern packs a punch.
Get a feel for these details, and you’ll be way ahead of crypto traders who jump in on emotion instead of waiting for real proof.
Is the Bearish Engulfing Pattern Bullish or Bearish?
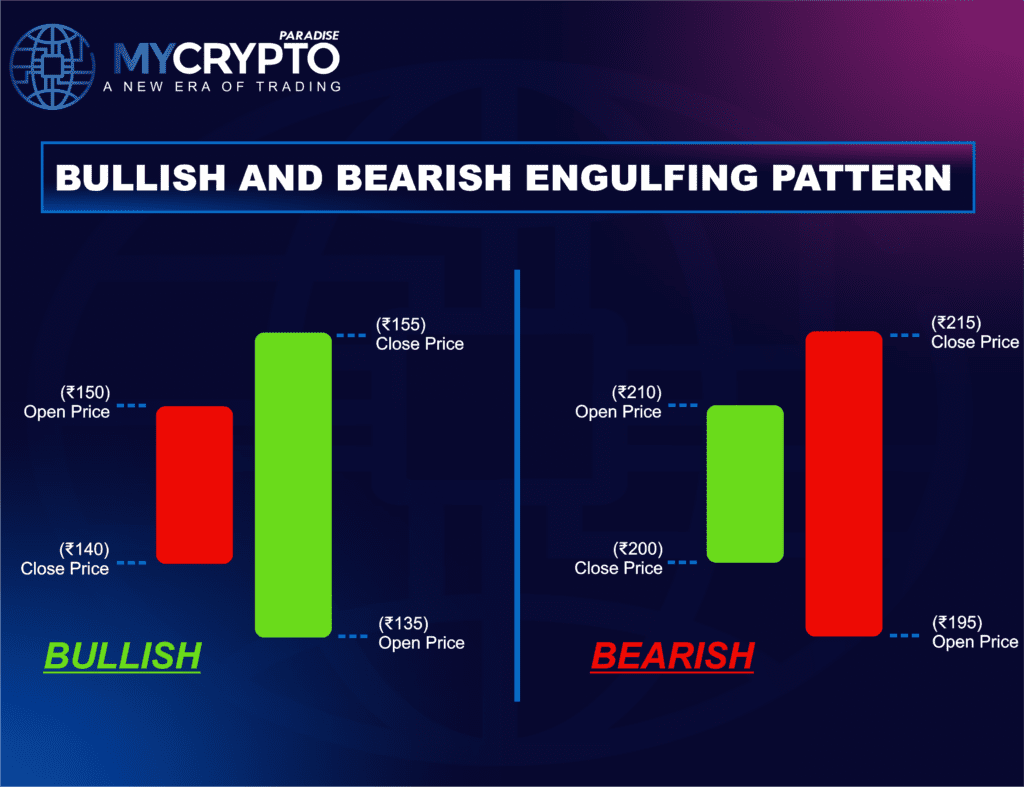
Engulfing patterns have two types: bullish and bearish. By name, the Bearish Engulfing Pattern is bearish. But its bearish move really depends on what’s happening around the pattern.
Bearish Reversal Within a Downtrend
- Some of the best setups occur when the market is in a downtrend. Portrait Bitcoin is sliding on the daily chart. Suddenly, it bounces up into a resistance zone on the 4-hour chart. Traders start feeling a little too hopeful. Then a bearish engulfing candle pops up on that 4-hour timeframe, and volume picks up.
- This isn’t just some random blip. It’s the trend continuation alarm that shows sellers are still in charge, and the engulfing candle just shows momentum is swinging back their way. These trades usually play out in a pretty orderly way; you get a bounce, a sharp rejection, and then the move picks up speed again.
Potential Major Trend Shift
- But let’s flip the script. What if the price has been climbing for a while, and now it runs into a big resistance level? Suddenly, a bearish engulfing candle shows up. Sellers are pushing back hard, soaking up all that buying pressure. It’s a warning sign which shows that the bulls are running out of steam, and maybe, just maybe, some folks are starting to sell quietly right at the top. Still, one candle won’t undo months of gains.
- A real trend change needs more proof. The market has to start showing lower highs and lower lows. Sellers need to step in every time the price bounces. Without all that, the move might just be a quick shakeout, not a full-blown reversal.
How Reliable Is the Bearish Engulfing Pattern?
The Bearish Engulfing pattern has a solid reputation, but it really depends on where it shows up and what else is happening in the market. It’s not a magic bullet.
Statistical Performance
- You’ll see the best results when this pattern forms right at a clear resistance point, especially after a strong rally, and even more so on daily or weekly charts. Higher timeframes just carry more weight.
- Wait for the candle to close before jumping in, and don’t get ahead of yourself, especially if the market’s moving weirdly or there’s barely any volume. Jumping in early, before you get confirmation, usually cuts your edge.
Key Conditions That Increase Reliability
- A few things make this setup stronger. First, you need a real move up into the pattern because if buyers weren’t really in control to start with, the signal loses a lot of its punch.
- Next, pay attention to the structure. You’re looking for a strong green candle followed by a red candle that swallows it whole. That’s a real sign that sellers have taken over. The more obvious and aggressive the rejection, the better it gets.
- Reliability goes up if the pattern forms at a key level, like strong resistance, supply zones, or after the market has just run stops above a previous high. If you see this pattern lining up with resistance on a higher timeframe or fitting into a bigger bearish trend, that’s even better.
How to Trade the Bearish Engulfing Pattern
Here’s a straightforward way to trade it:
Entry Strategy
- The safest entry is after the bearish engulfing candle closes with authority. You need that confirmation. Some people play it extra safe and wait for a little pullback into the candle’s body before going short.
- That lets you use a tighter stop and can improve your risk-to-reward, especially if price retests the resistance that kicked off the move.
Stop Loss Placement
- Put your stop loss above the high of the engulfing candle. If the price shoots back above that level, the setup probably isn’t working. If you got in on a small pullback, you might tweak your stop just above the latest swing high.
- Figure out your risk before you hit the button because position sizing and risk control matter more than any single pattern.
Take Profit Targets
- Most crypto traders shoot for the next support, demand zone, or recent swing low as their first target, and it makes a lot of sense because these are logical places for the price to react.
- You can always take some profit there, then let the rest of the trade run towards a bigger target if momentum stays strong. Trailing stops can help you lock in gains if the move keeps going.
Using Volume With the Bearish Engulfing Pattern
- Volume matters. Ideally, you should watch for fading volume as the market rallies up into the key levels because this shows that buyers are getting tired.
- When the bearish engulfing candle hits, a spike in volume says sellers are stepping in. If the pattern shows up on thin volume, the move often fizzles out.
This setup can work really well, but only if you’re picky about where you trade them, wait for real confirmation, stick to your risk rules and never forget that discipline beats excitement every time.
Bearish Engulfing Versus Similar Chart Patterns
Bearish Engulfing Pattern can look a lot like other bearish reversal patterns in crypto charts, but they’re different. What makes Bearish Engulfing stand out is how obvious it is, the way it forms, and you can really see the power shift from buyers to sellers. Plus, it usually gives you a pretty clean spot to jump in and set your risk.
Bearish Engulfing Versus Shooting Star
- The Shooting Star is just a single candle with a tiny body huddled near the lows, with a long upper wick sticking out on top. It’s like the price tried to climb, got pushed back down, and then closed near the bottom. Sure, that’s a sign of rejection, but honestly, by itself, it’s not always enough to get traders excited about a reversal.
- Now, Bearish Engulfing has a different story. This pattern doesn’t just tap the brakes; it slams them. The bearish candle swallows up the previous bullish one, showing sellers didn’t just stop the rally, but they took charge and pushed buyers out of the way. It’s a much clearer shift in momentum, and you can see it right on the chart.
- Crypto traders like the Bearish Engulfing pattern because it’s easier to work with. You get a clear high to set a stop, a decisive close, and a stronger sense of direction. That structure makes planning a trade simpler than trying to read into a single wick like the Shooting Star.
Evening Star Versus Bearish Engulfing
- An Evening Star takes its time. You have to wait for three candles: first, a strong bullish one; then a small indecisive candle in the middle; and finally, a bearish candle that turns things around. It’s reliable, but it doesn’t form quickly.
- Now, Bearish Engulfing is a lot faster. It only takes two candles. Right after a bullish candle, a big bearish one steps in and swallows the move whole. The shift is sudden and often sharp. That’s why crypto traders who want quicker signals are drawn to it because they don’t have to wait for the third candle.
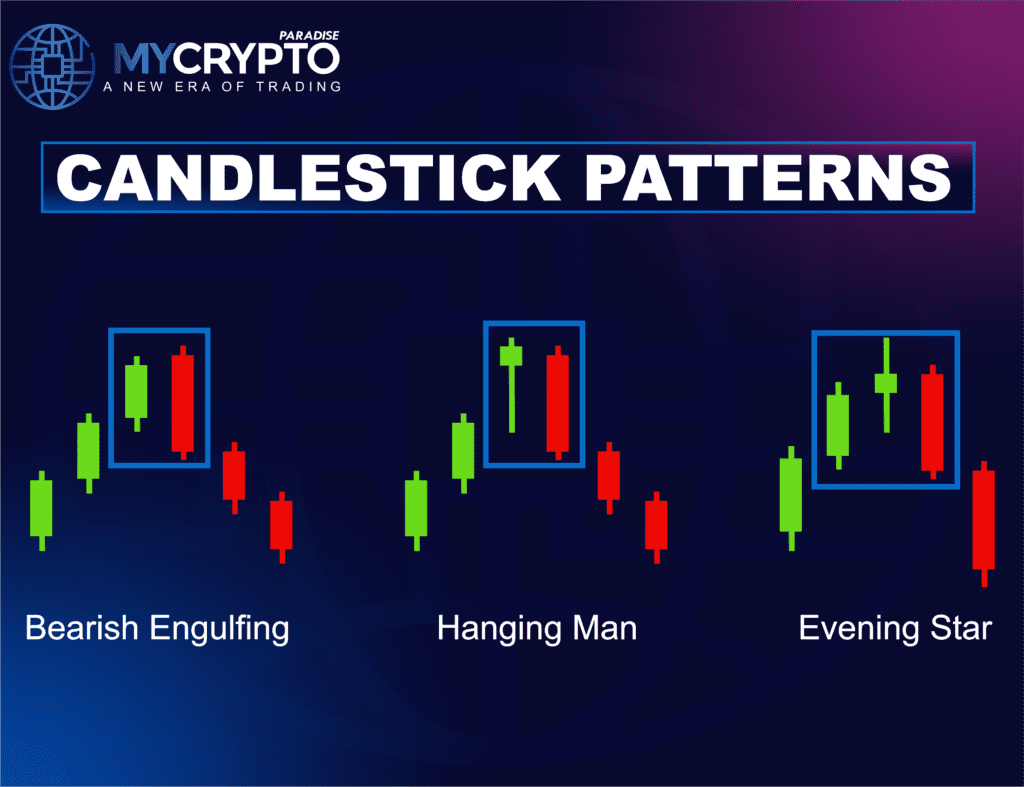
Bearish Engulfing Versus Hanging Man
- A Hanging Man is a single candle. It has a small body at the top and a long lower wick. Basically, prices dropped during the session, but buyers pulled them back up before the close.
- Here’s the thing: strength. A Hanging Man flashes a warning, but Bearish Engulfing takes control. The engulfing candle wipes out the last bullish move completely, leaving little doubt that sellers have the upper hand.
- Hanging Man can work well at resistance, but the Bearish Engulfing Pattern usually stands out more, especially if you see volume rising and a big resistance zone on higher timeframes.
Common Mistakes to Avoid With the Bearish Engulfing Pattern
Spotting a Bearish Engulfing pattern is easy. Trading it properly? That’s where traders mess up. Even small slip-ups can turn a high-probability setup into a bad trade.
Entering Before the Candle Closes
Way too many traders rush in while the engulfing candle is still forming. Don’t do it. Until the candle closes and fully engulfs the previous one, you don’t have a real signal. If you enter mid-candle and the price snaps back, you’re stuck.
Ignoring Where It Forms
A random Bearish Engulfing in the middle of a range means nothing. The pattern matters only when it shows up at proper resistance, supply, or after a liquidity sweep. If you trade it without context, you’re just guessing.
Forgetting About Volume and Momentum
Not all engulfing candles show real selling pressure. If there’s no volume or momentum behind the move, don’t expect much. Real reversals usually come with a burst of volume and follow-through.
Trading Against the Bigger Trend
Taking a bearish engulfing right into a strong uptrend on a higher timeframe is asking for trouble. The pattern works best when the larger picture lines up, like at a major resistance, or when the bigger trend looks like a continuation after a pullback.
Poor Risk Management
Tight stop-loss or risking more than you should lose is the way to destroy accounts. Stops should sit above the engulfing high, and your position size needs to fit your rules.
Ignoring Market Conditions and News
Wild news or sudden volatility can ruin even the best setups. A textbook Bearish Engulfing won’t save you if the market gets hit by a bullish announcement or unexpected event. Always know what’s going on before you commit.
Conclusion
The Bearish Engulfing pattern gives crypto traders a solid shot at catching bearish reversals if you’re patient and stick to your plan. Don’t jump the gun. Wait for the close, make sure the setup is at a meaningful level, and keep your risk management tight. When you put all that together, you can ride real downside moves without trading on impulse.
At ParadiseFamilyVIP🎖️, crypto traders go deeper into setups like the Bearish Engulfing, learning precise entry models, how to read real momentum shifts, and how to manage risk with professional discipline.
👉Join ParadiseFamilyVIP🎖️ to trade with confidence, structure, and precision. Limited spots are available, so secure your place or join the waiting list to stay prepared for high-momentum market opportunities.
FAQs
What is the Bearish Engulfing pattern in crypto trading?
A Bearish Engulfing pattern forms when buyers lose control, and sellers step in in a hard manner. You’ll spot it right after a strong green candle, and then suddenly, a bigger red candle wipes out that move, swallowing the previous candle’s body completely. That’s a clear sign that sellers are getting the upper hand, and prices might start heading downward.
Is the Bearish Engulfing pattern bullish or bearish?
It’s bearish. This pattern basically shouts that sellers just took control from buyers. You’ll often see it pop up near resistance or after a big rally.
How do I confirm a Bearish Engulfing pattern?
Wait until the red candle closes and actually covers the whole body of the green one before it. If it closes near its own low and volume picks up, that’s even stronger confirmation.
Which timeframe works best for the Bearish Engulfing pattern?
Daily or weekly charts usually give more reliable signals since they cut out a lot of the market noise. You can try lower timeframes, but the pattern’s context matters more there.
How can traders use the Bearish Engulfing pattern effectively?
Keep an eye out for this pattern at resistance, supply zones, or after price sweeps out previous highs. Don’t rush in; wait for confirmation, place your stop above the red candle’s high, and watch your position size. Staying patient and disciplined is what really counts.
Can the Bearish Engulfing pattern fail?
Absolutely. Sometimes you spot it in the middle of a range or right against a strong uptrend on bigger timeframes, and it just doesn’t work out. That’s why you should always use stops and stick to your risk management rules, so one bad pattern doesn’t ruin your account.