

Candlestick Patterns Explained
In short
The Evening Star candlestick pattern is a three-part formation that signals a potential bearish reversal at the end of an uptrend. It consists of a long bullish candle, followed by a small-bodied candle (bullish or bearish), and concludes with a long bearish candle, indicating a shift towards a downtrend.
Many candlesticks patterns are useful to traders for profitable outcomes. Among the most important ones is the evening star candlestick pattern, which basically points to trend shifts.
The Evening star signals a possible change in the current trend and also helps to identify a bearish reversal during a diminishing uptrend. In this article, we will explore the Evening Star candlestick pattern, its formation, interpretation, and application in trading.
What is the Evening Star Candlestick Pattern? The Evening star is a 3-part pattern.
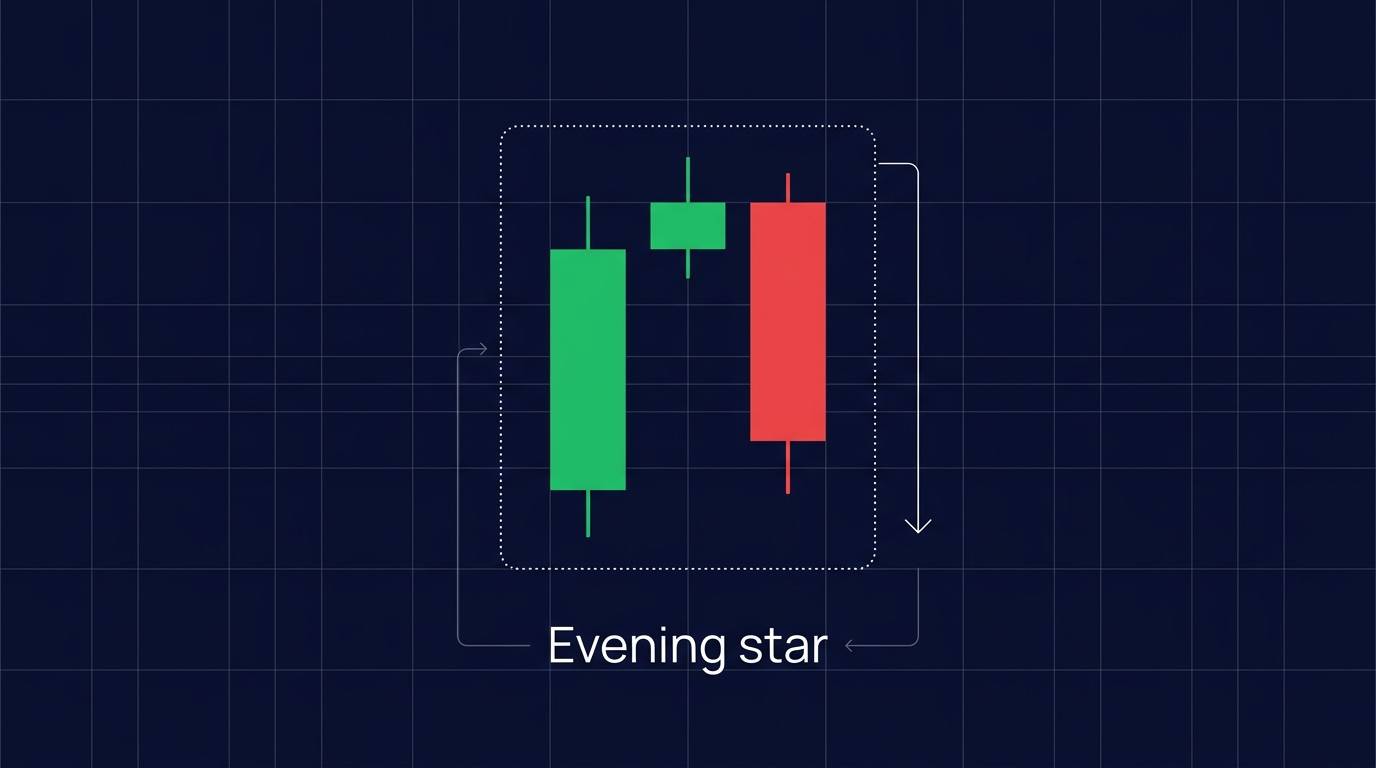
The candlestick pattern consists of both green and red candles. It gives a signal for a potential trend change. It usually appears at the end of an uptrend, essentially predicting the beginning of a downtrend (Investopedia).
The initial or first candle of the formation is usually a long bullish candle. This appears to give a clue of the current bullish movements.
The second candlestick of the formation has a small body. It may be bullish or bearish, essentially predicting a period of indecision of traders.
The third candlestick is the last candle that completes the formation. It is a bearish candle. Characteristically-long and confirms a bearish reversal.
How to Identify the Evening Star candlestick pattern?
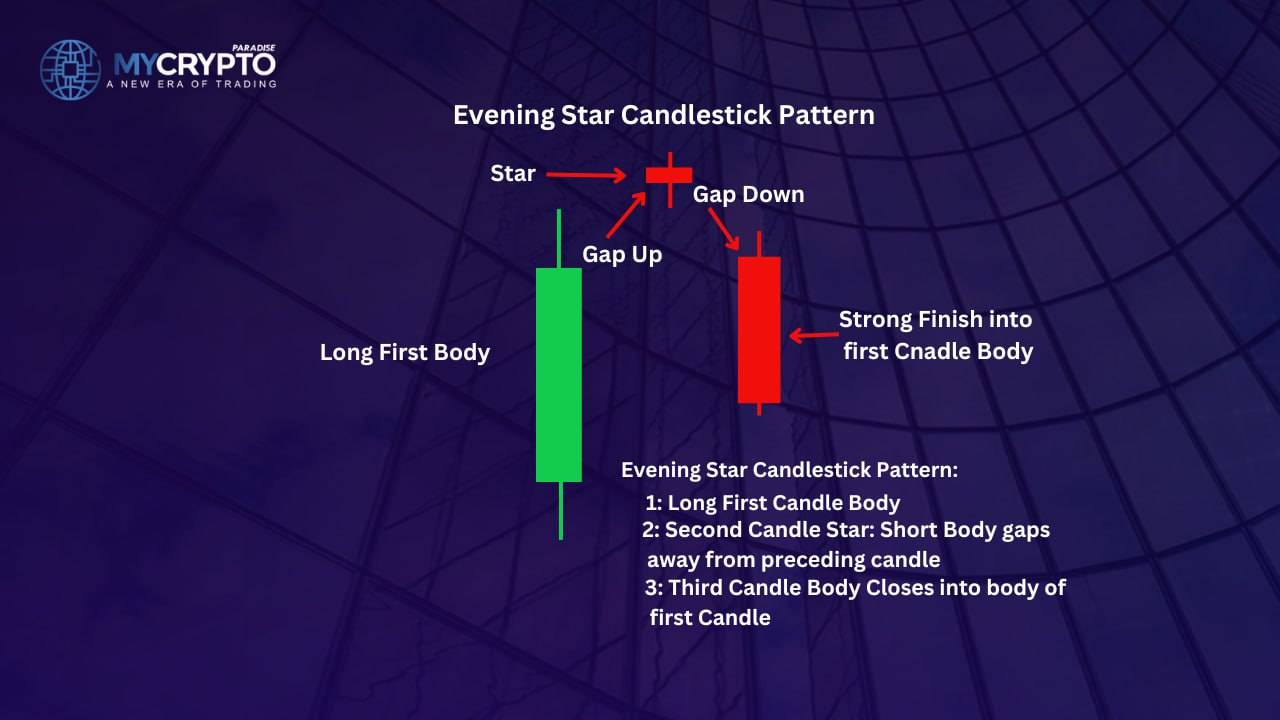
To identify the Evening Star candlestick pattern, look for the following characteristics:
1. The first candlestick is usually a green candle. It signifies that there’s a bullish trend in place.
2. The second candle is a small-bodied candle that indicates indecision and a potential shift in sentiment. It could be bullish or bearish.
3. The third candle is also long, just like the first. Although, in this case, it is a red candle. It means that the current bull market will begin a downtrend.
The second candle can take various forms, including a Doji, Hammer, Shooting Star, or Spinning Top. The key is that it should have a small body and show a lack of conviction in the market.
What is the best way to spot an evening star?
The best way to spot an evening star is to check each candle against a short list, and only after a clear price rise. A setup that passes every check is a stronger signal than three candles that only look similar.
- First candle: a long green body, the last strong burst of buying.
- Second candle: a small body that opens near the first close and stalls, a sign that buyers are running out of steam.
- Third candle: a long red body that falls from the star and closes well into the first candle’s body.
- Volume: higher volume on the third candle, which shows that sellers have taken control.
Crypto trades around the clock, so the textbook gaps around the star are rare. A small star that stalls near the top of the first candle still counts. When that middle candle is a Doji, its tiny body shows even greater indecision.
The pattern appears on all time frames and across many crypto assets, so the same checks apply to each chart. Its bullish mirror image is the morning star pattern, which forms at the bottom of a downtrend.
How to Interpret the Evening Star Candlestick Pattern
The pattern is a firm indication of a bearish reversal during a bull market. The first long bullish candle shows the strength of the uptrend, but the small-bodied second candle indicates that the trend may be losing steam. The third candle, a long bearish candle, confirms the bearish reversal and signals the beginning of a downtrend.

The Evening Star pattern is more reliable when it appears after a prolonged uptrend and at a resistance level. There’s usually a quite clear indication that a downtrend is inbound. A further decline is highly probable upon the formation of an evening star. The most probable ways to utilize the evening star pattern during crypto trading are:
1. Shorting the crypto asset: Traders can initiate short positions after the formation of the Evening Star pattern. Traders can put their stop-loss at the top of the green candlestick. They can also put a profit target at a support level.
2. Selling options: Options traders can sell call options or buy put options after the formation of the Evening Star pattern. Traders may put their stop-loss at the top of the first candlestick. A support level is a decent spot to target profit.
3. Exiting long positions: Traders holding long positions can exit their positions after the formation of the Evening Star pattern. A stop-loss is good at the bottom of the third candlestick in case the pattern creates a false signal.
How do you set entry, stop loss and take profit on an evening star?
Wait for the third candle to close before acting. A short entry then sits just below that candle’s low. The stop loss goes above the high of the whole pattern, and the first target is the nearest support level. Size the position so the planned loss at the stop is a small share of the account.
Entry: wait for the third candle to close
The pattern is complete only when the third candle closes well inside the first candle’s body. Until then, the star is just a pause in the rally. Patient traders let the candle finish, then place the entry just below its low. Price then has to keep falling to trigger the trade.
Stop loss: above the high of the pattern
The standard stop sits just above the highest point of the formation, usually the top of the star’s wick. If price closes back above that level, the reversal has failed. A tighter stop, above the third candle or the first green candle, risks less per trade but gets hit more often.
Take profit: at the next support level
The first target is usually the nearest support level below the pattern, such as a prior swing low. Fibonacci retracement levels of the last rally mark further areas where the fall may pause. Many traders also check that the target is at least twice as far away as the stop, a 1:2 risk to reward.
Position size: risk a small, fixed share
Risk only a small, fixed share of the trading account on any single setup. The position size then follows from the distance between the entry and the stop. That way, the planned risk of each trade stays small.
Limitation of the Evening Star Pattern
This candlestick pattern is not foolproof like many others previously discussed. There’s a possibility of false signals every once in a while. Experienced traders use the pattern in combination with some other technical indicators. This helps to better confirm entry and long position decisions.
Its reliability varies with market conditions. The signal carries the most weight after a strong uptrend, with high volume on the third candle. The read gets stronger when the broader market trend is already weakening. A second tool, such as a Fibonacci level or an overbought momentum reading, adds confirmation before a trade.
Conclusion
The evening star can help traders understand when a crypto market is about to take a turn. It is a powerful formation that helps experienced traders make informed trading decisions. Traders should look for the three characteristic candles and interpret them in the context of the overall market conditions. They should also use other technical indicators and fundamental analysis to confirm the trend reversal before making a trading decision.
Evening Star Pattern FAQ
What is the evening star pattern?
The evening star is a three-candle bearish reversal pattern that forms after an uptrend. A long green candle comes first, then a small-bodied star, then a long red candle that closes well into the first body. Together they show buyers losing control as sellers step in.
How do you trade the evening star pattern?
Wait for the third candle to close well inside the first candle’s body. A short entry can then sit just below that candle’s low, with the stop loss above the high of the pattern. The first target is usually the nearest support level, ideally at least twice as far away as the stop.
Is the evening star pattern reliable?
It is a widely watched bearish reversal signal, and its reliability varies with market conditions. It carries the most weight after a strong uptrend, with high volume on the third candle. Traders confirm it with a second tool and plan the stop loss before the entry.
Where does the evening star pattern work best?
It works best at the top of a long rally, near a resistance level, with rising volume on the third candle. A Doji as the middle candle shows even greater indecision. The pattern appears on all time frames, so the same checks apply on any crypto chart.
Crypto trading involves substantial risk and is not suitable for everyone. Nothing here is financial advice; it is education only. Never risk more than you can afford to lose.











Join the discussion
No comments yet. Members, share how you are reading this.