


Listen: the breakdown
Developing story update (November 10, 2026, 15:22 UTC):
Update: the inflation release that triggered the flush is now confirmed. October US CPI rose 0.4% month-over-month, hotter than expected, and markets had been pricing roughly an 80% chance of a quarter-point Fed rate hike in December heading into the print. BTC briefly dipped below $74,000 on the data.
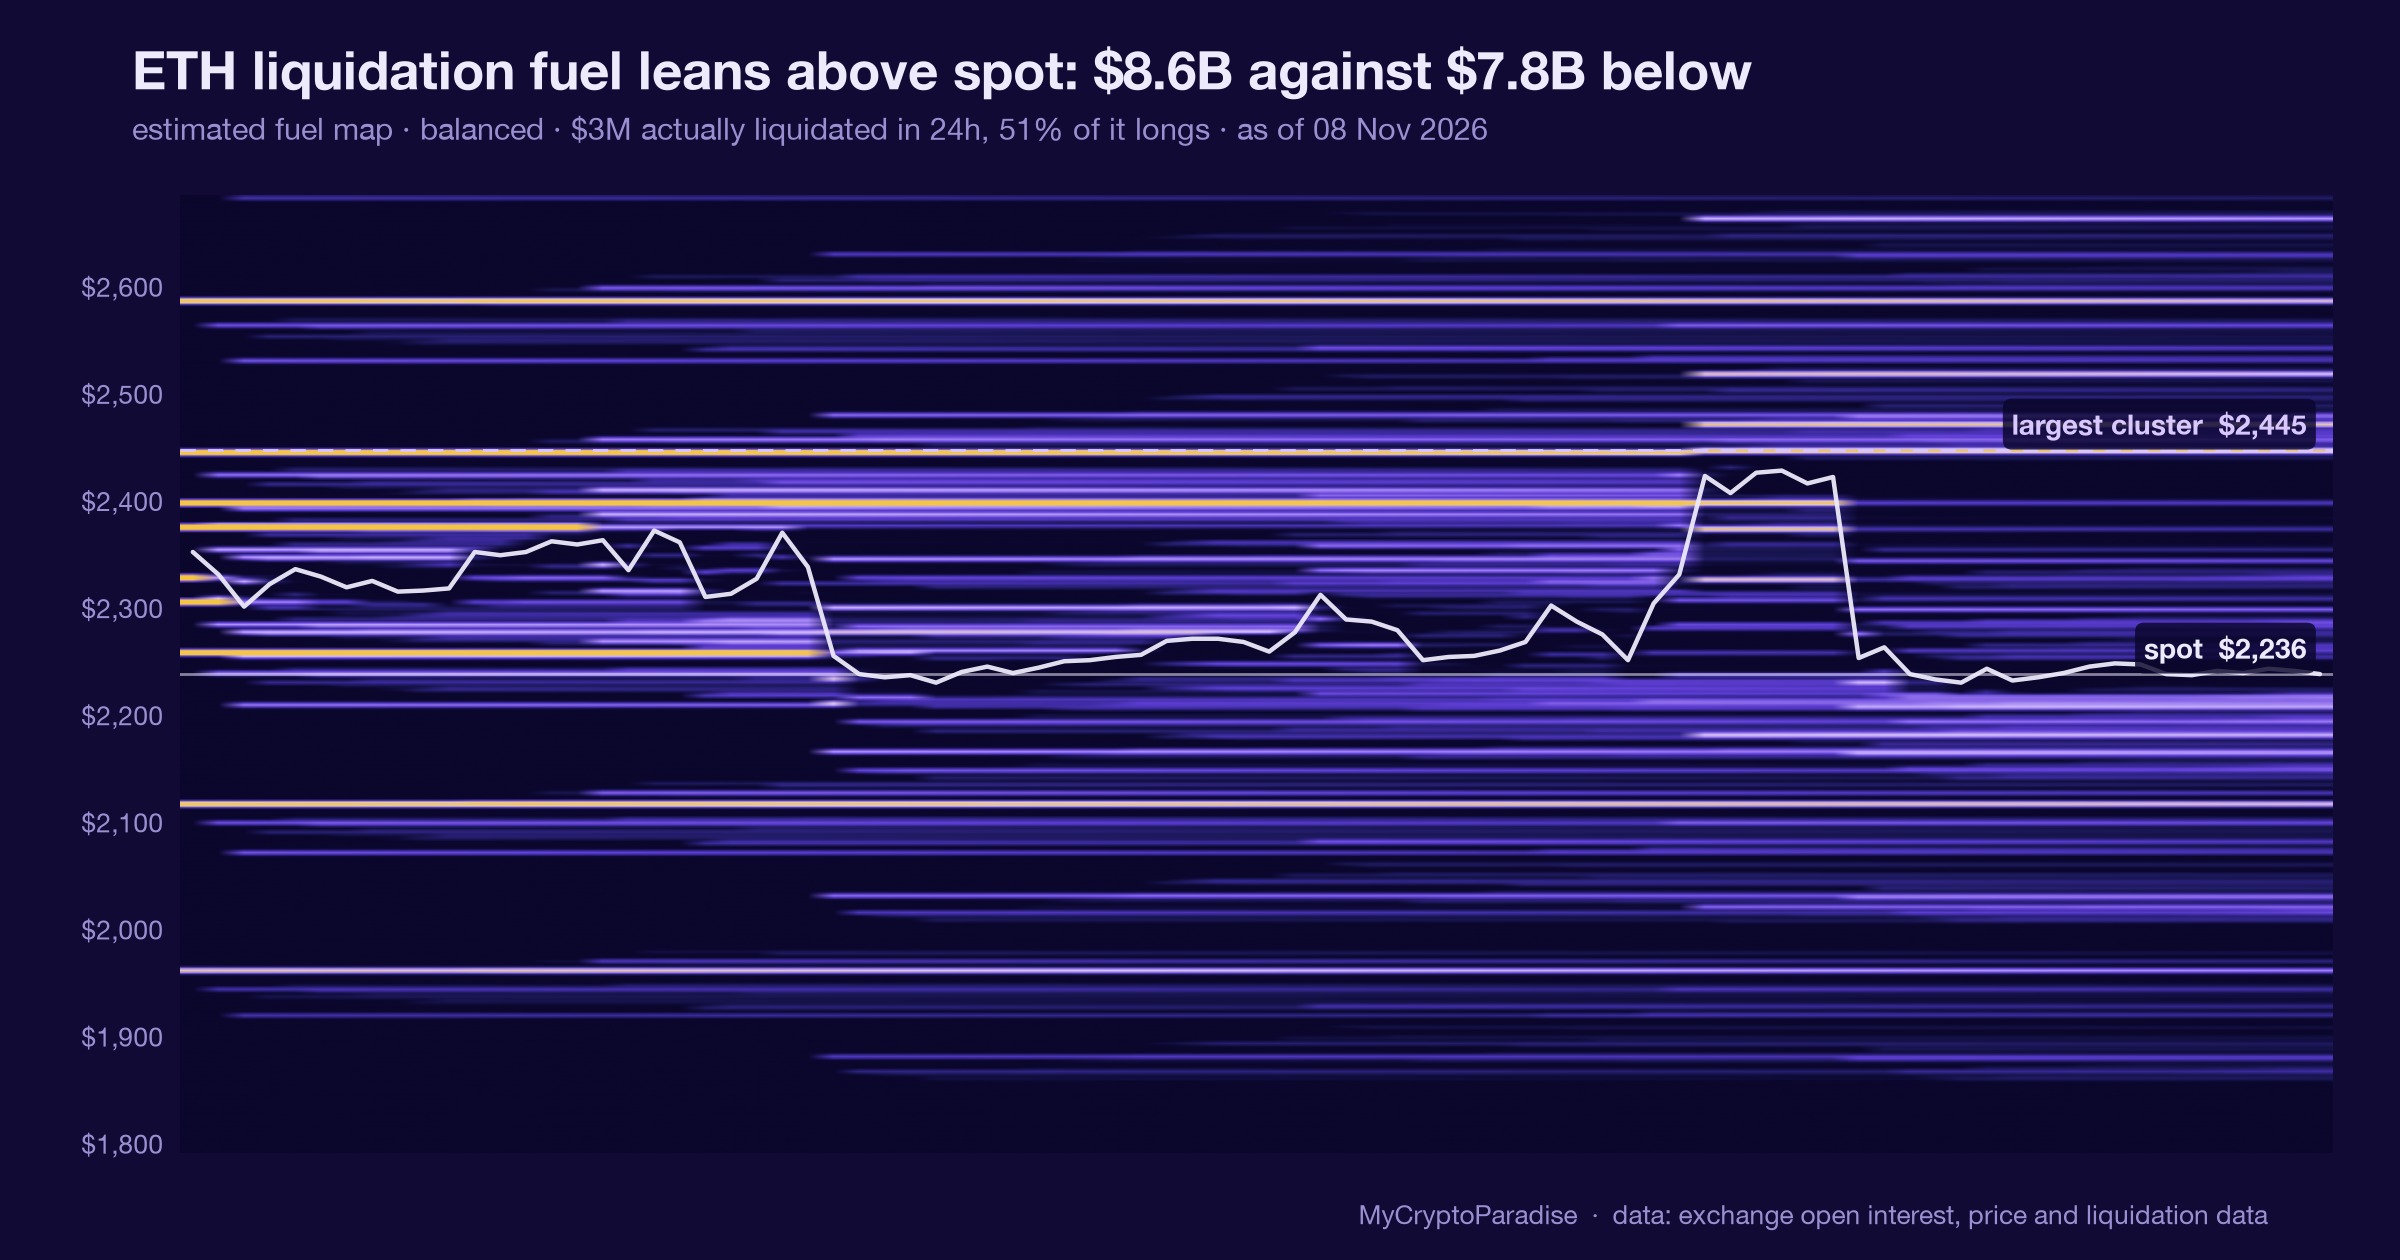
The leverage picture is now clearer and larger than the initial figure suggested. Trailing 24-hour crypto liquidations ran near $356 million, heavily long-skewed at about $280 million longs versus $76 million shorts across roughly 80,900 traders, with ETH taking the biggest single share. A wider sweep reached close to $1.04 billion, where longs made up about 88% of the total, confirming one-sided positioning into the drop.
Spot BTC ETFs also saw roughly $1.28 billion in weekly outflows, which keeps the backdrop cautious. This still reads as a positioning unwind rather than spot distribution, and a modest bounce off sub-$74K hints at short-covering, but bias stays defensive until price reclaims and holds the $74K to $75K area.
What to watch now: Whether BTC can reclaim and hold $74K-$75K, and if ETF outflows keep bleeding.
Developing story: This story is still unfolding. We are tracking it and will update this article as more details are confirmed.
Market briefing: An inflation print has firmed up rate-hike expectations, and a claim of $175 million in crypto long liquidations is spreading fast. Yet BTC was trading near $73,799 as of the latest snapshot, down just over 1 percent on the day.
- An inflation reading has pushed rate-hike odds higher, tightening the liquidity outlook
- A claim of $175M in crypto long liquidations in under 10 minutes is circulating but uncorroborated
- BTC sat near $73,799, down 1.14% on 24h, a mild reaction for a cascade that size
A $175M crypto long flush is racing across feeds after the inflation data, with rate hike odds climbing. But if the cascade were real, why is BTC barely down?
An inflation reading has done what inflation readings do lately. It firmed up expectations for a rate hike, and the risk crowd flinched.
Within that shift, a claim began circulating fast. Over $175 million of crypto longs liquidated in under 10 minutes, supposedly the moment the data hit. The number is clean, the timing is dramatic, and the feeds love it.
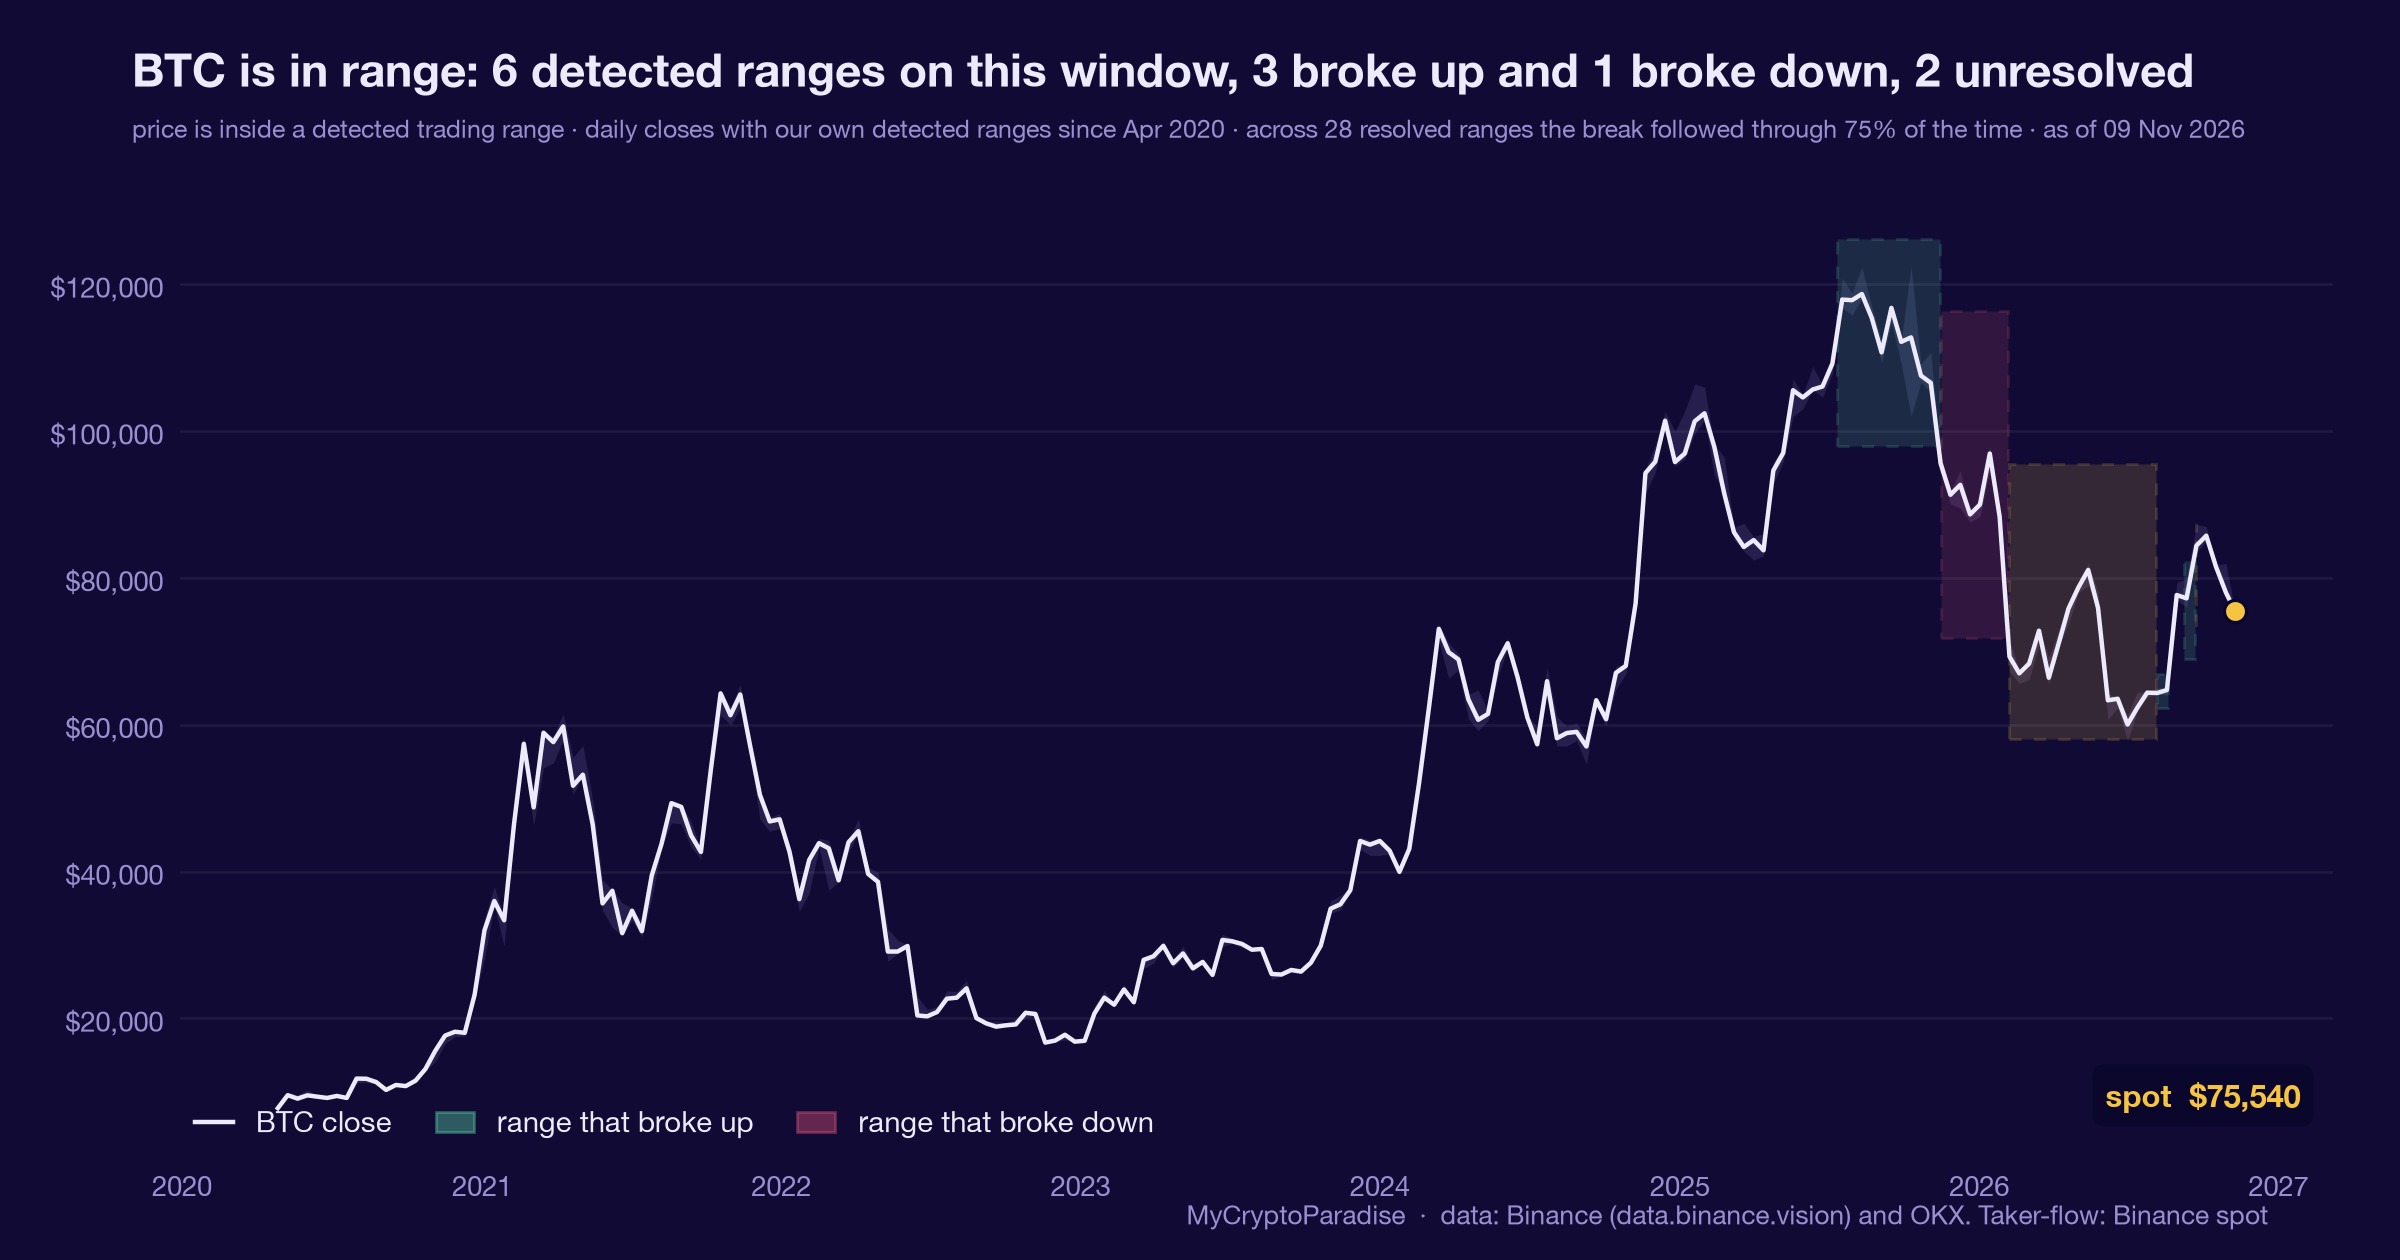
Here is the part that matters. BTC was trading near $73,799 as of the latest snapshot, down 1.14% on the 24h and 0.68% on the 1h. That is a soft reaction for a cascade of that scale.
We treat the macro trigger as real and the liquidation figure as a claim. Rate-hike repricing genuinely drains liquidity from risk assets, and leveraged longs are the first to feel it. That chain is sound and worth respecting.
The $175M headline is a different animal. It rests on a single recycled source, and nothing in the price action confirms a flush of that violence. A move that size usually leaves a wick, not a shrug.
So two readings sit side by side. Either the liquidation number is overstated, or the market absorbed the hit almost instantly and moved on. Both are more plausible than a $175M panic that barely dented the chart. The market has a long history of numbers that are larger on social feeds than on the candles.
Rate expectations pull liquidity from risk
The driver here is not the liquidation tweet. It is the rate-hike repricing underneath it.
When an inflation print firms up hike expectations, the whole liquidity backdrop shifts. Money gets more expensive, forward discount rates rise, and the appetite for long-duration risk fades. Crypto sits at the far end of that risk spectrum, so it reprices first and hardest. That is the real transmission mechanism. Tighter policy odds mean tighter financial conditions, which means leveraged positions carry more risk than they did an hour earlier.
Leverage is where the stress shows up fastest. Traders who added longs into a benign-rates assumption suddenly hold the wrong thesis, and liquidation engines do the rest. A cascade, if genuine, simply accelerates a move the macro already justified.
But the size of the move should match the size of the shock. A $175M flush in ten minutes implies forced selling that overwhelms the order book. The chart shows nothing of the sort.
That gap is the story. Either positioning was lighter than the headline suggests, or dip buyers absorbed the hit almost immediately. Both point to a liquidity event that was real but modest, not the violent deleveraging the number advertises. Respect the rate-hike direction, and stay sceptical of the figure wearing it.
Where the flush lands first
On its own facts, this reads bearish for crypto in the near term. Firmer rate-hike odds tighten liquidity, and tighter liquidity pressures BTC before anything else.
BTC is the liquidity gauge for the whole complex. A sustained rates-driven bid lower in BTC drains collateral value from the system, and that drain does not stay contained.
ETH tends to follow with a slight delay and a heavier beta. If BTC keeps leaking, ETH usually gives back more on a percentage basis, because its liquidity is thinner and its holders are more tactical.
Alts are the amplifier. They barely moved on the first flush, but a second leg in BTC would hit them hardest. Thin books mean small net selling produces large percentage drops, and leveraged alt longs are the easiest stops to run. That is the real downside risk if this extends. Not the $175M headline, but the follow-through it could seed if rate-hike fear keeps building.
For now the tape is restrained. A 1.14% daily move does not describe forced capitulation across the board. It describes a market that heard the data, trimmed some leverage, and is waiting for confirmation. The danger is a second catalyst arriving while positioning is already nervous and the liquidity story is working against the bulls.
Signals that separate a flush from capitulation
The cleanest tell is whether BTC holds its footing or starts giving ground in steps. A mild dip that stabilises says the rate-hike hit is largely absorbed.
A slow bleed under $72K would say something worse. That is where a modest flush turns into genuine distribution, and where the alt amplifier starts to bite.
Watch open interest and funding together. OI (open interest) is the total value of outstanding derivative contracts. If OI keeps falling while price holds, the market is deleveraging cleanly, which is healthier than it sounds.
Funding resetting toward neutral or negative would confirm longs are being wrung out rather than piling back in. That is the difference between a reset and a trap.
CVD (cumulative volume delta) is the other dial. It tracks net buying versus selling pressure. If CVD stays flat while headlines scream liquidation, the selling is not as broad as advertised.
Invalidation of the bearish lean is simple. A firm reclaim of $75K on rising spot volume would mean the rate-hike fear got sold and the dip buyers won the hour. Confirmation of the downside is the opposite: lower highs, OI climbing into weakness, and $72K breaking on real volume rather than on a single candle built by thin books.
Why the chart undercuts the headline
The ParadiseTeam reads the macro trigger as real and the $175M figure as unconfirmed. Those are two different claims, and they deserve two different levels of trust.
Rate-hike repricing is a genuine liquidity headwind, so the near-term lean here is lower. We respect that. But the mechanism and the number do not match, and when a cascade claim is not written on the chart, we treat it as noise dressed as signal.
BTC was trading near $73,799 as of the latest snapshot. A 1.14% move is not the fingerprint of a $175M flush in ten minutes. So we frame the band, not a forecast. Our standing caution still applies: strength into resistance can meet sellers, and a clean reclaim of $75K on real spot volume is what would tell us the dip buyers absorbed the rate-hike fear.
The risk sits below. A break of $72K on genuine volume, with OI rising into weakness, would confirm the bearish read and put the alt amplifier in play.
The edge is patience. Retail is reacting to a viral number; the tape is reacting to rates. We care only about which level breaks first, because that is the thing the headline cannot settle and the chart eventually will. Nothing here is advice. Position for both paths and let price, not the feed, resolve it.
Track it live: our live crypto funding rates and the Crypto Fear and Greed Index both update in real time, so you can watch this shift for yourself.
Related coverage
For exact entries, targets, and stop losses with full risk management, that is what ParadiseFamilyVIP is for. New to reading these moves? Start with our crypto trading strategies guide.
ParadiseTeam is monitoring the market situation closely, and we are taking these developments into consideration while building our trading tactics inside ParadiseFamilyVIP.
Crypto trading involves substantial risk. Prices are volatile and you can lose money. This article is educational and is not financial advice. Past performance does not guarantee future results.
Does BTC reclaim $75K before it loses $72K?
Settles on BTC's first hourly close above $75,000 or below $72,000, at the latest Tue 17 Nov.
How 2 Paradisers are calling it
The first call is still open
Free account, no password. Members just sign in.
An education game, not trading advice.










Join the discussion 1
lol the $175M number traveling faster than the chart is the part that bugs me. btc sitting at 73.8k while a liquidation headline spreads says more about the feed than the market, imo.