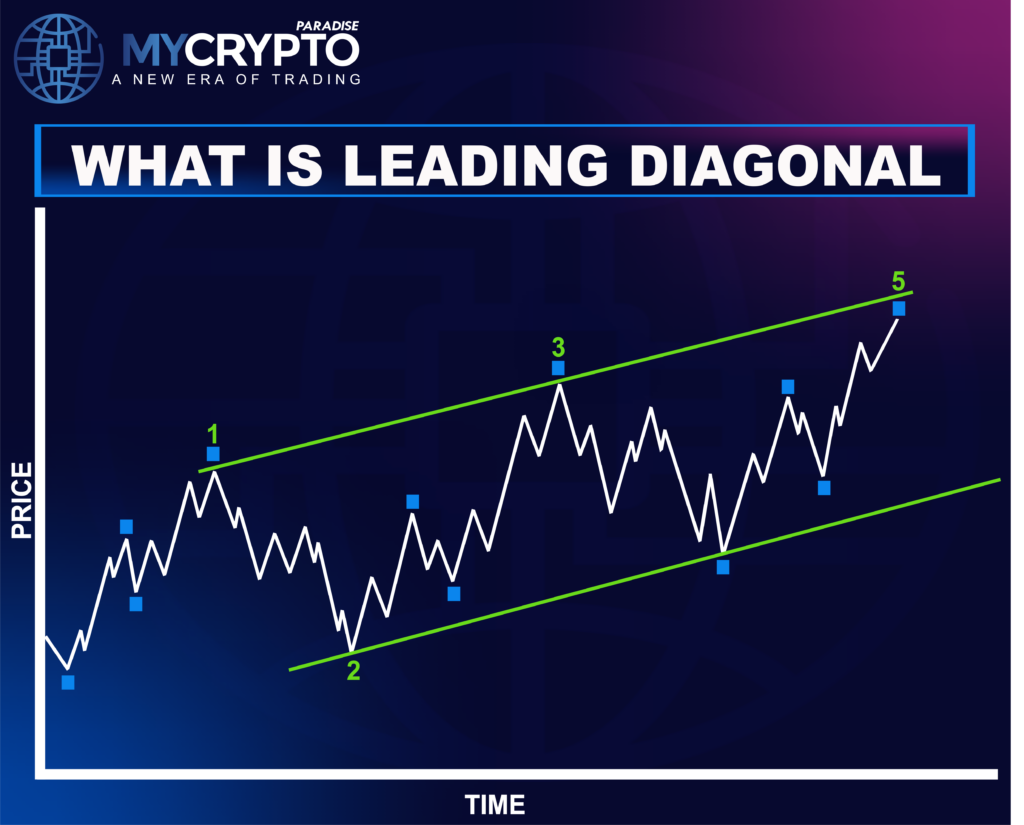
- A Leading Diagonal is a five-wave structure that appears in Wave 1 of an impulse or Wave A of a zigzag, signaling the start of a strong trend.
- Unlike a standard impulse, waves within a Leading Diagonal overlap, forming a wedge-like structure that can be ascending (bullish) or descending (bearish).
- Traders can use Leading Diagonals to anticipate trend continuation and identify potential breakout points for strategic entries and exits.
Leading Diagonal patterns are among the most critical formations in Elliott Wave Theory. They signal the start of strong price movements. Understanding these structures can help traders anticipate market trends early and provide a strategic edge in decision-making.
This article breaks down leading diagonals, their characteristics, and how can you use them to refine your trading strategy. Let’s dive in:
What is the Leading Diagonal?
A leading diagonal is a distinct wave pattern within Elliott Wave Theory that serves as a precursor to strong market movements. It typically forms in Wave 1 of an impulse or Wave A of a zigzag which makes it a key indicator of an emerging trend. Crypto traders who recognize this pattern early can anticipate a potential powerful price expansion in the direction of the diagonal.
Also known as a wedge, the leading diagonal is often misunderstood due to its resemblance to other formations. Historically, it was referred to as a diagonal triangle, but Robert Prechter, a renowned expert in wave analysis, refined the terminology to avoid confusion.
Many beginners mistakenly classified it alongside traditional corrective triangles, which follow different rules. By removing the word “triangle,” crypto analysts can clearly differentiate diagonals from corrective structures.
Why is the Leading Diagonal Important?
Leading diagonal on the chart can provide crypto traders with critical early signals of a developing uptrend or downtrend. Since this pattern occurs at the start of a new impulse or zigzag, it suggests that the crypto market is gearing up for a significant directional move. This knowledge can be strategically applied in crypto trading by positioning for potential breakouts in the direction of the diagonal’s formation.
In the next section, we will break down the rules and characteristics of these diagonals to ensure a clear and systematic approach for spotting them in real market conditions.
Characteristics of Leading Diagonal
A leading diagonal is more than just a structural pattern in Elliott Wave Theory as it often signals the early stages of a strong price movement. Unlike a standard impulse wave, a leading diagonal shows a gradual yet determined push in the market’s direction, often accompanied by choppy or overlapping price action. This formation suggests that although the crypto market may appear hesitant at first, a more forceful trend is about to develop.
Crypto traders who recognize leading diagonal early can position themselves ahead of major moves and capitalize on the breakout that typically follows. This makes diagonals a powerful tool for identifying trend continuations before the broader market reacts.
Where Do Leading Diagonal Appear?
Let’s look at where the leading diagonal appears in the crypto market:
Wave 1 of an Impulse
The most common place to find a leading diagonal is Wave 1 of an impulse wave. Since Wave 1 represents the initial push of a new trend, a diagonal at this stage indicates that the market is still building momentum. The overlapping structure reflects a struggle between buyers and sellers, but once the diagonal completes, the trend often accelerates into Wave 3—the strongest wave in an impulse.
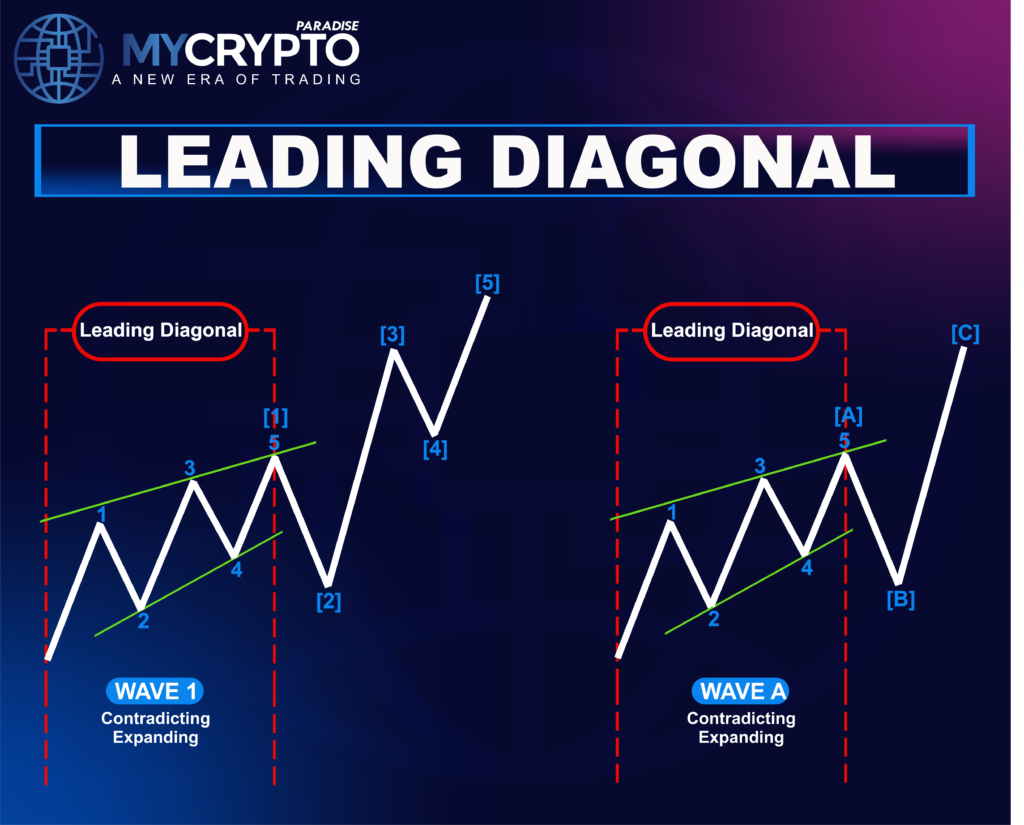
Wave A of a Zigzag
A leading diagonal can also form in Wave A of a zigzag correction. In this scenario, it sets the stage for a corrective three-wave structure (A-B-C). Since zigzags tend to be sharper and more directional than other corrective patterns, a leading diagonal in Wave A suggests that the market is gearing up for a swift corrective move before resuming the main trend.
How Crypto Traders Can Use It as Trend Indicators?
For professional traders, spotting a leading diagonal offers a strategic edge in forecasting price action. Here’s how:
- Early Trend Confirmation: Since the leading diagonal appears at the beginning of the trend, it serves as an early confirmation that a significant price movement is underway.
- Breakout Potential: Once a leading diagonal completes, price action often accelerates in the direction of the trend which makes an ideal point for entry strategies.
- Money Management: The structure of a leading diagonal provides clear invalidation levels—if the pattern breaks key rules, crypto traders can quickly adjust their strategy to avoid unnecessary losses.
By understanding where leading diagonal form and how they function as trend indicators, crypto traders can anticipate major market shifts and position themselves for high-probability trading opportunities.
Leading Diagonal Rules
While leading diagonal share similarities with impulse waves, they follow a distinct set of principles that make them unique. Here are the rules:
1. Five-Wave Structure
Like an impulse wave, a leading diagonal consists of five sub-waves, labeled 1, 2, 3, 4, and 5. However, unlike a traditional impulse, the internal structure allows for some variations that distinguish it from other motive waves.
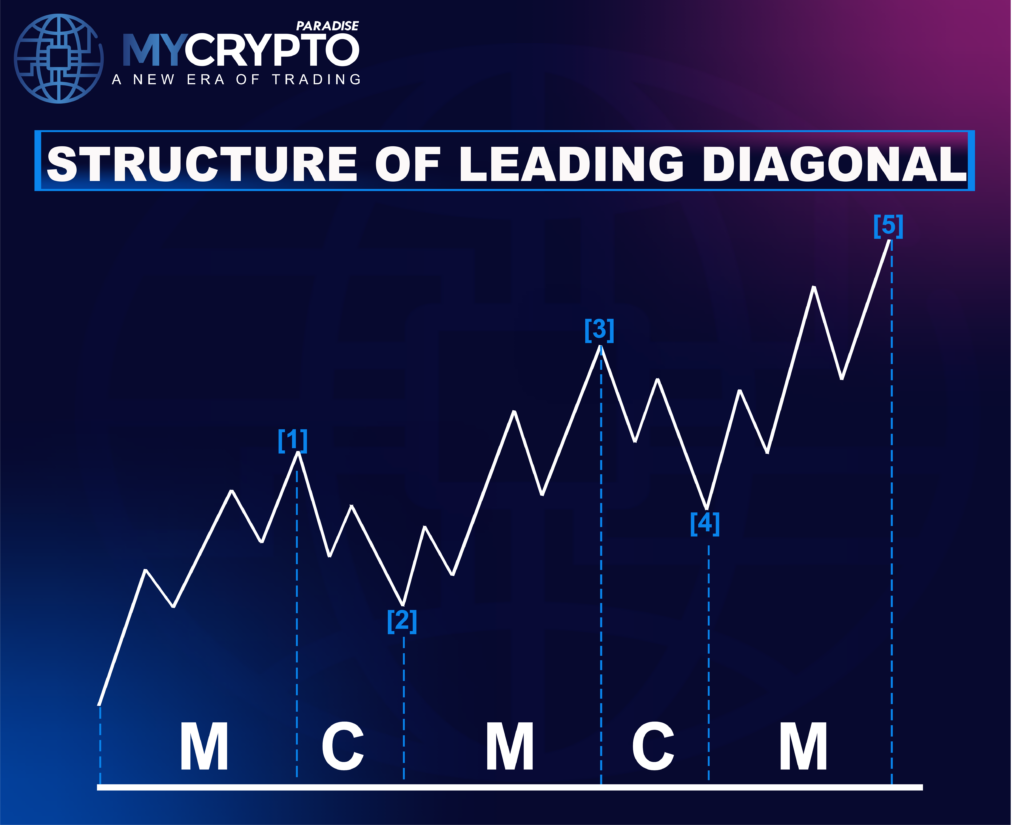
2. Wave Alternation:
The internal composition of a leading diagonal alternates between motive and corrective waves:
- Wave 1 – Motive
- Wave 2 – Corrective
- Wave 3 – Motive
- Wave 4 – Corrective
- Wave 5 – Motive
This structure mirrors an impulse, but as we will see in later rules, leading diagonal have their own unique characteristics.
3. Wave 2 Never Retraces Beyond Wave 1
Wave 2 in a leading diagonal must never go beyond the start of Wave 1. This rule aligns with the traditional Elliott Wave Theory, where corrective waves do not fully erase the progress of preceding motive waves.
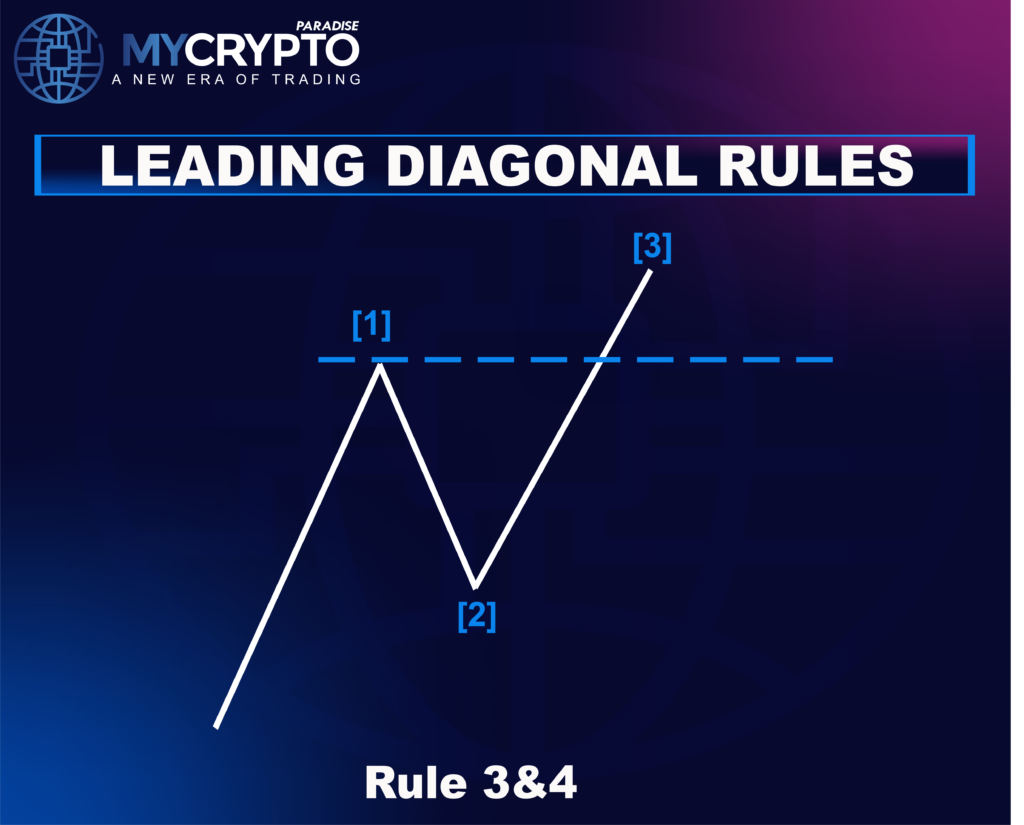
4. Wave 3 Always Extends Beyond Wave 1
A defining characteristic of the leading diagonal is that Wave 3 must always move beyond the end of Wave 1. This confirms the continuation of the trend and ensures that the wave remains within the category of a motive structure.
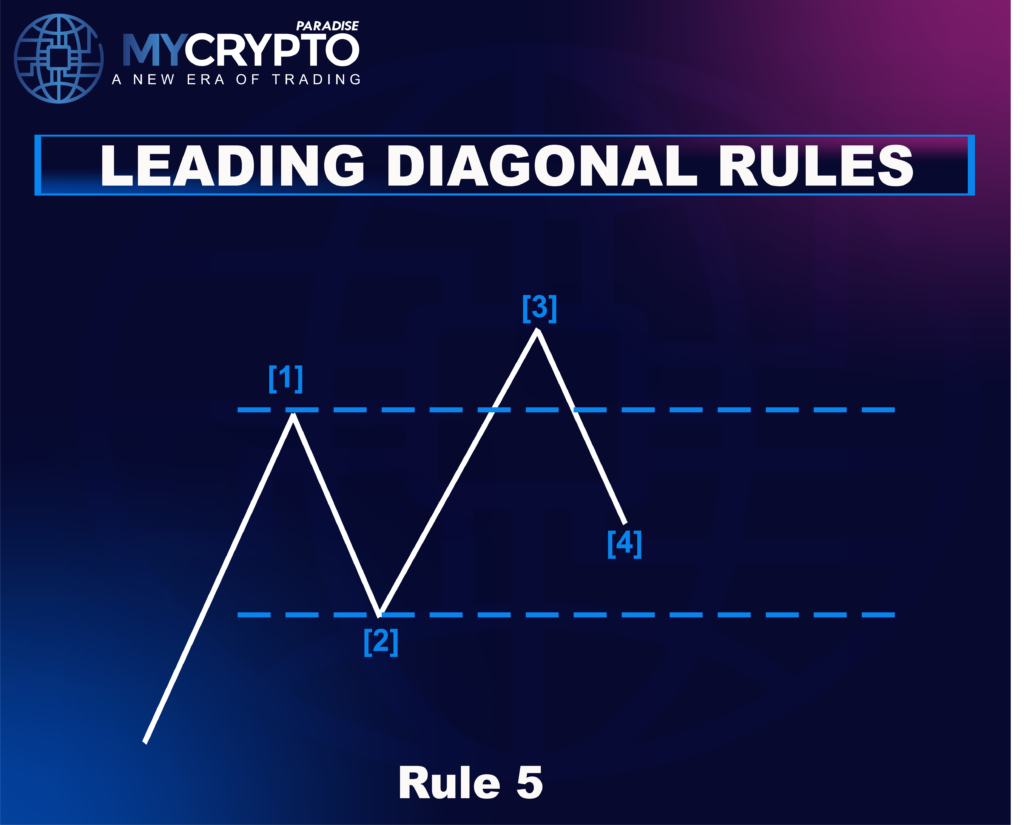
5. Wave 4 Overlaps Wave 1 and 2
One of the most distinguishing features of the leading diagonal is that Wave 4 retraces into the price territory of Wave 1, but it must remain between the high of Wave 1 and the low of Wave 2. If Wave 4 exceeds this range, the structure becomes invalid and cannot be classified as a leading diagonal.
6. Wave 5 is Never Truncated
Unlike impulse waves, where Wave 5 can sometimes be truncated, in a leading diagonal, Wave 5 always extends beyond the end of Wave 3. This ensures that the wave remains a valid diagonal formation rather than an incomplete pattern.
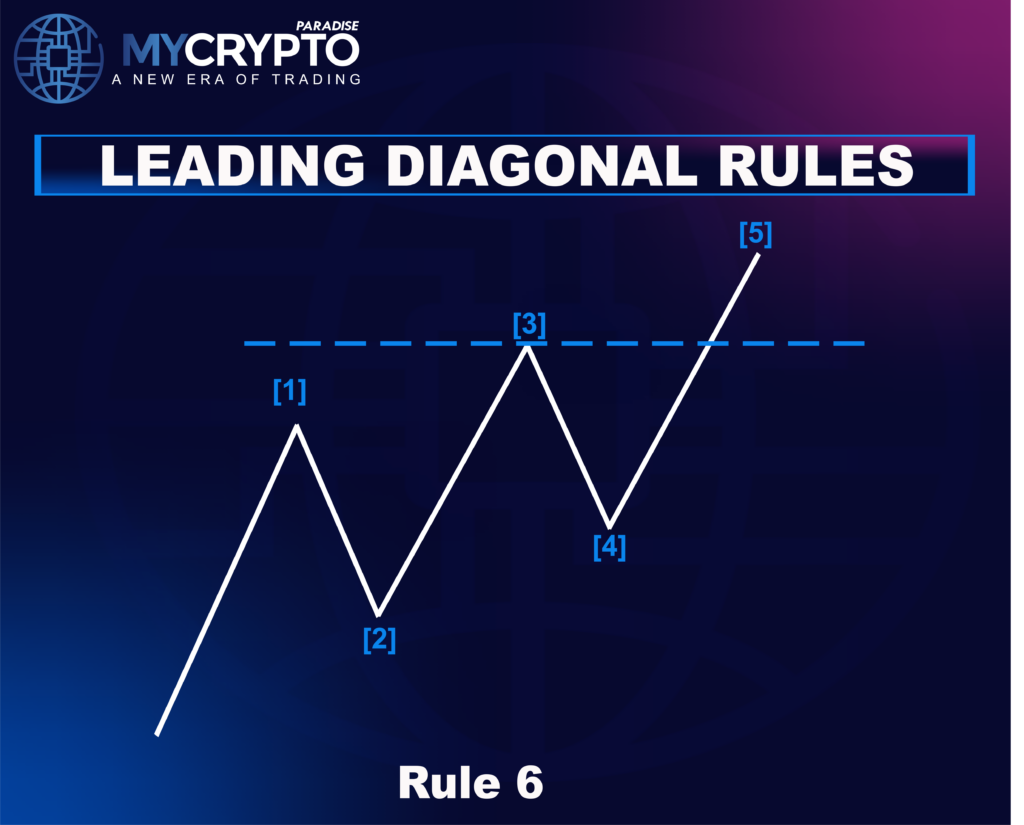
7. Wave 3 is Never the Shortest
As with all motive waves, Wave 3 in a leading diagonal must never be the shortest among Waves 1, 3, and 5. This rule prevents violations of Elliott Wave principles and ensures the structure remains within valid boundaries.
8. Leading Diagonal Appear in Wave 1 or Wave A
A leading diagonal only appears in two specific positions:
- Wave 1 of an impulse
- Wave A of a zigzag
If a diagonal like pattern appears in another position, it is not a leading diagonal and should be analyzed differently.
Types of Leading Diagonal
A leading diagonal can appear in both bullish and bearish market conditions, forming either an ascending or descending structure. While their internal characteristics remain consistent, typically displaying an overlapping five-wave formation they signal different directional biases based on their placement and market context.
Understanding the distinction between ascending and descending leading diagonal allows traders to align their strategies accordingly.
Ascending Leading Diagonal
A bullish leading diagonal forms when prices trend upward in a diagonal structure, with the wave sequence still adhering to the 1-2-3-4-5 count. The defining characteristic of an ascending leading diagonal is that the trendline connecting Wave 1 and Wave 3 slopes upward, as does the line connecting Wave 2 and Wave 4.
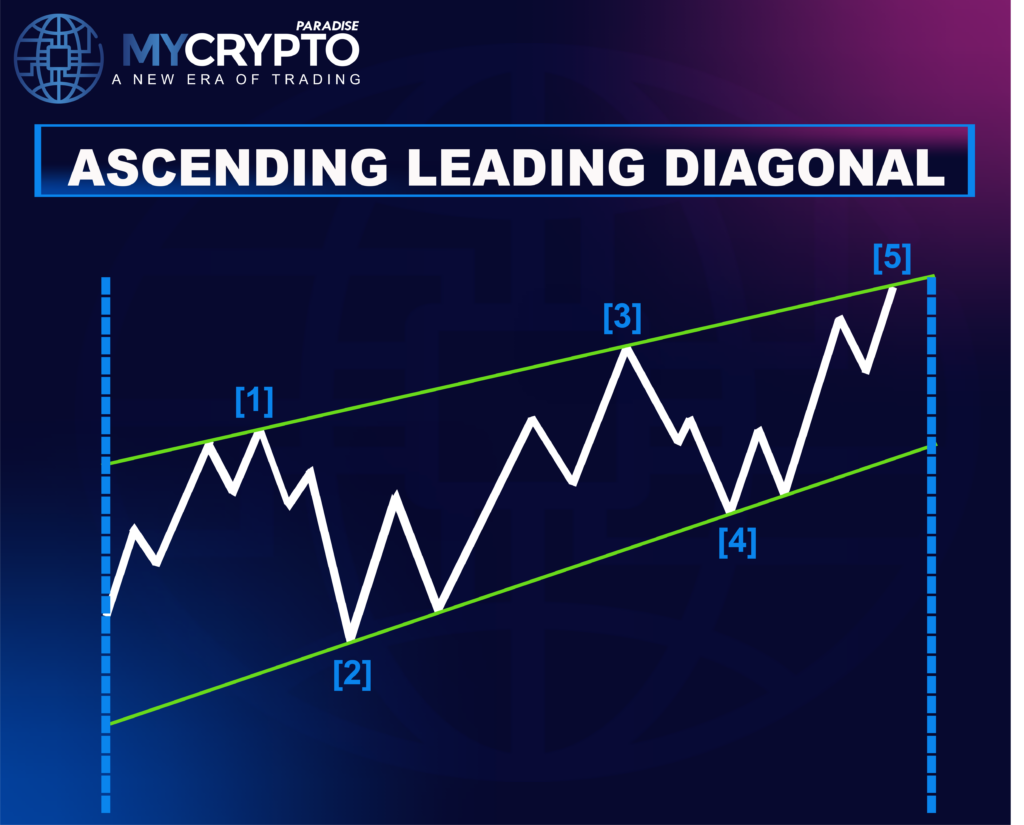
Key Features of an Ascending Leading Diagonal:
- Appears in Wave 1 of an impulse or Wave A of a zigzag.
- Price action is choppy with overlapping waves, reflecting an early struggle between buyers and sellers.
- The diagonal gradually pushes the market higher, often leading to an explosive breakout into Wave 3.
- Volume may remain relatively low during the formation but expands significantly once the pattern completes.
- Traders watching a bullish leading diagonal should anticipate strong follow-through buying pressure once Wave 5 concludes, leading to the beginning of a sustained uptrend.
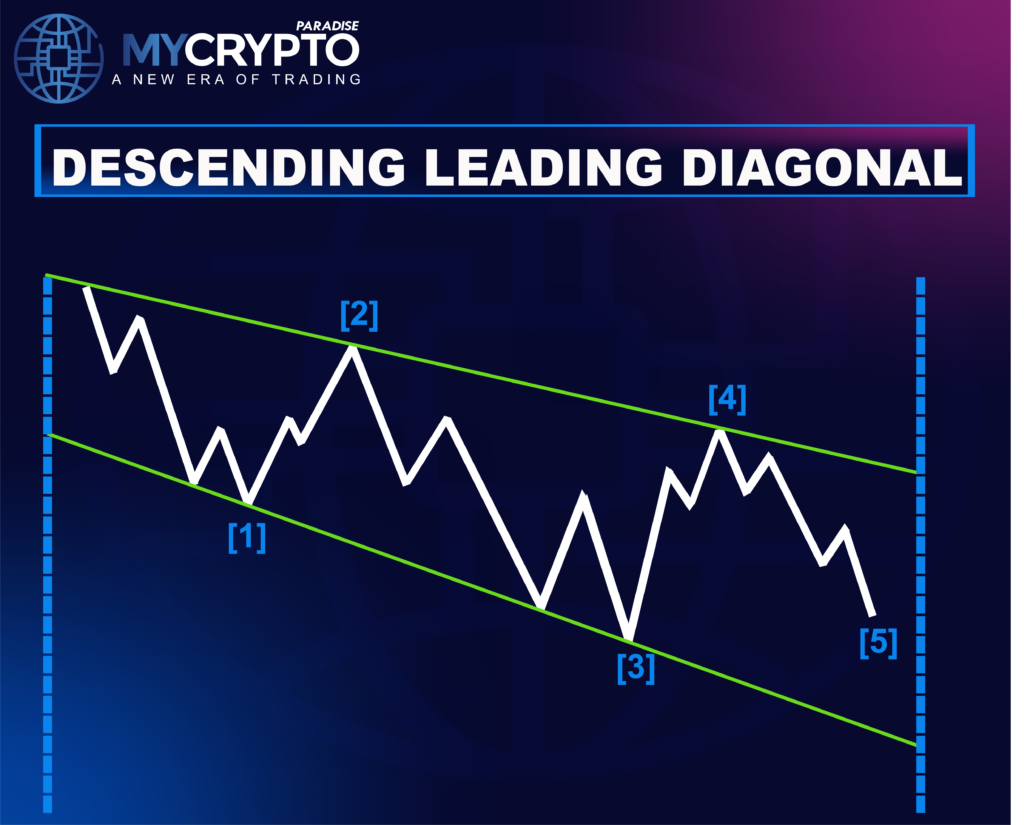
Descending Leading Diagonal
A bearish leading diagonal is the mirror image of the bullish version. It forms when prices trend downward, creating a narrowing or expanding diagonal pattern. The internal structure still follows the five-wave overlapping sequence, but the trendlines slope downward, confirming bearish momentum.
Key Features of a Descending Leading Diagonal:
- Appears in Wave 1 of a downward impulse or Wave A of a zigzag correction.
- Price action is hesitant but persistently bearish, signaling an early stage of a larger downtrend.
- The diagonal suggests that sellers are gradually gaining control, even though minor upward retracements occur within the structure.
- Once the pattern completes, the market typically accelerates into Wave 3 or Wave C, leading to a sharp decline.
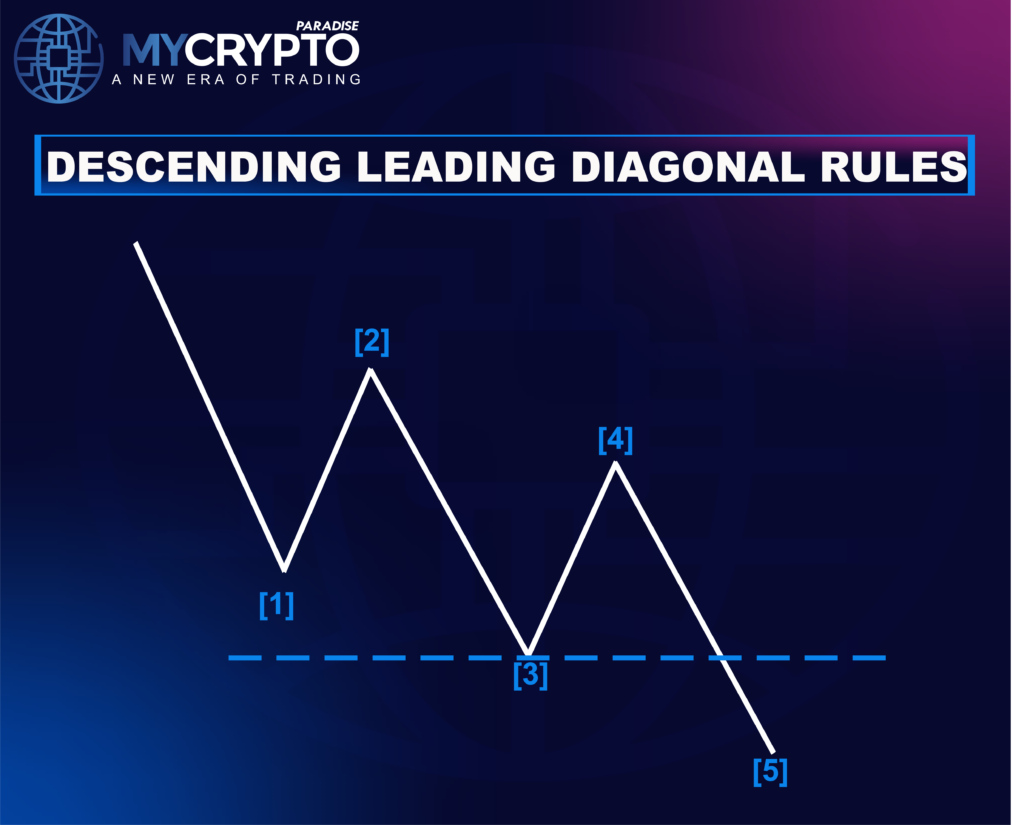
Rules for Descending Leading Diagonal:
- It forms at the start of a new downtrend, indicating strong bearish momentum. It can appear in Wave 1 of an Impulse or Wave A of a Zigzag.
- It consists of five sub-waves, where each wave follows a specific internal structure.
- Wave 1 is the Longest or Equal to Wave 3 & Wave 5:
- Unlike a standard impulse, the waves in a leading diagonal overlap, and wave 1 is usually the longest or equal in length to wave 3 and wave 5.
- Wave 2 and Wave 4 Correct in Opposite Directions. Both are corrective waves that move upward in the opposite direction of the main downtrend.
- Wave Overlap is Allowed (Unlike an Impulse). In a descending leading diagonal, Wave 4 enters the price territory of Wave 1, something not permitted in a standard impulse.
- Wedge-Shaped Structure. The diagonal formation converges, often resembling a falling wedge or a contracting diagonal.
- Wave 5 Breaks the Wedge and Confirms the Downtrend: Once the structure completes, the price often accelerates downward, signaling the continuation of the bearish trend.
For crypto traders, recognizing a bearish leading diagonal can provide an early shorting opportunity, as the breakout to the downside often unfolds with increased momentum.
How to Trade Leading Diagonal?
Leading diagonal provide traders with early trend signals, but understanding how to trade them effectively requires a strategic approach. Since these patterns typically appear in Wave 1 of an impulse or Wave A of a zigzag, they serve as a precursor to strong price movements. Traders can capitalize on leading diagonal by recognizing entry points, stop-loss placement, and profit targets based on their unique structure.
How to Spot High-Probability Trade Setups?
Trading diagonals successfully starts with spotting the pattern early and confirming it with additional technical tools:
Recognizing the Diagonal Structure:
Here’s how you can identify diagonal structures:
- You need to look for a five-wave overlapping structure that follows the diagonal formation.
- Trendlines connecting Wave 1 and Wave 3, as well as Wave 2 and Wave 4, should show either an expanding or contracting shape.
Confirming with Volume and Indicators:
Here’s how you can use volume indicator and additional tools to identify:
- Volume tends to be lower within the diagonal but increases significantly upon breakout.
- Use Fibonacci retracements to measure potential support and resistance zones.
- Oscillators like RSI or MACD can help identify momentum shifts near the completion of the pattern.
Trading Ascending Leading Diagonal
A bullish leading diagonal signals an upcoming strong bullish move, often leading into an explosive Wave 3. Here’s the trading setup for it:
Entry Strategy:
- Wait for the completion of Wave 5 and look for a corrective retracement (Wave 2 or B) to enter long.
- Confirmation through a break above the diagonal’s upper boundary or a retest of the breakout level can improve entry precision.
Stop-Loss Placement:
- Place stops just below the low of Wave 5, as a breakdown invalidates the bullish setup.
Profit Targets:
- The first target is 1.618x the length of Wave 1, projecting the next move.
- Trail stops as Wave 3 unfolds, as this is typically the strongest price movement.
Trading Descending Leading Diagonal
A bearish/descending leading diagonal signals an impending selloff, setting the stage for a strong downward Wave 3 or C. Here’s how you can trade bearish/descending leading diagonals:
Entry Strategy:
- Short positions are best taken after Wave 5 completion and a minor corrective retracement.
- A break below the diagonal’s lower boundary signals that bearish momentum is accelerating.
Stop-Loss Placement:
- Place stops just above the high of Wave 5, ensuring protection against false breakouts.
Profit Targets:
- The 1.618 Fibonacci extension of Wave 1 provides an initial target.
- Additional downside levels can be determined by observing Wave 3 momentum.
By incorporating diagonal into a systematic trading strategy, you can position yourself ahead of major price moves.
The Leading Diagonal might look like a simple wedge, but it’s a powerful early signal of a new trend forming. At ParadiseFamilyVIP 🎖️, we help you spot these setups in real-time, providing expert insights and strategies to trade them. Join us today!!
FAQs
What is a Leading Diagonal in Elliott Wave Theory?
A Leading Diagonal is a five-wave pattern that appears at the start of a new trend, either in Wave 1 of an impulse or Wave A of a zigzag. Unlike a standard impulse, its internal waves often overlap, forming a wedge-like structure that signals the early stages of a strong market move.
How can traders use a Leading Diagonal in their strategy?
Traders can use Diagonals to identify potential trend reversals or continuations. When a Leading Diagonal forms, it suggests that a significant move is developing, allowing traders to position themselves early for breakout opportunities.
What’s the difference between a Leading and Ending Diagonal?
A Leading Diagonal appears at the beginning of a trend (Wave 1 or Wave A), while an Ending Diagonal forms at the end of a trend (Wave 5 or Wave C). Additionally, Ending Diagonals only occur in corrective structures, whereas leading initiates new market movements in both directions.
Are Leading Diagonals reliable trading signals?
Yes, the Leading Diagonal is valuable for crypto traders, but it should be used alongside other technical indicators, such as Fibonacci levels and momentum oscillators, to confirm signals. Since they indicate the start of a strong trend, proper risk management is essential when trading them.
Conclusion:
Now that you have a solid understanding of Leading Diagonals, you can apply this knowledge to spot early trend signals and position yourself strategically in the market. Recognizing these five-wave structures in Wave 1 of an impulse or Wave A of a zigzag allows traders to anticipate strong price movements and improve their decision-making.
However, technical analysis is only one piece of the puzzle. While mastering chart patterns like these gives you an edge, achieving consistent trading success requires a structured approach, strategic execution, and emotional discipline.
At ParadiseFamilyVIP 🎖️, we combine technical analysis, on-chain insights, market sentiment, and whale psychology to create a systematic trading approach. Our proven strategies deliver high-quality crypto signals and portfolio management, ensuring sustainable profitability.
👉Check availability for ParadiseFamilyVIP 🎖️ (Click it)
Our service is premium, so if you’re still building your trading capital, we recommend starting with our FREE Telegram channels to strengthen your foundation before upgrading.