


Listen: the breakdown
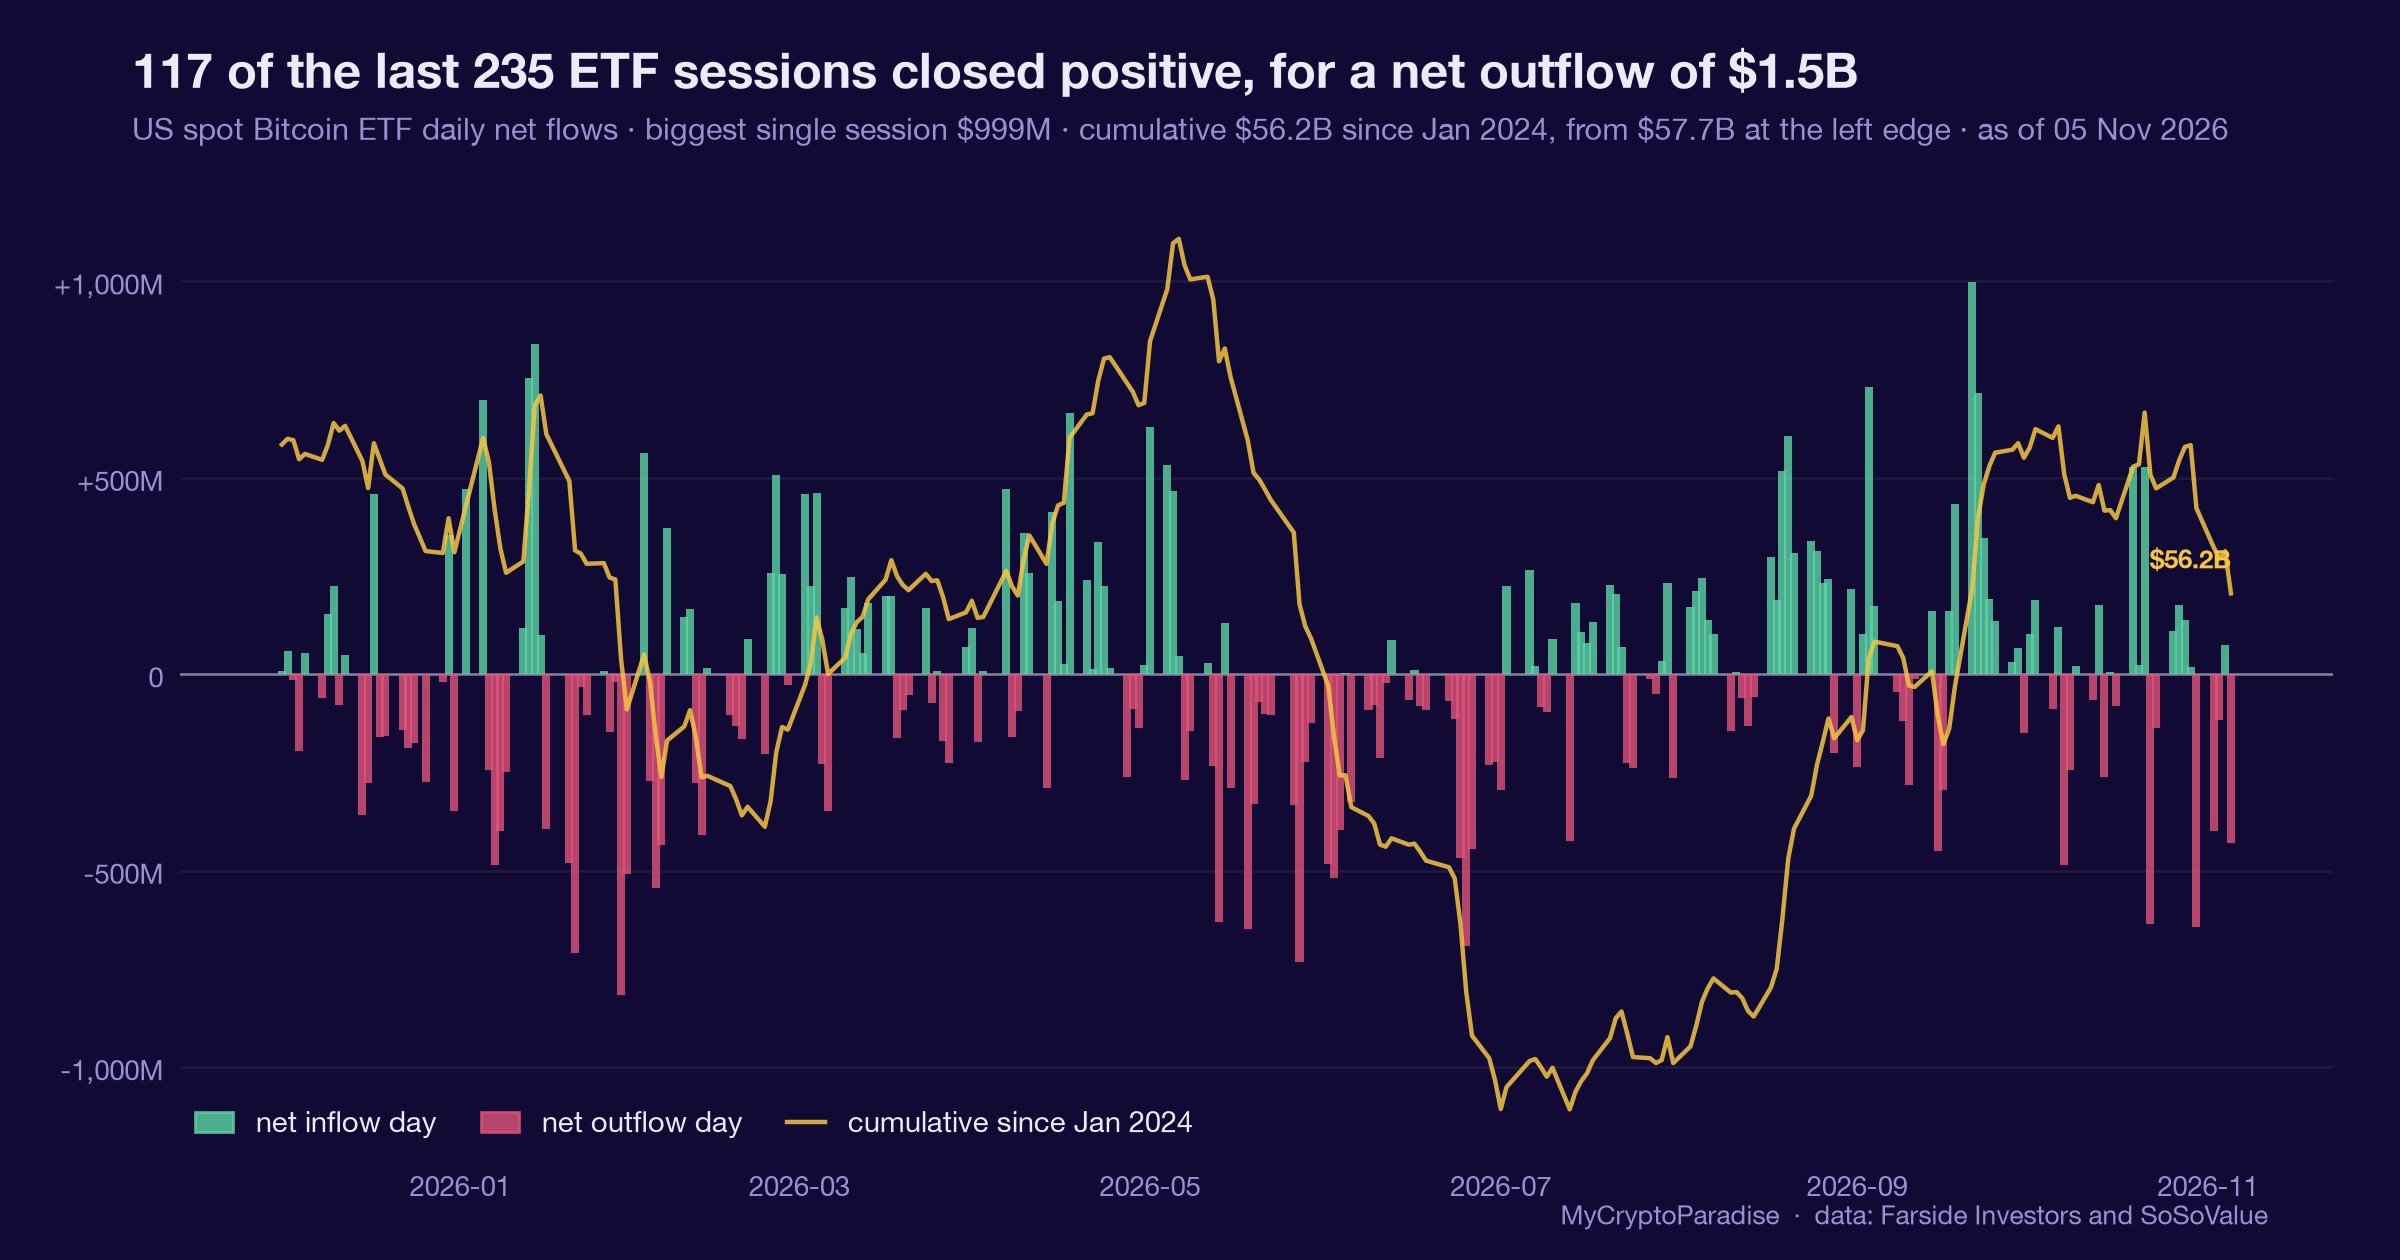
Market briefing: Bitcoin ETFs just closed their worst week since June, bleeding $1.28 billion, with Ether, Solana and Hyperliquid funds all draining too. BTC was trading near $75,709 as the whole ETF complex leaked capital.
- Bitcoin ETFs shed $1.28 billion, their worst week since June, turning 2026 net flows negative at minus $914 million
- Ether funds logged a sixth straight losing week, while Solana and Hyperliquid ETFs hit their longest outflow streaks since launch
- BTC slid to a seven-week low near $75,000 as a $530M single-day ETF outflow fed roughly $1.27B in liquidations, mostly longs
Bitcoin ETFs just posted their worst week since June, and the outflows now span Ether, Solana and Hyperliquid too. Is this a dip that pays buyers, or institutions walking out of the room?
US spot Bitcoin ETFs just closed their worst week since June. They shed $1.28 billion in net outflows. That single number drags their 2026 tally underwater, to a loss of $914 million for the year.
This was not one bad Friday. BlackRock's IBIT, the largest fund in the complex, lost money in every session of the week. Fidelity's fund managed a positive week, but the broader tide ran one way.
The problem spreads well beyond Bitcoin. Ether funds added $365.2 million in outflows over the same stretch, their sixth straight losing week. Combined Bitcoin and Ether redemptions for November 2 to 6 reached $1.65 billion.
Then there are the newer products. Solana and Hyperliquid ETFs are now running their longest outflow streaks since they launched. The pattern is uncomfortably consistent across the whole suite.
Price felt it. Bitcoin slid to a seven-week low near $75,000. One session alone carried a $530 million ETF outflow, and roughly $1.27 billion in liquidations followed in 24 hours, most of them longs.
As of writing, BTC was trading near $75,709, down 0.24% on the day. The tape looks quiet. The flows underneath it do not.
We should be honest about what this is. There is no single confirmed catalyst that detonated this week. The outflow is the story, and we read it as a steady institutional retreat rather than a one-day shock.
That distinction matters. A flinch reverses. A multi-week walk-out tends to keep walking until something pays it to stop.
Institutional demand walks out across the complex
ETF flows are the clearest live read on institutional appetite for crypto. When they turn negative for a full week across four products at once, that is not noise. It is allocators trimming exposure in size.
The transmission is simple. Spot ETFs buy real coins when money flows in. When money flows out, the funds sell to meet redemptions. That selling lands directly on the spot market, not on a side ledger.
So a $1.28 billion Bitcoin outflow is not an abstract sentiment figure. It is actual supply hitting bids that were already thin. IBIT's $403 million of selling last Friday alone shows how concentrated that pressure can get.
Here is the macro layer. Through 2025 and 2026, steady ETF inflows acted as a marginal buyer that absorbed sell pressure and cushioned dips. Remove that buyer and the floor gets softer.
Six losing weeks for Ether tell the same story from a different asset. This is not a Bitcoin-specific wobble. It is capital stepping back from the entire spot-crypto wrapper.
The 2026 balance turning negative is the quiet tell. A year of launches, marketing and record headlines, and the net institutional money is now underwater. The glossy brochure and the balance sheet have parted ways. That is the mechanism we care about: fading net demand, right as price tests the levels that decide the next leg.
Thinner bids meet a seven week low
The liquidity picture here is straightforward and not comforting. When the marginal buyer leaves, every down-move travels further on less volume.
Start with Bitcoin. The seven-week low near $75,000 did not arrive on heavy conviction selling alone. A $530 million ETF outflow in one session removed steady bids, and the market filled the gap with forced selling. Roughly $1.27 billion in liquidations followed, mostly longs.
That is the cascade in miniature. Thin bids, a redemption, long liquidations, lower price, more redemptions. Each step feeds the next.
Ether sits in a weaker spot. Six straight losing weeks means its ETF demand has been fading longer than Bitcoin's. When BTC wobbles, ETH usually falls harder, and a drained flow backdrop removes the dip buyers that normally catch it.
Then the alts. Solana and Hyperliquid ETFs posting their longest outflow streaks since launch is a clear signal. The newest, highest-beta exposure is being cut first. SOL was down 1.1% on the day, lagging a near-flat BTC.
This is the order of pain we expect. Capital exits the riskiest wrappers first, then the majors, then it waits. Alts tend to bleed widest because they lean most on incoming liquidity.
On its own facts, this reads as distribution, not accumulation. The dominant issuer sold every session while price fell. That is institutions leaving, not quietly building. We treat broad, persistent outflows as a genuine demand problem until the flows themselves turn.
Six losing weeks test the $76,000 line
The single number to track is the weekly ETF flow itself. One green week does not end a six-week trend, but it is the first honest sign that the selling has exhausted.
Watch IBIT specifically. It bled every session last week. A run of positive days there would tell us the largest allocator has stopped trimming, which matters more than any one price candle.
On price, $76,000 is the line in the sand. It sits at the top of the first wave and acts as our invalidation level. Bitcoin reclaiming and holding it, with flows stabilising, would argue the dip bought itself.
Lose it with conviction, and the $70,000 to $71,000 region comes into play. That zone holds a cluster of long liquidations, and a flow-starved market would struggle to defend it.
The confirmation we want for the bearish read is simple. Continued weekly outflows, IBIT red, and ETH extending its losing streak to seven would all say capital is still walking out.
The invalidation is equally clear. Flows flipping positive across the complex, IBIT buying again, and Solana and Hyperliquid snapping their outflow streaks would mean the room is refilling.
Until then, watch flows before you watch candles. Price can bounce on short-covering while the underlying demand keeps draining. A relief rally on empty flows is a trap, not a trend.
The week ahead decides which this is: a dip that paid buyers, or the start of something longer.
Why broad outflows outweigh dip buying
The ParadiseTeam reads this outflow week through one lens: demand, not direction alone. The flows say institutions are stepping back, and that sits on top of our standing bearish daily and weekly structure toward $44,000.
Start with the number that matters to us, $76,000. It is our key support and invalidation level. BTC was trading near $75,709 as of writing, already pressing against it with ETF bids draining away.
Here is the tension. On the daily, this broad distribution fits our dominant bearish thesis cleanly. Capital leaving the whole ETF complex is exactly what a larger move toward $70,000 to $71,000 would need.
But the shorter timeframe is not one-way. We have watched whales net buy this dip over the past 24 hours, absorbing sell pressure, and price has refused to break its prior low despite heavy volume. That hints at a possible bullish divergence.
So we hold two ideas at once. The outflow data is genuine distribution and a real demand problem. Yet a short-term squeeze toward the $81,700 to $82,500 liquidation cluster stays on the table if shorts crowd in here.
Our caution is this. Any bounce into that resistance band is a relief move to respect, not a trend change. Retail bought the $81,000 area last time at peak greed and became exit liquidity.
Treat strength as short-covering until flows actually turn green. The room emptied this week. It has to refill before the floor firms.
The read behind this: we framed this story through our own market analysis, Bitcoin Squeeze to $82K or Crash to $44K?
Track it live: our live crypto funding rates and the Crypto Fear and Greed Index both update in real time, so you can watch this shift for yourself.
Related coverage
For exact entries, targets, and stop losses with full risk management, that is what ParadiseFamilyVIP is for. New to reading these moves? Start with our crypto trading strategies guide.
ParadiseTeam is monitoring the market situation closely, and we are taking these developments into consideration while building our trading tactics inside ParadiseFamilyVIP.
Crypto trading involves substantial risk. Prices are volatile and you can lose money. This article is educational and is not financial advice. Past performance does not guarantee future results.
Do crypto ETF outflows keep bleeding next week, or do the flows turn green?
How 2 Paradisers are calling it
The first call is still open
Free account, no password. Members just sign in.
Follow this topic: Bitcoin ETF news












Join the discussion
No comments yet. Members, share how you are reading this.