

In short
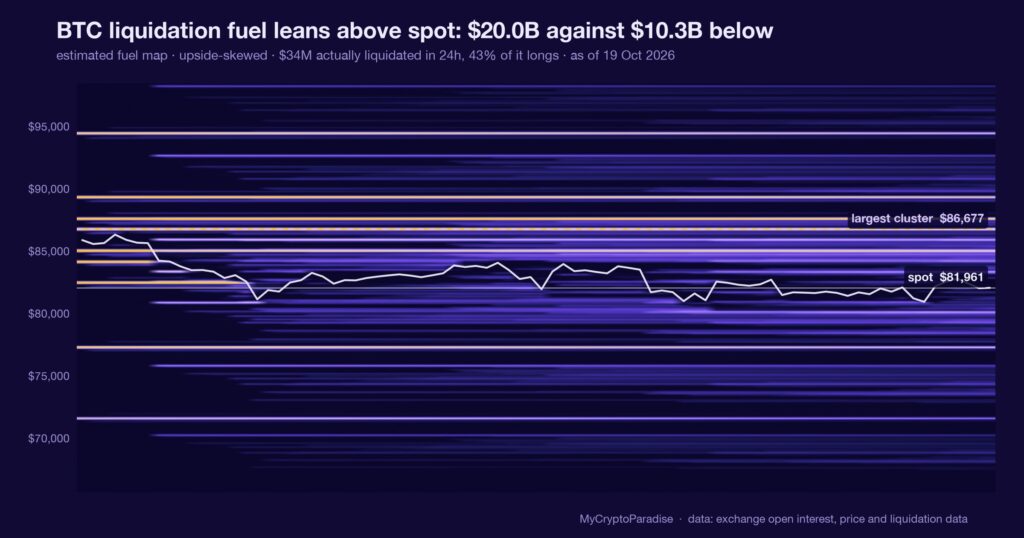
A liquidation fuel map estimates where leveraged positions get force-closed, so an upside skew means more stops sit above price than below. On 19 October 2026, our MCP Insights model read BTC at $81,983 inside a detected range of $74,955 to $87,399, confirmed on 22 September and unbroken since, with $19.99B of estimated fuel above spot against $10.30B below: a 1.9 to 1 upside lean, and ETH steeper at 2.8 to 1. The source feed flagged altcoins slipping from roughly $570B to $490B, a figure we cannot verify in our own tools. We lean modestly constructive while BTC holds that range, and we are explicitly not calling a bottom. Base rates are not wired, so no historical frequency is claimed, and these are model estimates, not calibrated probabilities. This piece shows you how to read the fuel map yourself before trusting an altcoin support line.
Key facts
- BTC price at the reading
- $81,983
- Range state
- price is inside a detected trading range
- Top of the current detected range
- $87,399
- Bottom of the current detected range
- $74,956
- What would prove this read wrong
- A daily BTC close below the detected range low at $74,955, or the liquidation fuel skew flipping back below spot: either removes the mid-range footing and turns the mild upside tailwind into a headwind.
- Reading taken
- 19 October 2026
- Source
- Our MCP Insights tools, from Binance (data.binance.vision) and OKX. Taker-flow: Binance spot. Upstream data published by Binance public market data
Altcoins borrow the majors’ liquidity
The total value of altcoins, stripped of Bitcoin, Ethereum and stablecoins, is not an independent market. It is a high-beta expression of where the two majors already sit, borrowing their liquidity on the way up and losing it first on the way down.
A liquidation fuel map reads where leveraged traders have placed the stops that an exchange closes for them automatically. When more of that forced selling and forced buying sits above the current price than below, the map is upside-skewed: the fuel for a squeeze higher outweighs the fuel for a flush lower.
A support line on an altcoin chart is a drawing. The liquidity that decides whether it holds lives on the majors, not on the line.
The fuel sits above on both majors
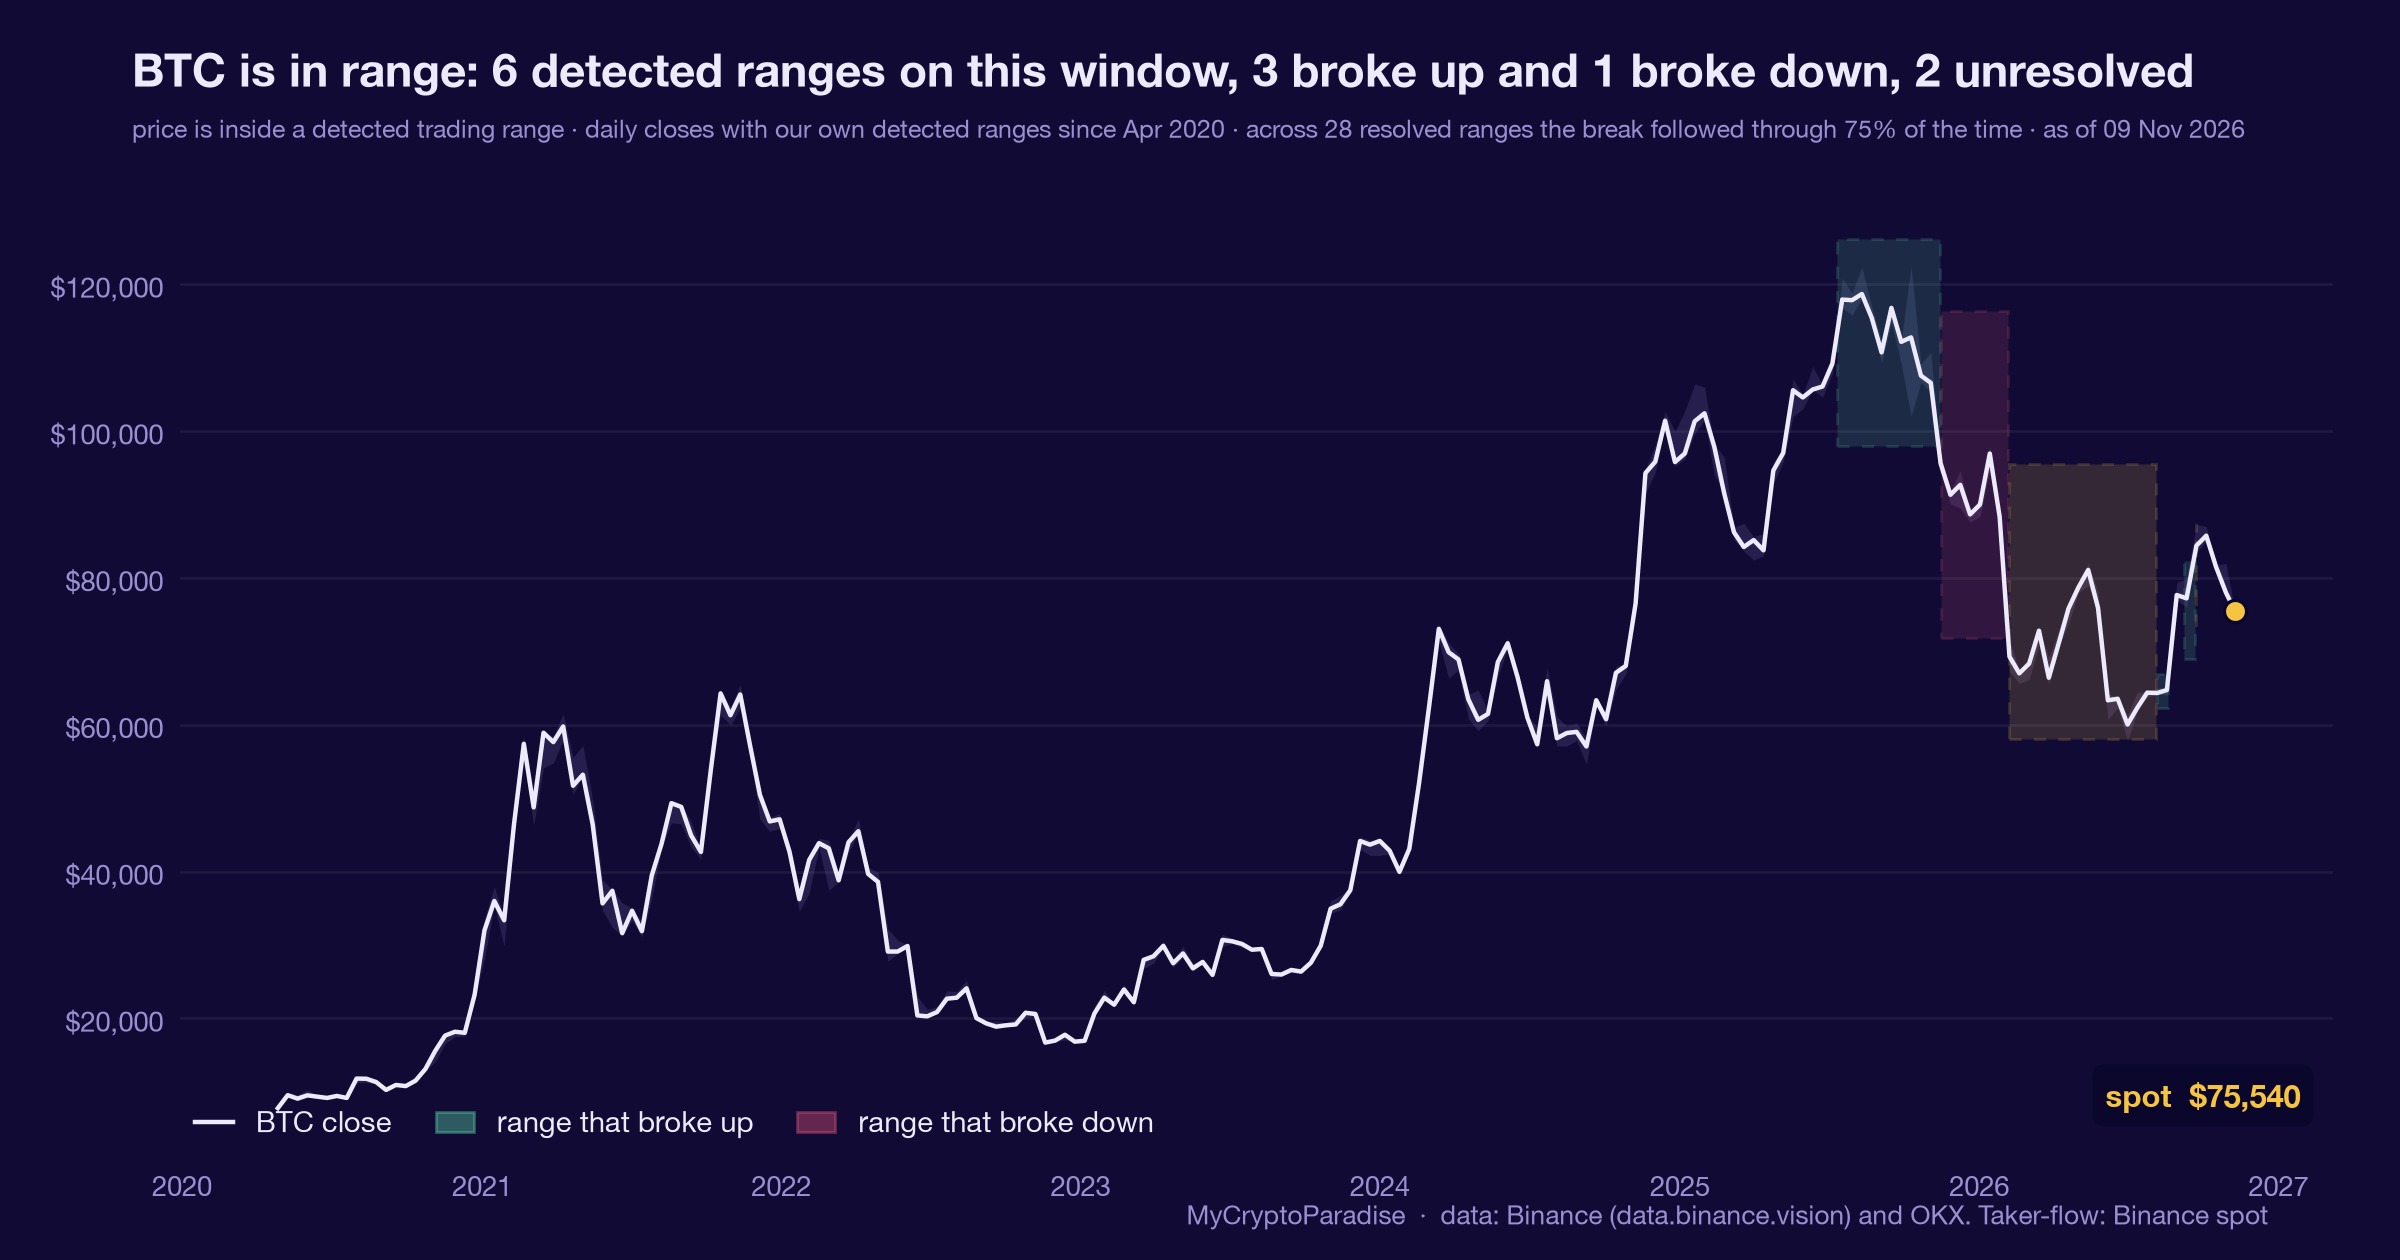
On 19 October 2026 our MCP Insights model placed BTC at $81,983, inside a detected trading range running from $74,955 to $87,399 that our detection confirmed on 22 September and that price has not left since. The tilt reads neutral: mid-range, no edge either way from the range alone.
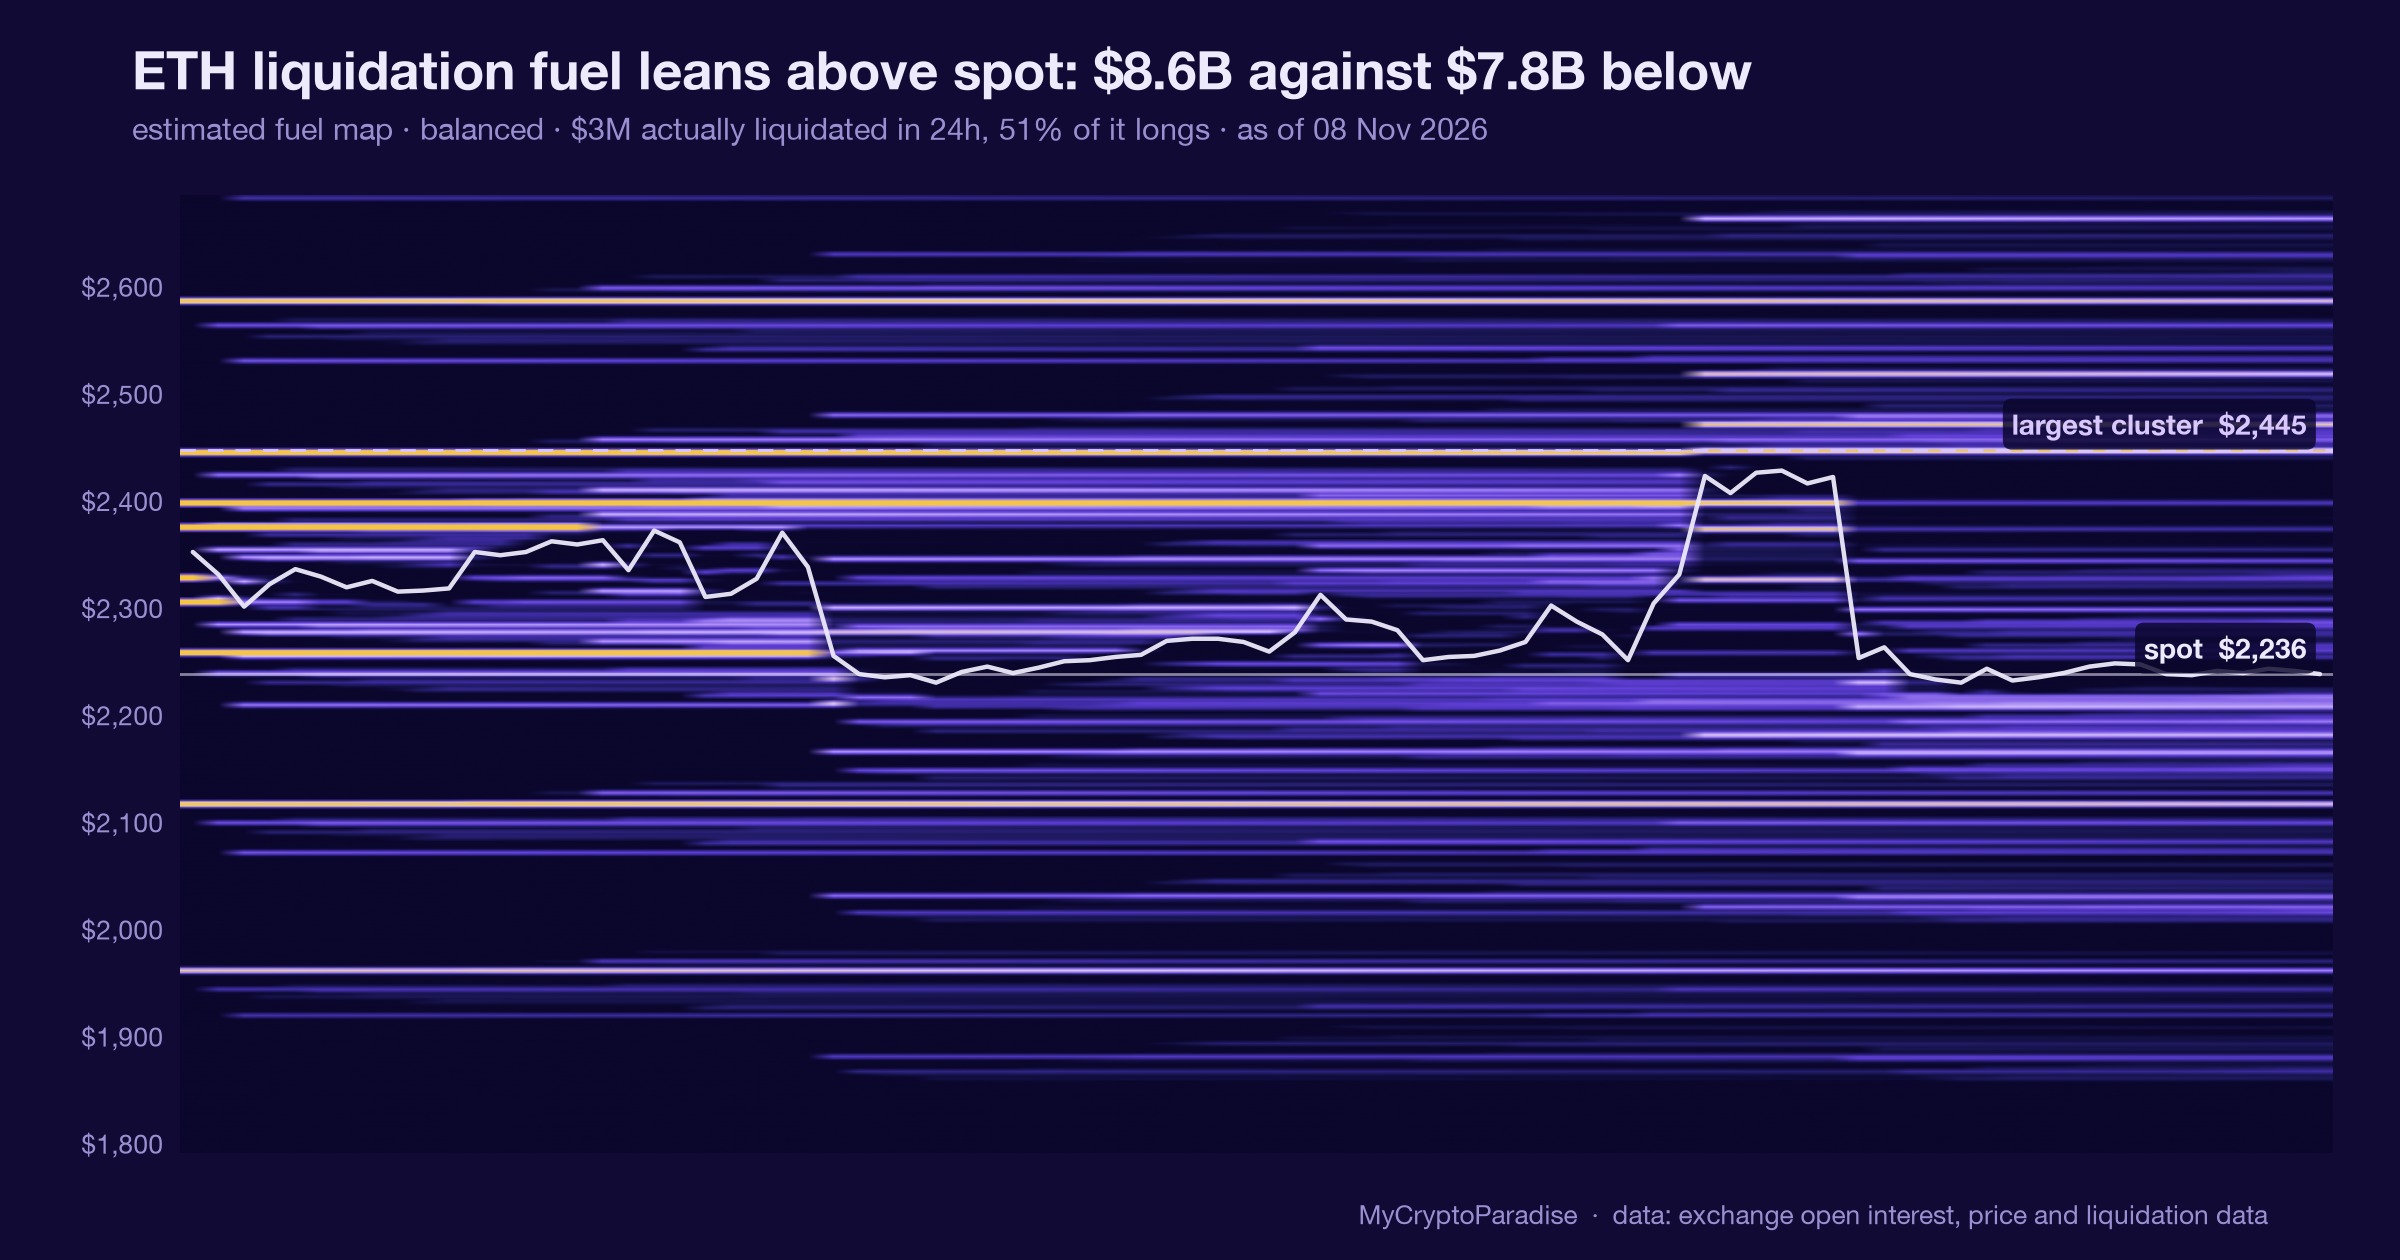
The fuel map is where the lean comes from. Our model estimates $19.99B of liquidation fuel above BTC spot against $10.30B below, a 1.9 to 1 upside skew. On ETH, at $2,402, the imbalance is steeper still: $13.60B above against $4.92B below, roughly 2.8 to 1.
The last 24 hours stayed quiet by comparison. Our exchange grid logged about $34.4M of BTC liquidations, 57 percent of them shorts, and $41.86M on ETH, split near evenly. Small flows, with the larger pockets untouched above.
Both pockets are real. This one is nearly twice the size on BTC and almost three times on ETH, and that size is the whole of the claim.
What is different here
The ParadiseTeam does not read an altcoin support line in isolation. We measure where leverage would be force-closed on the majors first, flag every reading that has not cleared calibration, and attach the invalidation before the lean. The method is the skew plus its error bar, never the skew alone.
An upside skew is not a green light
The obvious misreading is to treat this as a reason altcoins rip from support. It is not. The fuel map says where the stops sit today, not where price goes next, and a skew that leans up can be drained in an hour of real selling without a single altcoin confirming anything.
Two honesties bound the read. Base rates for range-and-fuel regimes are not wired into our lake yet, so we claim no historical frequency. And both readings carry a model-estimate flag: they have not cleared our calibration gate, which makes them a recon lean, not a probability.
The altcoin figures themselves are the source feed’s, not ours. We can read BTC and ETH fuel directly; we cannot verify a $490B altcoin support in our own tools, so we do not lead on it.
A number with no error bar is decoration. A model estimate that admits it has not been graded is at least honest about what it is.
The skew tilts the altcoin question up
Return to the source feed’s claim: altcoins have slipped toward a rising-channel support, and the question is whether it holds. Altcoins do not resolve that in isolation. They resolve it in the direction the majors take, because altcoin leverage unwinds fastest when BTC and ETH move against it.
Our fuel map says the larger forced-flow pockets on both majors sit above spot, not below. That does not promise a bounce. It says the path that liquidates the most leverage currently runs up, which is a mild tailwind for the source feed’s bullish case rather than its breakdown case.
The asymmetry is sharper on ETH, at 2.8 to 1, than on BTC, at 1.9 to 1. Ethereum tends to lead altcoin risk appetite, so the steeper lean there is the more relevant of the two for anyone watching the altcoin channel.
The imbalance sits above. That is a statement about where the stops rest right now, and it stops being the higher-probability reading the moment BTC closes a day outside its range.
One input, weighed against the rest
Since our range detection confirmed on 22 September, BTC has done nothing dramatic: it has stayed inside the $74,955 to $87,399 band, closing neither above nor below it. The neutral tilt has graded correctly so far, which is a low bar and worth saying plainly.
This is one input. The fuel map sits alongside funding, open interest (OI) and spot absorption, and today it is the reading that leans while the range itself stays neutral. On its own it is a lean, not a conclusion, and the rest of the layers live in PRO Paradiser.
A fuel map is a probability weight on a bias, not the bias itself. It earns one line of risk, and the invalidation is what keeps that line honest.
Reading the fuel map yourself, step by step
- Open the liquidation heatmap and find spot, then read how much estimated fuel is stacked above price versus below it.
- Convert the two sides to a ratio, not a feeling: $19.99B over $10.30B is 1.9 to 1, and the ratio is the claim.
- Check whether the reading carries a model-estimate flag; if it has not cleared calibration, treat it as a lean, never a probability.
- Mark the invalidation before you act: for this read it is a daily BTC close outside its $74,955 to $87,399 range.
- Cross it against funding and open interest so one skew does not become your whole thesis in a single market.
The step skipped most is the third: a skew quoted without its calibration flag reads like a fact, when it is a model estimate that has not yet been graded.
Every number above is checkable against the live data. Start with the MCP Insights hub, then cross-read the Crypto Fear and Greed Index and the live crypto funding rates.
Act and invalidate
| Scenario | What confirms it | What kills it |
|---|---|---|
| Majors hold, upside fuel drains | BTC holds its range, shorts cover | BTC daily close below $74,955 |
| Altcoin support holds, move higher | ETH leads, steeper skew fills | ETH rolls over on rising volume |
| Channel breaks, deeper reset | BTC daily close below $74,955 | Fuel skew flips back below spot |
Posture: Modestly constructive while BTC holds its range, defensive on a daily close below $74,955. For most, the higher-probability stance here is patience: a model-estimate skew is worth one line of risk, not a position built on an unverified altcoin support.
Frequently asked questions
What does an upside-skewed liquidation fuel map mean?
It means our model estimates more leveraged stops sit above the current price than below it. A move higher would force more buying to close shorts than a move lower would force selling. It describes where fuel rests, not where price travels.
Why read BTC and ETH for an altcoin level?
Altcoins are a high-beta expression of the two majors and borrow their liquidity. A rising-channel support on the altcoin aggregate rarely holds on its own: it holds when Bitcoin and Ethereum hold, and it fails fastest when they roll over.
Is this a forecast that altcoins bounce?
No. The fuel map is an observation about where stops rest on 19 October 2026, not a prediction about the next move. The skew leans up, yet it can drain in a single session of real selling without any altcoin confirming.
What invalidates the constructive lean here?
A daily BTC close outside its detected $74,955 to $87,399 range, a close below the low especially, removes the mid-range footing. The fuel skew flipping back below spot would do the same, turning the mild upside tailwind into a downside one.
Why not quote a historical hit rate?
Because none is wired for range-and-fuel regimes in our data lake yet, and both readings carry a model-estimate flag that has not cleared calibration. A rate with no graded sample behind it would be decoration, so we quote the live skew instead.
Crypto trading involves substantial risk and is not suitable for everyone. Nothing here is financial advice; it is education only. Never risk more than you can afford to lose.
The private Extras feed, where the fuel map, the range-detection read and the 24-hour liquidation balance update intraday with their invalidation levels, is part of PRO Paradiser, the intelligence layer behind the ParadiseFamilyVIP strategies.








Join the discussion 26
upside fuel for alts 📈 makes me remember 2021... 😅 it was crazy, lost everything but man what a rush 🔥. maybe this time no rugs tho!?! 🤞
Watching the support lines of these smaller cap assets reminds me of checking the load calculations on secondary structural elements. Their stability is very much dependent on the main system.
Fuel map leans upside" for *altcoins* given the ETH/BTC correlation is usually a tell for me. Feels like some larger players are just waiting for liquidity to form on one side. 🤔
I just see more liquidation fuel for the altcoins 👀, and for most people that's just a reminder to stay clear of that leverage trap 😵💫. Been there, done that, never again 🤦♂️.
Leans upside" when the crowd is already so positioned often means liquidity will be found elsewhere. This fuel map seems a bit too neat, no?
Isabella, I actually see it differently. Upside liquidity for BTC/ETH can often mean a broader risk-on sentiment, which usually filters down to alts, you know? 🤔 A rising tide lifts all boats, even the smaller ones.
liquidation fuel leans upside, but the altcoin support is still the question. what is the invalidation of that support.
Upside fuel or not... leverage always finds a way to blow up someone's shift money. Saw it happen too many times, to good guys...
I just... "skewed upside liquidation fuel"? It sounds so clinical, but for altcoins it's just borrowed money that can evaporate so fast. Is the upside really worth that kind of risk?! Sorry if this is a silly question.
it's not silly but altcoins don't care how you borrowed it Marta they just take it from you
Reminds me of watching the motorcycle price climb faster than my savings in pesos. Protecting capital is key, regardless of the direction.
skewed upside liquidation fuel means one thing for them but its mostly borrowed size for the altcoins, that's just borrowed pain later
the leveraged size on altcoins is also subject to higher interest rates which adds to the 'borrowed pain' dynamic.
I see upside liquidation fuel as a sign of expiring shorts... not just borrowed size. My journal shows past squeezes have been decent if timed well...
borrowed size always has a bigger margin call coming on the other side that's why i say pain. it's not the same as organic short expiring.
The source of the short matters less than the expiration event itself. Journal entry for 12/03/2023 shows a leveraged ETH short squeeze from borrowed size, which still yielded a 2x long entry… my rule: "An expiring short is an expiring short, Derek.
an expiring short from organic sales is one thing derek when you borrow to short your collateral will be taken. that's a different kind of pain.
usd stablecoin inflows to spot exchanges have been consistent this week, so i always check those funding rates for what that borrowed size might really mean.
Upside fuel for the majors could lead to a basis squeeze on the alts, which is where things got quite painful for me in 2021. Worth watching the funding rates here.
Seeing the fuel skewed like this for BTC and ETH at open is always clean. I will be watching the 08:00 UTC levels closely today for altcoin movement.
So they saying the alts are still on a leash then? ⛓️ I was hoping for more freedom 🚀, my cousin keeps asking me when I'll buy him a Benz 🙄.
I always worry about these kinds of forecasts, what if they're wrong and the dominoes start falling faster? 😟
That's what I was thinking too, Yuki! 😟 It makes me wonder if there's a certain "tipping point" for these... dominoes...
its why i always look at the level on BTC and ETH first. what other level matters
i do still get a bit lost with the altcoin bits but i'm trying to remember that its all connected to the big ones, like watching a bunch of little boats with the tide 🌊
that's a good way to put it Grace. the small boats move with the big ones but the smaller ones can capsize quicker in a squall.