- The Triple Bottom Pattern is a bullish reversal chart formation that signals a potential upside breakout after a prolonged downtrend in crypto markets.
- Crypto traders should always wait for a confirmed breakout above the resistance level and combine it with volume confirmation, support/resistance analysis, and disciplined risk management to improve success rates.
- While the Triple Bottom Pattern provides valuable insights, its reliability also depends on broader factors, including technical indicators, overall market conditions, and external news events.
The Triple Bottom Pattern stands out in crypto trading as one of the most dependable and dynamic signs that a bearish trend might be running out of steam. It’s a bit like getting a hint before everyone else, which gives you time to prepare, line up your trade, and catch the surge as the price breaks out, riding that fresh wave of buying momentum.
This guide is part of our MCP University FREE advanced learning series for crypto traders. You’ll see how to spot, confirm, and trade the Triple Bottom Pattern with real clarity, discipline, and the kind of precision the pros use.
Introducing the Triple Bottom Pattern
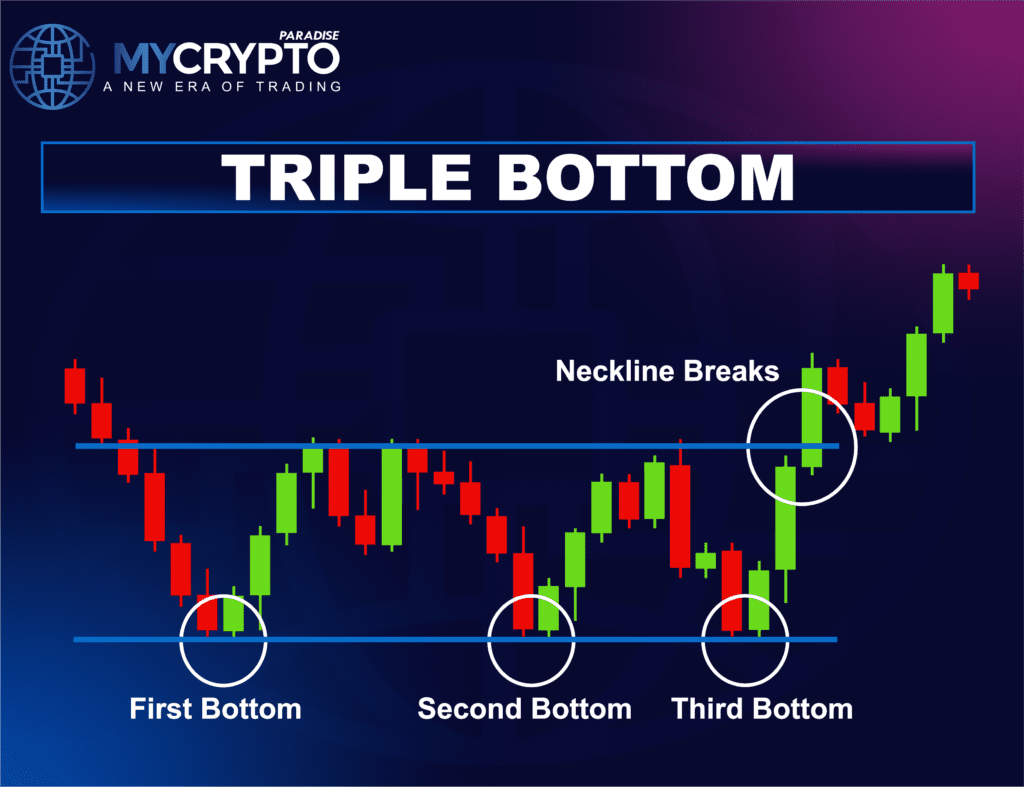
So, what’s a Triple Bottom Pattern? Imagine, after a serious downtrend, the price finds its base and forms three relatively equal lows, all along nearly the same support line or zone. Each time the price tests this level, buyers push back & they won’t let it fall. Between those lows, the price keeps hitting a ceiling. This is your horizontal resistance, a barrier that bulls just can’t crack yet. You get a market that’s bouncing between those two lines, the base nice and flat, showing buyers aren’t giving up, but there’s a stubborn group of sellers keeping things in check.
What does this really tell you? Sellers are pushing, but not winning. Every time the market dips to support, it can’t break through, and buyers become increasingly confident. Then a breakout happens. The price finally blasts past resistance, usually with heavier volume, and now it’s clear that buyers are in the driver’s seat.
You usually find a Triple Bottom after a long stretch of downtrend or during a lull when the market seems to be storing up energy. Think of it as a kind of market reset where sellers are worn out, buyers are quietly taking charge, and everyone’s waiting for a spark. That spark is the breakout, and once it surges, upside volatility often accelerates, leading to dramatic moves.
How to Identify the Triple Bottom Pattern
So, how do you actually spot a Triple Bottom? Here’s how you break it down:
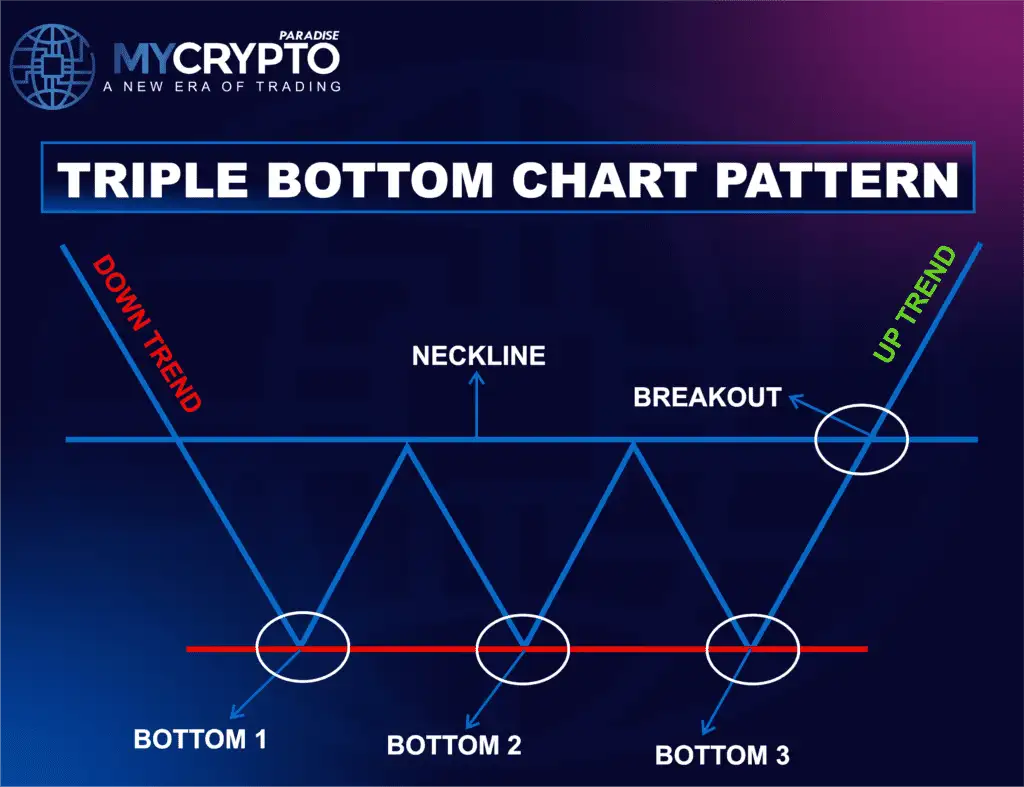
Prior Downtrend
First, you need that established downtrend. This pattern doesn’t mean much without a clear fall leading up to it. It’s a reversal pattern, so you need a sign that the bears have been in control.
Three Equal Lows
Count the lows. You’re looking for three separate dips, all of which bottom out around the same price. Every time the market touches this level, buyers step up and refuse to budge, indicating there’s strong support at that zone.
Resistance Level Formation
In between those lows, watch what happens with rallies. The price should continue to rise toward a clear resistance line. This forms your ceiling. You’re looking for repeated failures to push above this line, & it’s where sellers are still holding on.
The Breakout Confirmation
Now, for the big moment: the breakout. You have to see the price breaking through that resistance with conviction, ideally backed by a spike in volume. That’s the good confirmation that the bulls are taking charge and a reversal is in process.
Of course, not every setup is perfect. Sometimes the lows are uneven, or the breakout fizzles out with weak volume, and that’s a warning sign that the pattern isn’t as strong.
Now, it’s just a matter of putting it into practice. With a little patience and careful analysis, the Triple Bottom can become one of your go-to setups for navigating volatile crypto markets with a lot more confidence.
Is the Triple Bottom Pattern Bullish or Bearish?
The Triple Bottom Pattern is bullish, but still, you can’t just spot it anywhere in a chart, and if you’re trying to read this pattern, you need to understand the broader market mood before you act.
Bullish Reversal Pattern
Most often, the Triple Bottom pops up after a downtrend. Sellers have been hammering the price for a while, but each time, buyers step in at the same critical support level and refuse to let it drop further. You see three separate “fails” to break that support. Each bounce is the buyer quietly soaking up whatever the seller throws at them. When the price finally pushes above resistance with conviction, strong volume and momentum. It’s a big hint that the bears are losing control, and the bulls start flooding in.
Bullish Continuation Structure
Here’s another twist: sometimes you’ll see a Triple Bottom form up in the middle of an uptrend. Imagine the market has pulled back slightly and shows nothing major, just a brief pause. During this pullback, buyers defend support again and again. It signals consolidation, not exhaustion, but focus. The market’s just catching its breath before charging upward. Once the breakout of the resistance occurs, the uptrend springs back to life, often with even more energy.
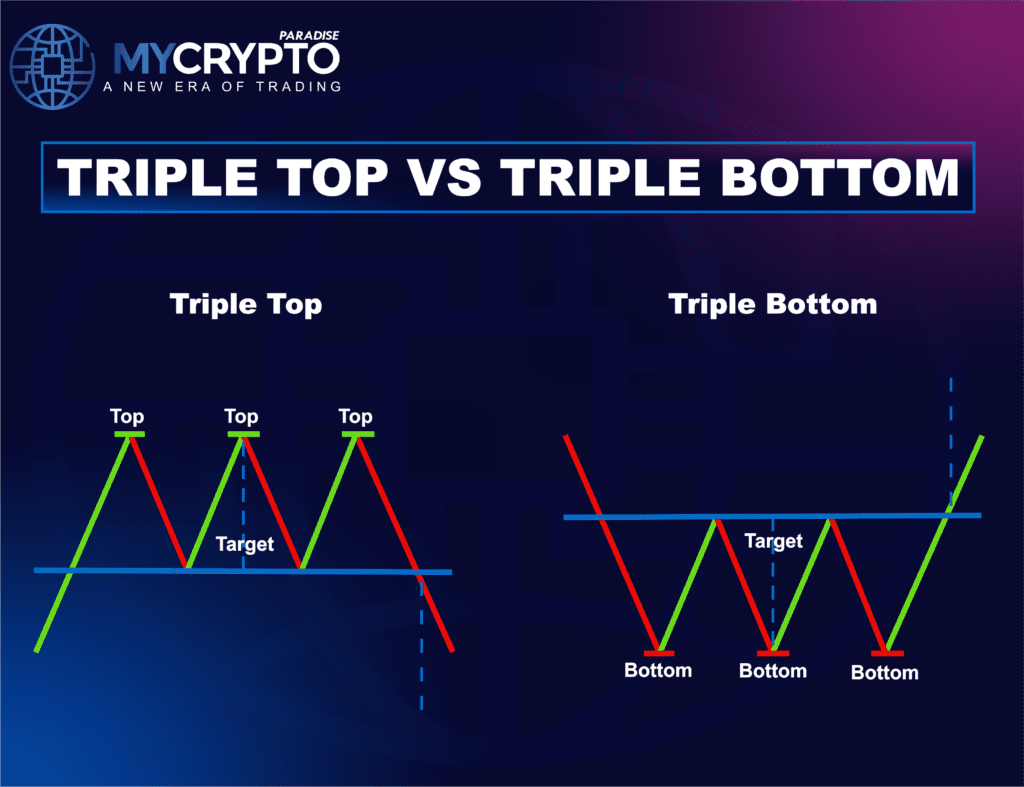
Triple Top Pattern (Bearish Reversal Pattern)
The Triple Top pattern typically appears after an uptrend. Buyers have been in charge, driving prices higher again and again, but every time the price hits a certain level, sellers slam the brakes. You’ll see the market try to break through that resistance three different times, and each time, it just can’t make it. Sellers are there, soaking up all the buying pressure. When the price finally slips past support with heavy volume, it’s clear. The bulls are out of steam, and that’s when the bears step in.
How Reliable Is the Triple Bottom Pattern?
If you’re looking at reversal patterns, the Triple Bottom has a solid track record, especially right after a long downtrend. But reliability isn’t just about the pattern itself. You need strong confirmation, a big breakout with volume and meaningful price action to really trust it.
Statistical Performance
People have run the numbers, and yes, historically, Triple Bottom patterns deliver bullish breakouts fairly often and break the resistance cleanly. The odds get even better if the breakout occurs when the market is optimistic, and larger trends appear to be shifting in favour of buyers.
Key Conditions That Boost Reliability
- You want the pattern to come after a clear, lengthy downtrend. That tells you selling pressure is being absorbed, not just paused.
- Watch the volume. It usually decreases as the pattern forms and then surges when the breakout occurs.
- Check momentum indicators. If they start swinging bullish, it means the market stops making new lows (a big tip).
- Look for strong bullish candles when the price breaks through resistance, followed by steady buying. That’s where the most reliable uptrend starts.
When all these signs line up, the Triple Bottom Pattern becomes one of those patterns which crypto traders hunt for, a high-probability setup for a trend flipping from bear to bull. Still, you have to keep your guard up. Messy, sideways markets or weak breakouts can trick you with false signals. That’s why smart traders always hold out for crystal-clear confirmation before jumping in.
How to Trade the Triple Bottom Pattern
Trading the Triple Bottom Pattern takes more than just spotting three lows on a chart. You need real patience, a sharp eye for confirmation, and the discipline to stick to your risk rules. Here’s how pro traders put all the pieces together.
Entry Strategy
- First, for the entry: Most traders like to jump in as soon as the price breaks above resistance, especially if volume also increases at the same time. That volume kick is key, as it indicates that buyers have truly stepped in and the bears are losing their grip. This is the aggressive way in which traders enter the market the moment they see a strong close over resistance.
- Serious traders like to take a moment to consider their actions. They’ll wait for the price to break out, then watch for a retest of that old resistance, which should now act as support. It’s not always guaranteed you’ll get this chance, but if you do, you’re often rewarded with a cleaner entry and a tighter stop. Basically, it’s like getting in at the ground floor, but after you’ve seen the elevator actually work.
Stop-Loss Placement
Where do you put your stop-loss? Drop it just below the support or 78% of the fib level where the three bottoms were created. This way, if the pattern fools you and the price drops back down, you cut your losses before things get out of hand. It’s all about protecting your capital.
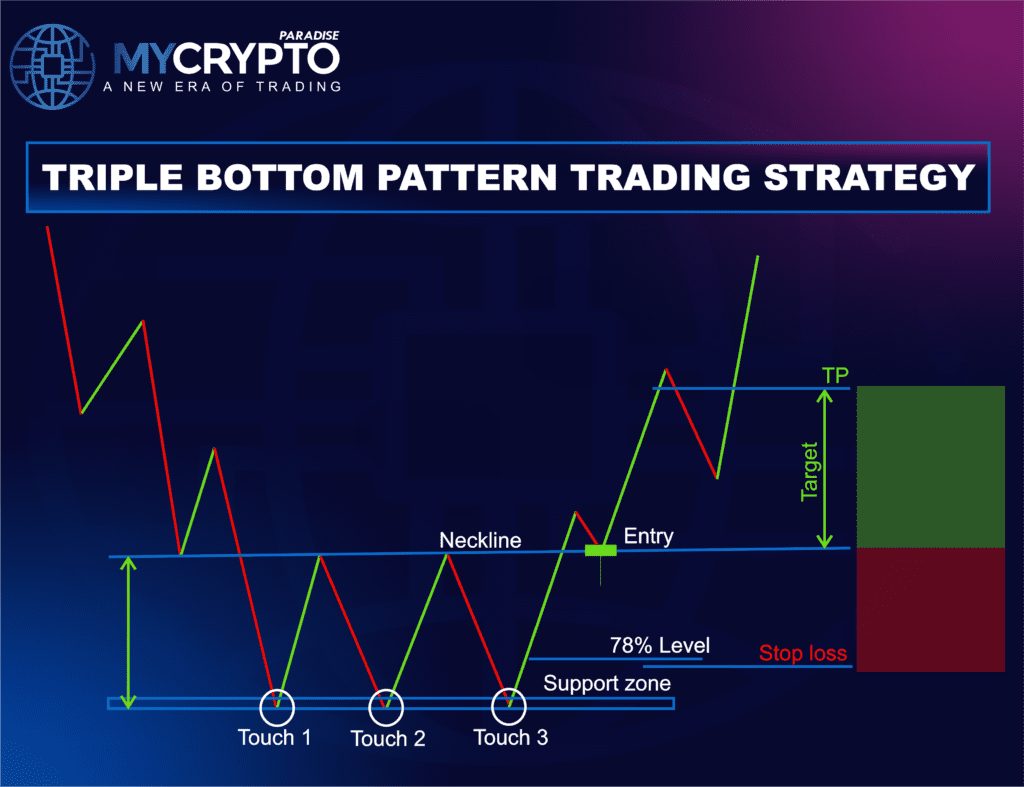
Take-Profit Targets
- There are a couple of good approaches here. One classic method is to measure the “height” of the pattern, the space between the lowest low (support) and the horizontal resistance. You take that distance and add it to the breakout point to estimate where the price might go.
- Another approach is to look for prior swing highs, near resistance levels, or Fibonacci extension points. These areas often attract sellers, and they give you a roadmap for taking partial or full profits before the next battle between bulls and bears begins.
Putting it all together, confirmed breakouts, carefully chosen entries, well-placed stops, and smart profit targets let crypto traders approach triple bottoms with confidence. This structure isn’t just for comfort. It’s the backbone of consistent, long-term results in a market that loves to surprise people.
Triple Bottom Versus Similar Chart Patterns
Now, you need to understand what distinguishes the triple bottom from similar chart patterns. In crypto, there are plenty of bullish reversal patterns, but the triple bottom stands out for good reason because it’s all about buyers digging in to defend a specific level, not once, but three times. That kind of stubborn demand sends a message that the sellers are fading, and momentum is ready to flip.
Triple Bottom Versus Double Bottom
- Compare that to the double bottom. A double bottom can spark a rapid move up, but only after the price tests support twice.
- It’s a decent reversal signal, but sometimes it happens so quickly that you miss the setup. With a triple bottom, you get more data; like, three reactions say a lot more than two.
- The steady defence builds a stronger case that buyers have the upper hand before the breakout.
Descending Channel Versus Triple Bottom
- In a descending channel, the price continues to drift downward between two sloping lines.
- Sometimes it’ll snap back and break out higher… But there’s no clear trigger, no moment where buyers clearly say, “This stops here.” The triple bottom is sharper.
- It draws a solid line in the sand. When a price bounces off the same level repeatedly, you know there’s real buying interest, and identifying your entry, stop, and target becomes so much clearer.
Triple Bottom Versus Falling Wedge
- The falling wedge is a little different. Both trendlines slope downward and converge, causing the price action to become increasingly tight until one of them eventually gives way.
- Falling wedges often pop higher too, but they show compression, not repeated defence of a single level.
- The triple bottom actually highlights a demand zone, a spot where buyers step up repeatedly, showing clear intent to reverse the trend.
Because the triple bottom pattern is so straightforward, buyers holding the line multiple times give traders more confidence when planning reversal trades. You can spot the zone, wait for confirmation, and know you’re looking at a genuinely strong setup for a bullish move, not just another random bounce.
Common Mistakes to Avoid With the Triple Bottom Pattern
Spotting a Triple Bottom can set you up for a solid bullish move, but if you overlook a few key things, what looks like an easy win can turn into a headache fast.
Entering Before the Breakout
Traders get excited and enter before the price really breaks out. You see the price hanging below resistance and think, “This is it”, but if you’re wrong, that “breakout” fizzles, and you’re left sitting in a losing trade. You need a solid close above resistance before you’re in business. Otherwise, you’re just guessing.
Ignoring Breakout Strength and Momentum
Not every breakout is real. Sometimes, the price barely crawls through resistance, trading just a little higher before rolling over. This is usually a fake-out, especially if there isn’t a surge in volume or strong bullish candles. Real moves need momentum and commitment. If you don’t see that, it’s probably not worth jumping in.
Forcing the Pattern on Charts
Just because the price poked around a support level a few times doesn’t mean you have a textbook Triple Bottom. You need to see three clear lows, all near the same spot, not some messy cluster in choppy markets. Trying to “see” a pattern that isn’t there sets you up for failure.
Ignoring the Higher Timeframe Context
Context is everything. If the Triple Bottom forms, but the bigger trend is still screaming down on higher timeframes, your odds drop fast. The pattern works best when the overall market is ready to switch gears or when selling is starting to lose its grip.
Poor Risk Management
Risky stop-losses or risking more than you should lose are the ways to blow up your accounts. Stops should be placed below the support or at the 78% Fibonacci level, and your position size should align with your rules.
Overlooking Market Conditions and News
Technical setups don’t survive big surprises. Major news, wild volatility, or sudden shifts in market sentiment can disrupt clean patterns. Don’t ignore what’s happening outside your chart.
Conclusion
The Triple Bottom Pattern can be a great way to catch trend reversals in crypto, especially when sellers are running out of steam and buyers are ready to push higher. Look for strong volume, good support, and a decisive breakout, as these are the key ingredients for high-probability trades.
But here’s what separates pro traders from the rest, they don’t just spot the pattern. They wait for confirmation, manage risk with discipline, and remain vigilant to the broader market environment. No trading setup is perfect, but if you stack the odds in your favour and stick to your plan, a real Triple Bottom Pattern gives you an edge worth using.
At ParadiseFamilyVIP🎖️, we help traders refine their skills in real-time, combining technical precision, market psychology, and disciplined risk control to build long-term trading performance.
👉 Join ParadiseFamilyVIP🎖️ today and start trading with professional structure and discipline. Membership slots are limited. Secure your access or join the waiting list to stay prepared for the next major breakout opportunity.
FAQs
What is the Triple Bottom pattern in crypto trading?
A Triple Bottom forms when price tests the same support level three times while failing to break lower. This repeated defence shows that buyers are absorbing selling pressure, and if the price eventually breaks above resistance, it often signals a bullish reversal.
Is the Triple Bottom pattern bullish or bearish?
It’s a bullish pattern. The pattern typically emerges after a downtrend, where sellers repeatedly fail to drive the price lower, and buyers begin to regain control.
How do I confirm a Triple Bottom pattern?
Confirmation occurs when the price breaks and closes above the resistance level that formed between the three bottoms. A strong breakout with increasing volume strengthens the validity of the pattern.
Which timeframe works best for the Triple Bottom pattern?
Higher timeframes, such as 4H, daily, or weekly charts, tend to provide more reliable setups. These timeframes reduce market noise, making support and resistance structures clearer.
How can traders use the Triple Bottom pattern effectively?
Focus on setups that form after a clear downtrend and wait for a confirmed breakout above the resistance level. Combine the pattern with volume analysis, proper stop-loss placement below support, and disciplined position sizing.
Can the Triple Bottom pattern fail?
Yes, it can. Failures often occur when traders enter before the breakout confirmation or ignore broader market conditions. Using stop-loss levels and respecting invalidation points helps protect capital if the setup does not play out as expected.