- The Doji Pattern is a high-impact candlestick formation that reflects market indecision, signaling potential trend reversal, trend continuation, or volatility shift depending on context within crypto markets.
- Crypto traders should never rely on a Doji in isolation. True accuracy comes from combining it with volume, trend structure, support/resistance levels, and disciplined risk management.
- While the Doji Pattern can deliver exceptionally strong signals, its reliability depends heavily on surrounding candles, broader market conditions, and the behavioral context driving indecision.
The Doji Pattern is one of crypto’s most important candlestick signals. Proper understanding allows crypto traders to spot indecision before major market shifts. This gives them an edge in anticipating reversals or confirming continuation setups with precision.
At MCP University FREE, this guide is part of our advanced learning series for traders who demand clarity in volatile crypto conditions. By the end, you’ll know exactly how to read, confirm, and trade Doji patterns with professional accuracy and disciplined strategy.
Introducing the Doji Pattern
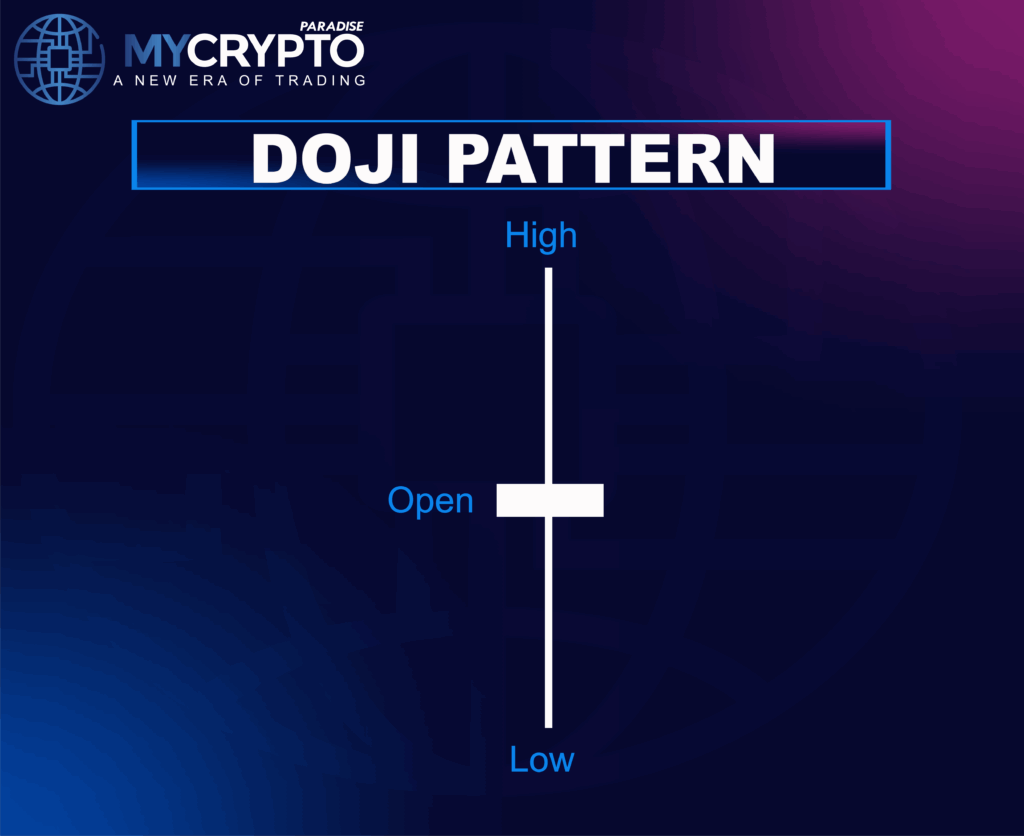
A Doji Pattern forms when the market opens and closes at nearly the same price, creating a candle with a very small body and distinct upper and lower wicks. This structure represents a temporary balance between buyers and sellers, signaling hesitation or uncertainty in the market.
The thin candle body reflects that neither side gained meaningful control during the session. Buyers attempted to push upward. Sellers attempted to push downward. The market ultimately settled near the open price. This creates a moment of equilibrium where short-term direction remains unclear
Although the candle shows indecision, it is rarely neutral in meaning. The wick behavior reveals hidden sentiment. Long wicks show aggressive but rejected moves. Short wicks show tight hesitation. Whether forming near support, resistance, or mid-trend, the Doji becomes a critical signal of potential change or continuation.
This candle typically appears during exhaustion phases, consolidation zones, or key turning points in trends. It reflects an internal shift in market participation, giving crypto traders an early warning that momentum may slow, reverse, or accelerate soon.
How to Identify the Doji Pattern
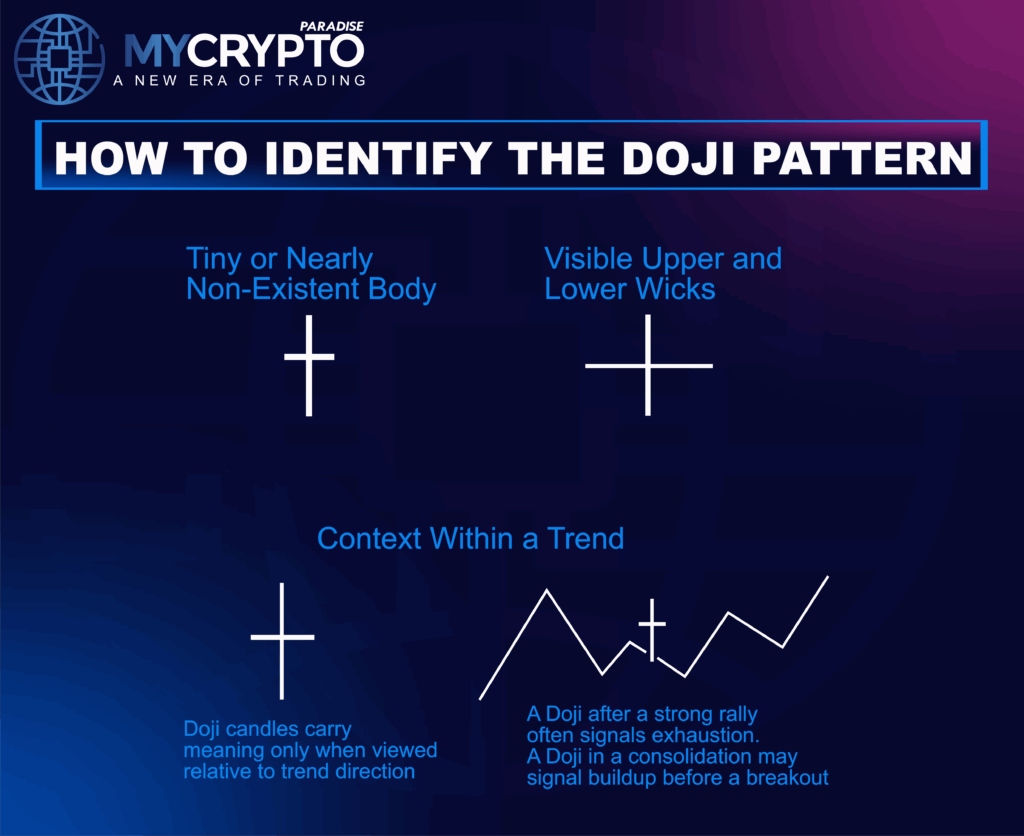
Spotting a Doji early can provide traders with significant strategic advantages. Recognizing this candlestick pattern allows traders to detect market hesitation, anticipate potential breakouts, or prepare for trend reversals. A valid Doji forms when several key conditions are met:
1. Tiny or Nearly Non-Existent Body
The open and close prices must be extremely close together, forming a tiny or almost invisible body. This minimal body is the defining feature of a Doji and represents a balance between buying and selling pressure, highlighting market indecision.
2. Visible Upper and Lower Wicks
The shadows or wicks show the extremes of price movement within the session. Their length provides insights into whether the indecision reflects market volatility, price rejection, or a lack of conviction among traders.
3. Context Within a Trend
The significance of a Doji is best understood in relation to the surrounding trend. A Doji appearing after a strong uptrend often signals buying exhaustion. A Doji during a downtrend may indicate selling exhaustion. In periods of consolidation, a Doji can mark a potential buildup before a breakout
4. Volume Behavior
Trading volume often contracts during the formation of a Doji, reflecting a slowdown in momentum. This pause in activity frequently precedes a significant move, as crypto traders hesitate and wait for clearer market direction.
5. Confirmation Candle
A Doji is validated only when the following candle confirms the intended direction. For a bullish signal, the next candle should close strongly above the Doji’s high. For a bearish signal, it should close decisively below the Doji’s low. Without confirmation, the Doji alone provides limited actionable insight.
Is the Doji Pattern Bullish or Bearish?
The Doji Pattern is neutral by definition, but its interpretation depends entirely on where it appears within the market cycle.
What Does a Green Doji Indicate?
A Green Doji forms when the closing price ends slightly above the opening price, but the difference between the two is extremely small. This creates a very thin green real body, showing that buyers held a slight advantage yet failed to gain meaningful control.
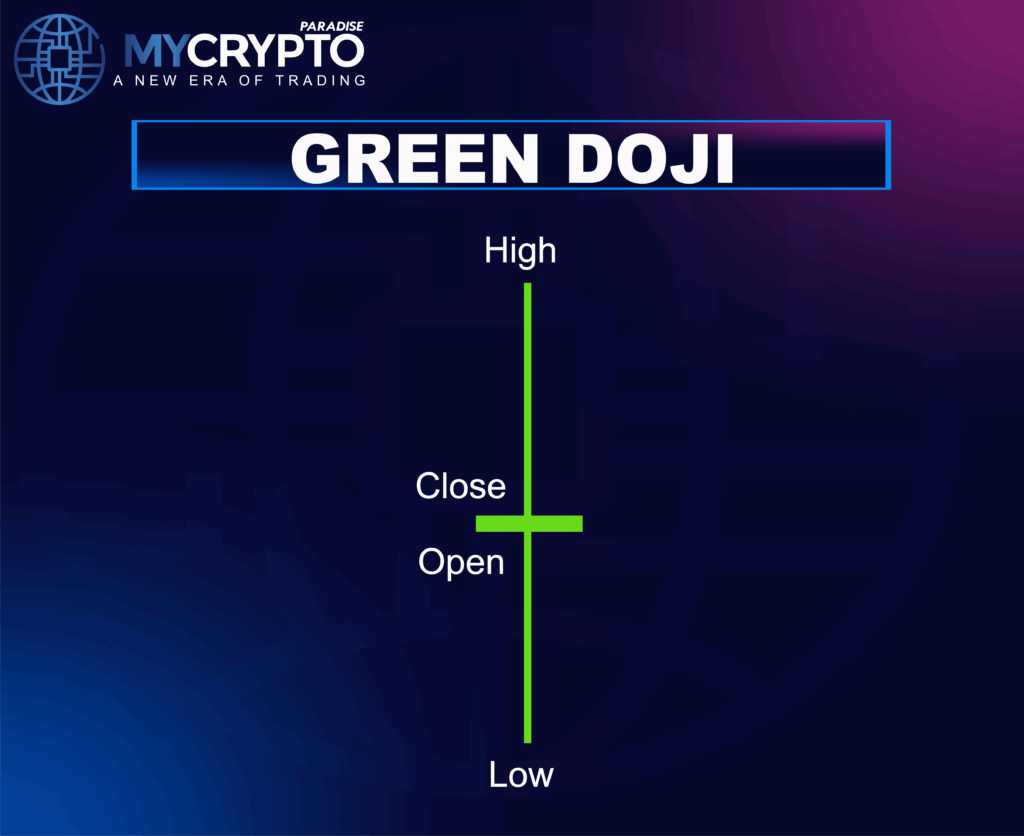
The narrow body reflects minimal upward movement, reinforcing the core message of a Doji: market indecision, hesitation, and a lack of strong conviction from either side, despite a marginal bullish close.
What Does a Red Doji Indicate?
A Red Doji forms when the closing price ends slightly below the opening price, but the difference is minimal, resulting in a very narrow red real body. This structure signals that sellers had a mild advantage, yet neither side gained meaningful control of the market.
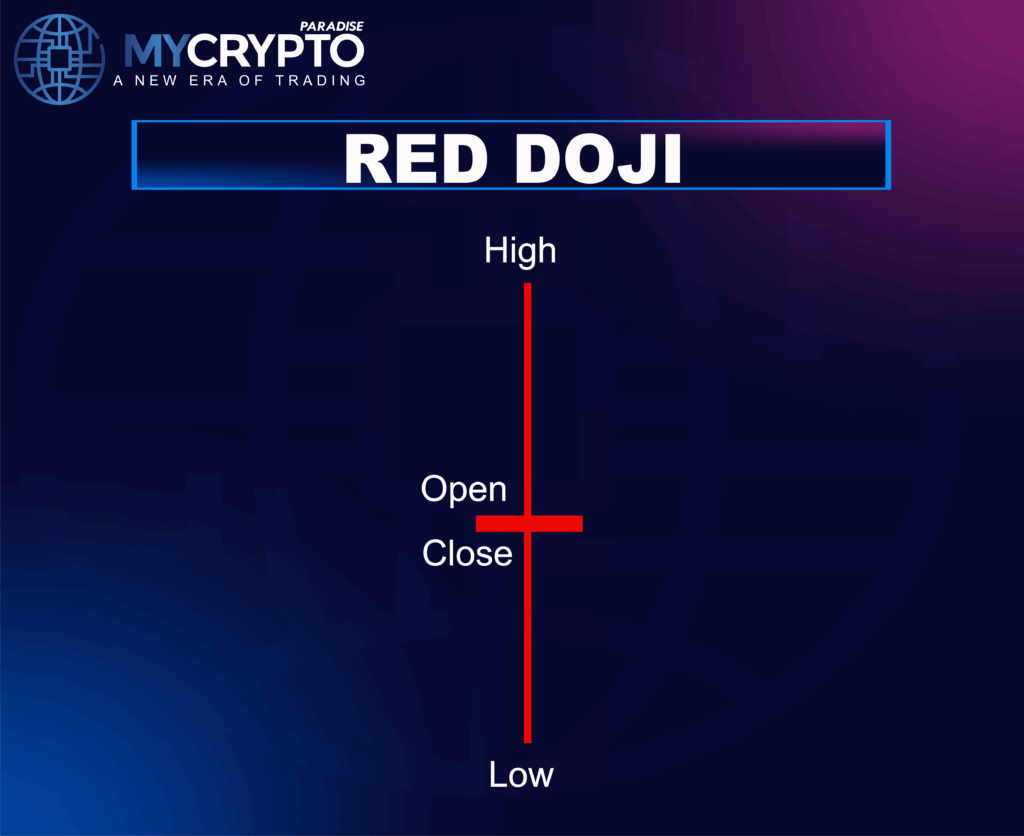
Even with the slight bearish close, the open and close remain extremely close to each other, preserving the classic Doji shape. The red color simply reflects a marginal downside finish, while the tiny body highlights one key message: market indecision and hesitation, with no strong directional conviction from either buyers or sellers.
Does It Matter if a Doji Is Red or Green?
No, the color of a Doji does not meaningfully change its interpretation. The difference between the opening and closing prices is extremely small. Both red and green Dojis form an exceptionally thin real body. This tiny variation is not strong enough to shift the pattern’s meaning. Whether red or green, a Doji ultimately signals indecision, hesitation, and a temporary balance between buyers and sellers
How Reliable Is the Doji Pattern?
As a standalone signal, the Doji Pattern is a caution flag, but when paired with context and confirmation, it becomes a powerful tool.
Statistical Performance
Back-testing shows Doji reversals succeed 50–60% of the time when confirmed by a strong follow-through candle. When the Doji appears at major levels with volume alignment, reliability improves significantly.
Key Conditions That Boost Reliability
- Doji forms at a clear support or resistance zone, increasing contextual strength.
- Wick length reflects a decisive rejection from one side, tightening the signal.
- Volume compresses during the Doji and expands strongly during the confirmation candle.
- Trend indicators (RSI, MACD) begin flattening or diverging, signaling weakening momentum.
- Multi-timeframe alignment shows hesitation across several chart intervals.
When these conditions align, the Doji evolves from a simple hesitation candle into a high-probability directional signal. However, extreme volatility, oversized wicks, or unclear structure can weaken its reliability, making confirmation essential.
How to Trade the Doji Pattern?
Effectively trading the Doji candlestick requires a combination of precision, patience, and careful confirmation. Below is a structured approach that professional crypto traders typically follow to maximize success:
Entry Strategy
Breakout Entry:
Enter once the price closes above the Doji high (bullish) or below the Doji low (bearish). This confirms that the market has selected a direction after indecision.
Pullback Entry:
Conservative crypto traders wait for a retest of the confirmation candle’s breakout zone. This improves the risk-to-reward profile and filters out false breakouts.
Stop-Loss Placement
- Bullish Trades: Place the stop-loss just below the Doji’s low or beneath the nearest support level.
- Bearish Trades: Place the stop-loss just above the Doji’s high or above the nearest resistance level.
Proper stop-loss placement protects your position in case the anticipated momentum fails, and the market returns to indecision, helping manage risk effectively.
Take-Profit Targets
- Use structural targets such as previous highs/lows, major supply/demand zones, or Fibonacci extensions to secure profits.
- Traders may also measure the volatility shown in the wick structure to anticipate reasonable follow-through.
By combining confirmation entries, disciplined stops, and structured targets, traders elevate the Doji from a simple candle to a strategic tool for trend-based decision making
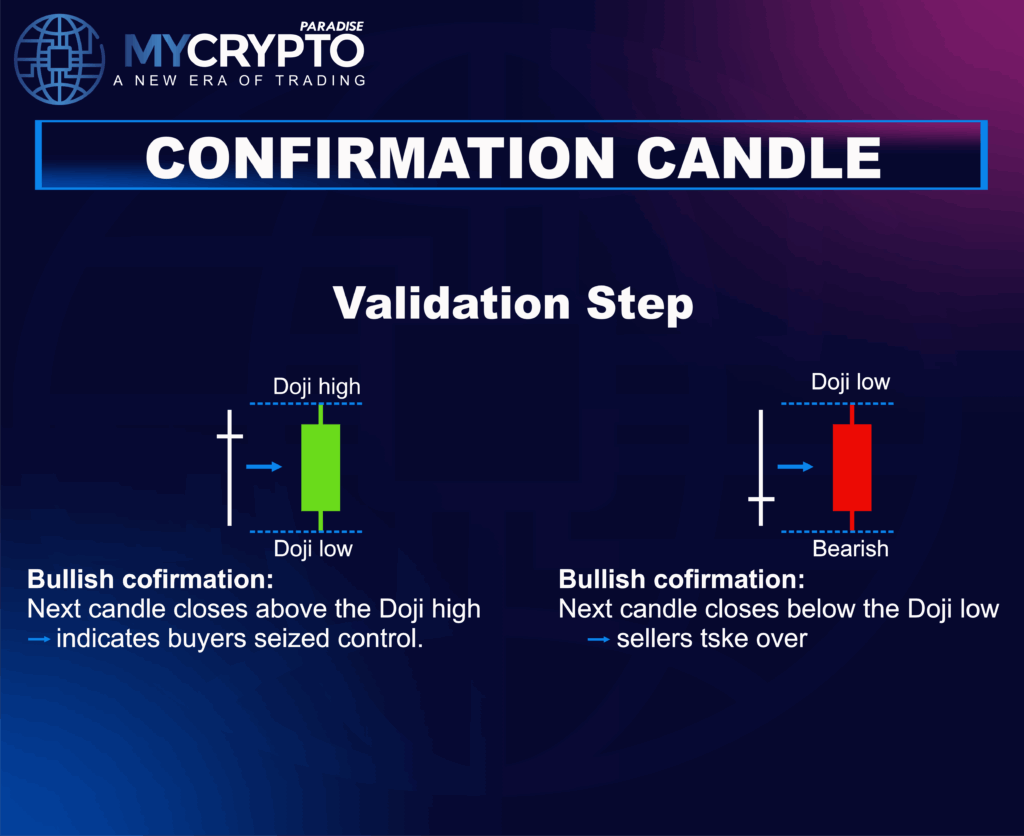
Confirmation Candle: The Validation Step
A Doji represents indecision in the market; neither buyers nor sellers have clear control. To determine the true direction, traders wait for the confirmation candle.The next candle will validate whether the market is about to reverse or continue its trend.
Bullish Confirmation
A bullish confirmation occurs when the candle following a Doji closes above its high. This indicates that buyers have entered the market decisively, taking control from the previous indecision.
- Price closes above the Doji’s high → Signals strong buyer momentum
- Implication → Potential upward continuation or trend reversal
Bearish Confirmation
A bearish confirmation occurs when the next candle closes below the Doji’s low. This shows that sellers have taken control, confirming downward pressure.
- Price closes below the Doji’s low → Indicates seller dominance
- Implication → Likely downward continuation or trend reversal
Doji Pattern With Volume
A Doji Pattern becomes far more meaningful when analyzed alongside volume behavior. Declining volume during the Doji shows reduced conviction from both buyers and sellers. This contraction reflects hesitation. It signals that prior momentum is weakening, allowing the market to stabilize before choosing direction.
Low but steady volume also indicates that crypto traders are waiting for confirmation. This pause creates an essential buildup for the next move. When uncertainty resolves, a surge in volume confirms the winning side.
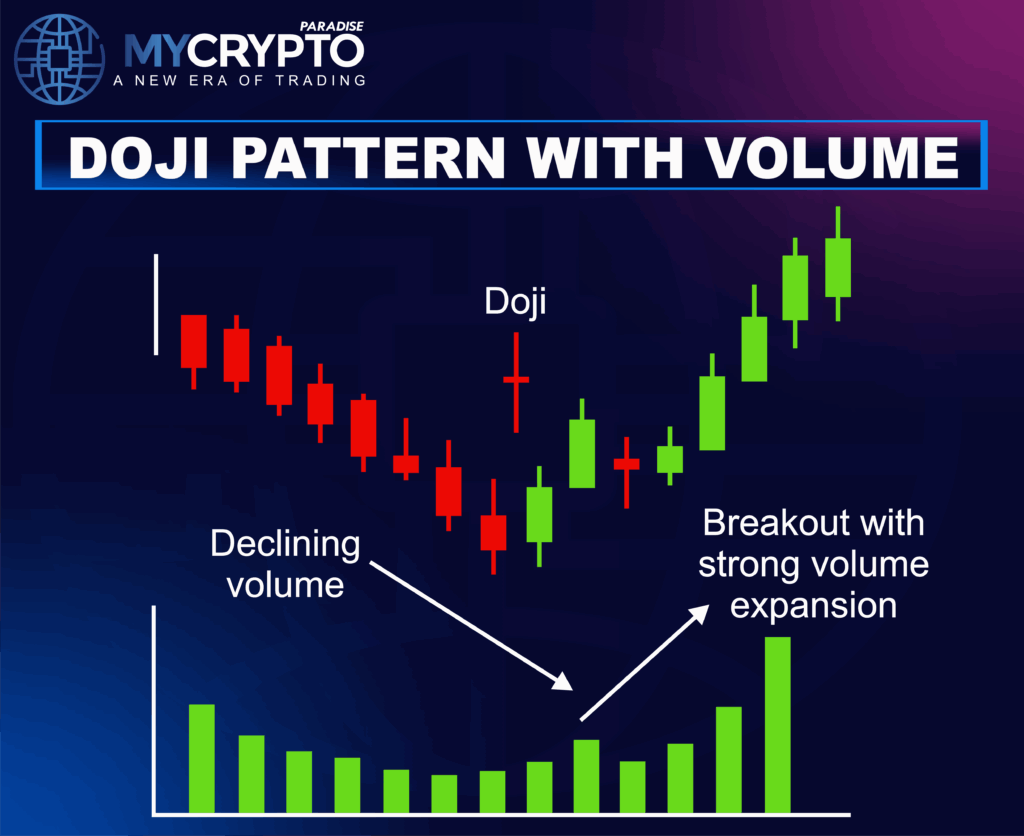
If the breakout occurs with strong volume expansion, it validates the Doji reversal or continuation signal, strengthening confidence in directional trades and increasing follow-through probability.
Important Types of Doji Patterns
While the classic Doji represents pure indecision, several variations exist depending on wick length and market psychology. Each version offers different insights into trend strength, momentum, and potential reversal points. Understanding these types helps crypto traders interpret sentiment with greater precision and execute trades with clearer confirmation.
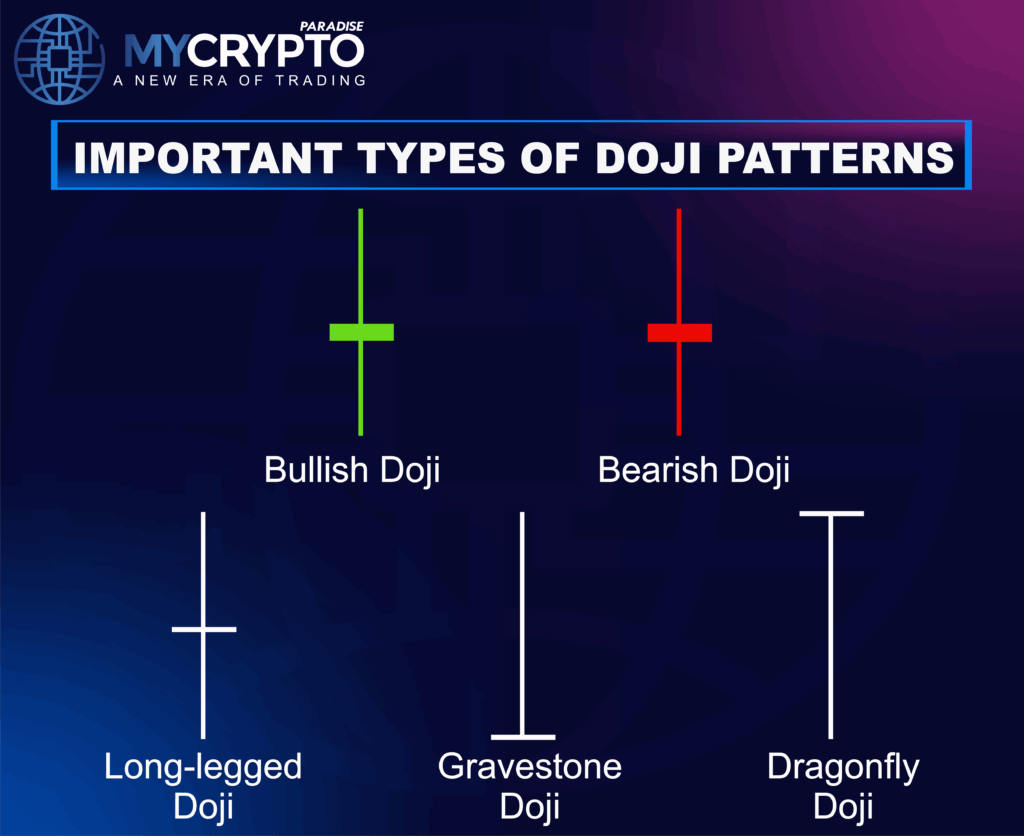
Long-Legged Doji
The Long-Legged Doji features long upper and lower shadows, with the open and close prices very close together. It reflects market indecision as buyers and sellers battle without gaining control. The extended wicks mark the session’s high and low. The tiny real body shows the market closed near its opening price, highlighting uncertainty about the next move.
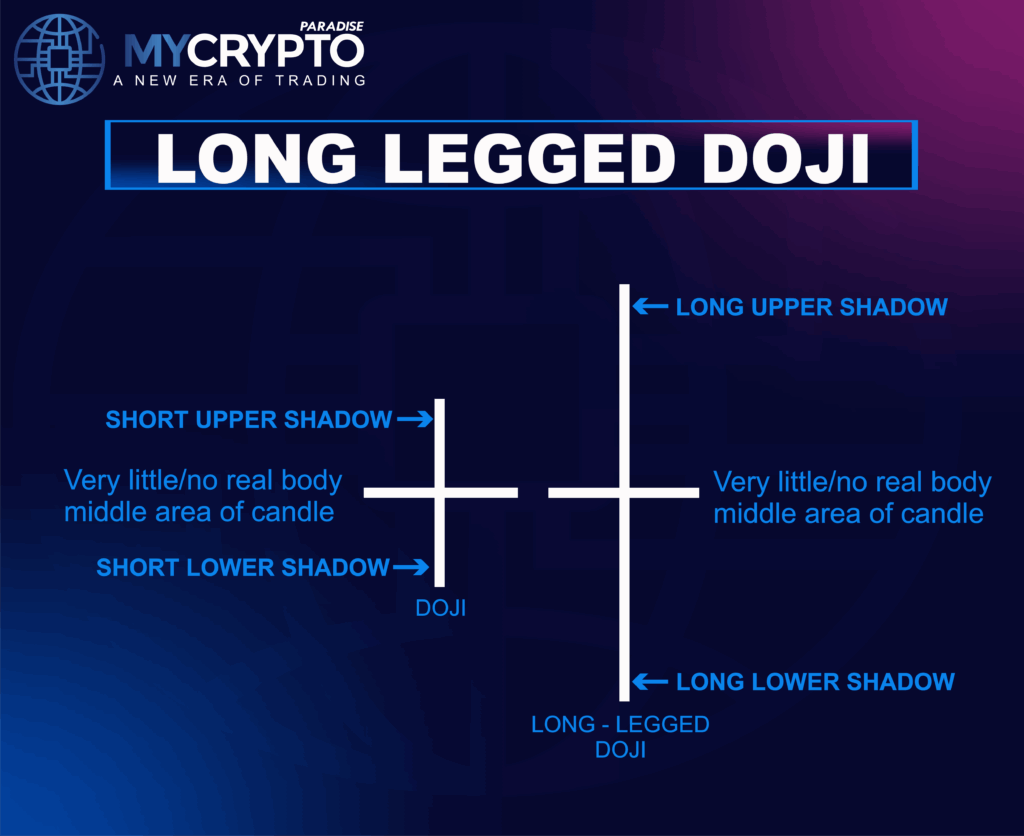
Appearing near trend exhaustion, it can signal fading momentum and a potential reversal. It may also indicate a consolidation phase before the next major move. The pattern serves as a valuable tool for traders anticipating trend shifts.
Dragonfly Doji
The Dragonfly Doji is a candlestick pattern where the open, high, and close prices are nearly equal, with the low extending far below, forming a long lower shadow. This reflects strong buying pressure and rejection of lower prices, signaling potential bullish dominance.
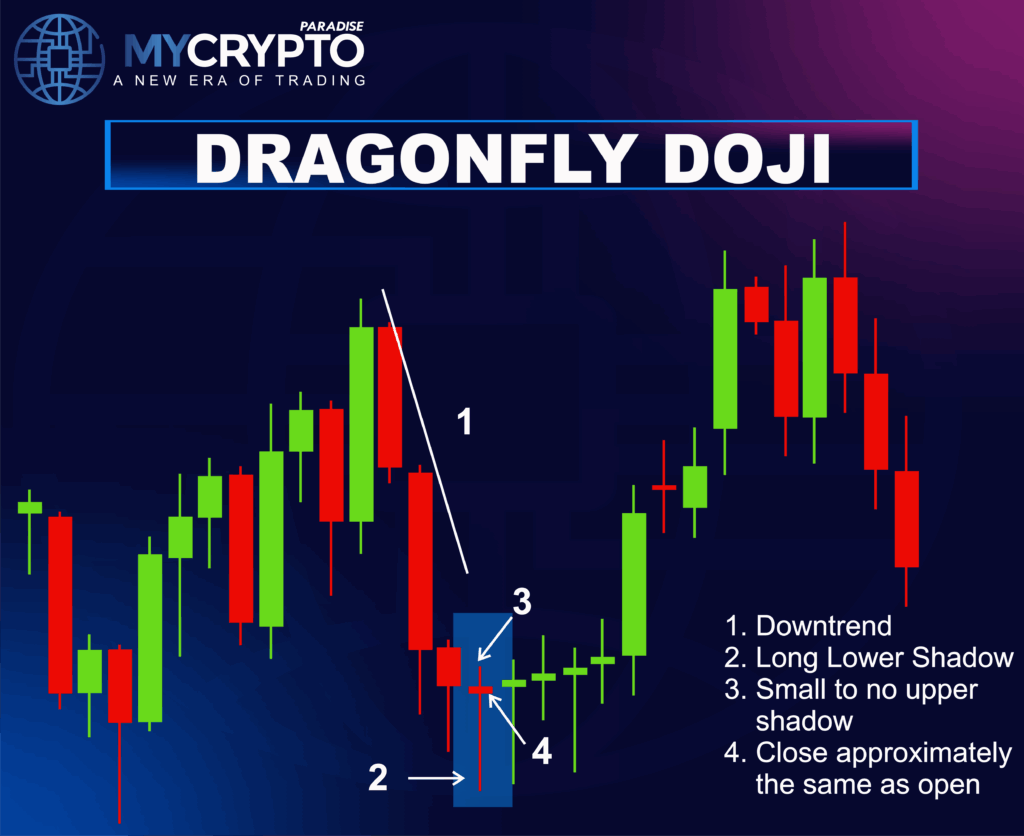
Its real body sits at the top with an almost absent upper shadow, showing sellers failed to push prices lower while buyers regained control. Appearing at the end of a downtrend, especially when followed by a confirmation candle, it signals a potential bullish reversal and the start of upward momentum.
Gravestone Doji
The Gravestone Doji forms when the open, low, and close prices coincide, with the high extending far above to create a long upper shadow. It signals rejection of higher prices and rising selling pressure, indicating bearish dominance.
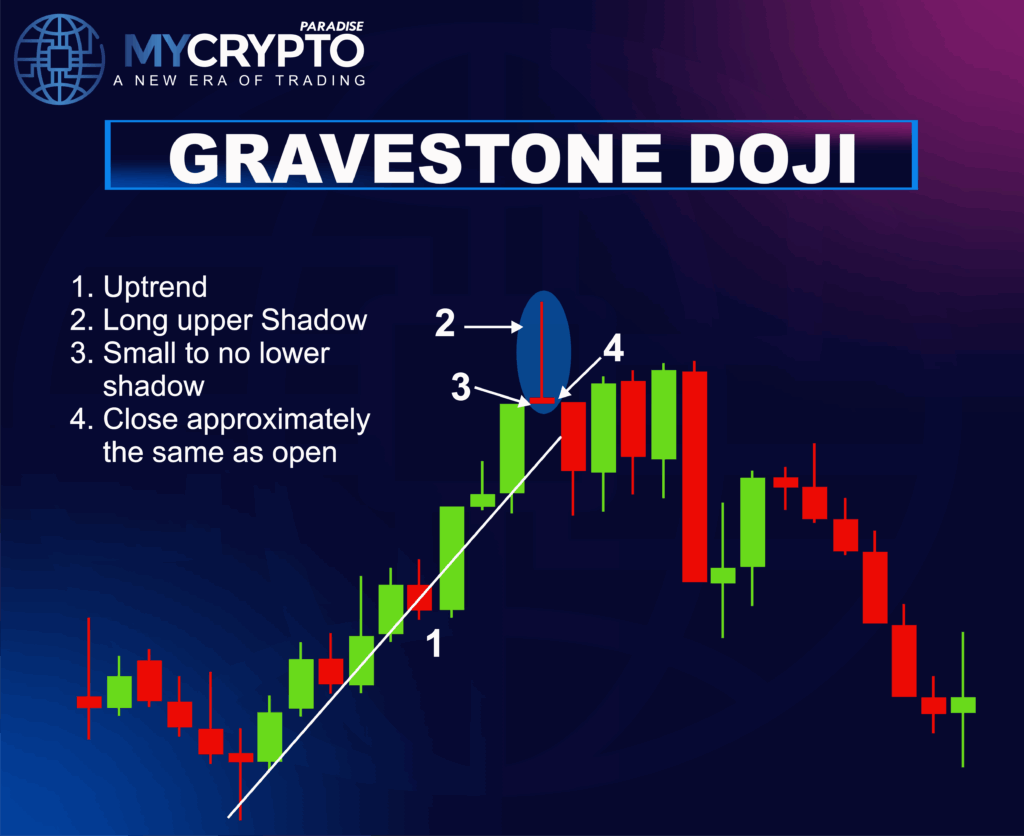
Its real body sits at the bottom with a minimal lower shadow, reflecting buyers’ failed attempts and sellers taking control. Appearing near the top of an uptrend, especially when followed by confirmation, it signals a potential bearish reversal.
Doji Star
The Doji Star forms after a strong directional candle and represents a sudden slowdown in momentum. This version appears commonly in reversal structures such as Morning Star or Evening Star patterns. It highlights hesitation before a potential shift in control from bulls to bears or vice versa.
Four-Price Doji
The Four-Price Doji is extremely rare and forms when the open, high, low, and close are all the same. It signals an exceptionally quiet market session with no volatility. Although uncommon in crypto markets, when spotted, it highlights extreme indecision and a lack of trading interest.
Doji at Support: Bullish Reversal Setup
A Doji Star forming at the bottom of a downtrend signals a potential bullish reversal. After a string of red candles, the market prints a Doji, reflecting seller exhaustion and market indecision. Price often reverses immediately afterward, leading into a strong bullish move confirmed by consecutive green candles.
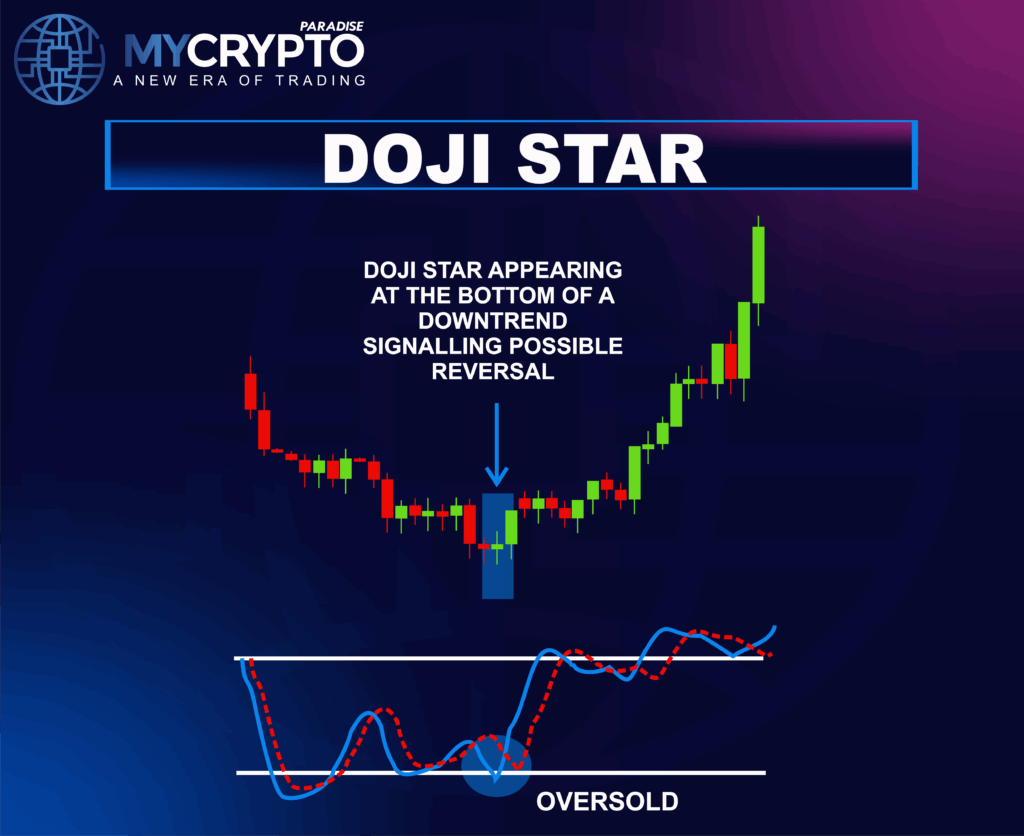
At the same time, Stochastic shows the market in an oversold zone as the Doji forms. This alignment of oversold momentum and a reversal candlestick sharply increases the probability of a trend shift.
Together, the Doji at support and the oversold reading exemplify candlestick confirmation + momentum exhaustion, a classic strategy professional traders use to anticipate high-probability bullish reversals.
Doji vs Similar Patterns
Crypto traders often confuse the Doji with other candlestick structures that appear visually similar but communicate very different market messages. While these patterns may look alike at first glance, each carries unique information about sentiment, strength, and conviction. Understanding these distinctions helps traders avoid misreads and refine decision-making in fast-moving markets.
Doji vs Spinning Top
A Spinning Top forms with a noticeably larger real body, signaling light dominance from either buyers or sellers. The Doji, however, has an almost nonexistent body, reflecting complete indecision. Where a Spinning Top indicates mild imbalance, a Doji signals near-perfect equilibrium between both sides.
Doji vs Hammer
A Hammer appears at the bottom of a downtrend and represents strong bullish rejection, shown through its long lower wick. The Doji, in contrast, communicates hesitation rather than decisive rejection. The Hammer signals potential reversal strength; the Doji reflects uncertainty without commitment.
Doji vs Shooting Star
A Shooting Star forms near the top of an uptrend with a long upper wick, highlighting powerful seller rejection. A Doji, however, displays more symmetrical wicks and neutral sentiment.
Where the Shooting Star warns of potential topping, the Doji simply marks a moment of indecision.
Doji vs Inside Bar
An Inside Bar signals consolidation within a directional context, often hinting at continuation. The Doji reflects a deeper state of equilibrium where neither buyers nor sellers have clear control. Inside Bars compress movement; Dojis neutralize conviction.
By distinguishing the Doji from Spinning Tops, Hammers, Shooting Stars, and Inside Bars, crypto traders sharpen their pattern recognition, improve timing accuracy, and avoid costly misinterpretations in volatile market conditions.
Common Mistakes to Avoid
Even experienced traders can misread or mistime the Doji Pattern. To trade it effectively, avoid these common mistakes:
- Entering Before Confirmation:
Taking a trade solely based on the appearance of a Doji often results in premature entries. Always wait for a clear confirmation candle, either bullish or bearish, before committing to a direction. - Ignoring Key Support and Resistance Levels:
A Doji carries the strongest meaning when it forms near major levels. Trading a Doji in the middle of a trend or in open space weakens its reliability and increases the chance of false signals. - Misreading Extreme Wicks:
Very long upper or lower wicks can indicate volatility rather than true market equilibrium. Confusing these exaggerated wicks with genuine indecision can distort your bias and lead to poor entries. - Using Dojis in Choppy or Low-Momentum Markets:
Dojis generated in sideways or directionless environments rarely produce meaningful follow-through. The pattern works best in markets showing structure, trend context, or clear inflection points. - Neglecting Risk Management:
Always pair Doji-based trades with proper stop-loss placement. Even well-positioned Dojis with strong confirmation can fail unexpectedly, and poor risk control can turn a small misjudgment into a significant loss.
Conclusion
The Doji Pattern is a key candlestick signal in crypto trading. It shows that market indecision is peaking and a significant move may be forming. When combined with volume, key levels, and strong confirmation, it becomes a high-probability tool for predicting reversals, continuation setups, and momentum shifts with greater accuracy
For professional crypto traders, consistency isn’t just about spotting a Doji. It stems from mastering context, confirmation timing, and disciplined risk management. No pattern guarantees certainty. But with proper structure and precise execution, the Doji can offer a powerful edge in fast-moving, volatile markets.
At ParadiseFamilyVIP🎖️, we help traders build these skills in real time through institutional-grade strategy, psychological clarity, and advanced risk systems designed for long-term success.
👉 Join ParadiseFamilyVIP🎖️ today and start trading like a pro. Membership slots are limited. Secure your spot or join the waiting list to stay ahead of the next major market move.
FAQs
What is a Doji Pattern in crypto trading?
A Doji is a candlestick where the open and close prices are nearly identical, creating a minimal or nonexistent real body. It represents market indecision and can signal a potential reversal or continuation when supported by confirmation and context.
Is the Doji always neutral?
Yes. The Doji itself is inherently neutral, but its interpretation becomes bullish or bearish depending on the prevailing trend and how the confirmation candle behaves afterward.
How can I confirm a Doji?
A Doji is confirmed when the next candle breaks above its high (bullish) or below its low (bearish), ideally accompanied by strong volume. Supporting indicators such as RSI or MACD can add further confidence to the signal.
What’s the best timeframe to trade a Doji?
Dojis can be traded on multiple timeframes, but they are most reliable on the 4H, daily, and weekly charts. Higher timeframes reduce noise and provide clearer, more dependable confirmation signals.
How do I trade a Doji safely?
Wait for the confirmation candle to establish direction before entering. Traders typically place stop-loss orders beyond the Doji wick, while profit targets are aligned with structural levels such as support, resistance, or trend continuation zones.
Are Doji patterns profitable?
Yes. When combined with support and resistance analysis, proper volume interpretation, and disciplined confirmation, Doji patterns can offer high-probability entries across crypto markets.
Can a Doji ever fail?
Absolutely. Like any pattern, Dojis can produce false signals, especially in highly volatile conditions or when crypto traders enter without confirmation. Always wait for a decisive break and maintain strict risk management to avoid unnecessary losses.