- The Pennant Pattern is a continuation formation that signals the market is pausing briefly before resuming its previous trend. The breakout is usually supported by a noticeable increase in trading volume.
- The structure of the Pennant Pattern starts with a sharp price movement, flagpole, followed by a brief consolidation period where price action contracts into a pennant shape.
- The consolidation phase in a Pennant Pattern is short-term compared to many other formations, typically lasting only a few days to a few weeks before price resumes its trend.
Pennant Pattern in the crypto technical analysis space stands out as one of the most reliable continuation patterns. It signals a brief consolidation before the market resumes its main trend after a sharp price movement. It is a powerful tool for crypto traders who value precision, discipline, and consistency.
This guide will walk you through everything you need to know about the pennant pattern in crypto trading. By the end, you’ll understand how to trade pennants in the crypto market like a PRO while strategically managing risk and maximizing profits.
What Is a Pennant Pattern?
A pennant pattern is a short-term continuation formation that signals a temporary pause before the market resumes its prevailing trend (bullish or bearish). It begins with a strong directional move, known as the flagpole, which is followed by a brief consolidation phase where price action contracts within two converging trendlines.
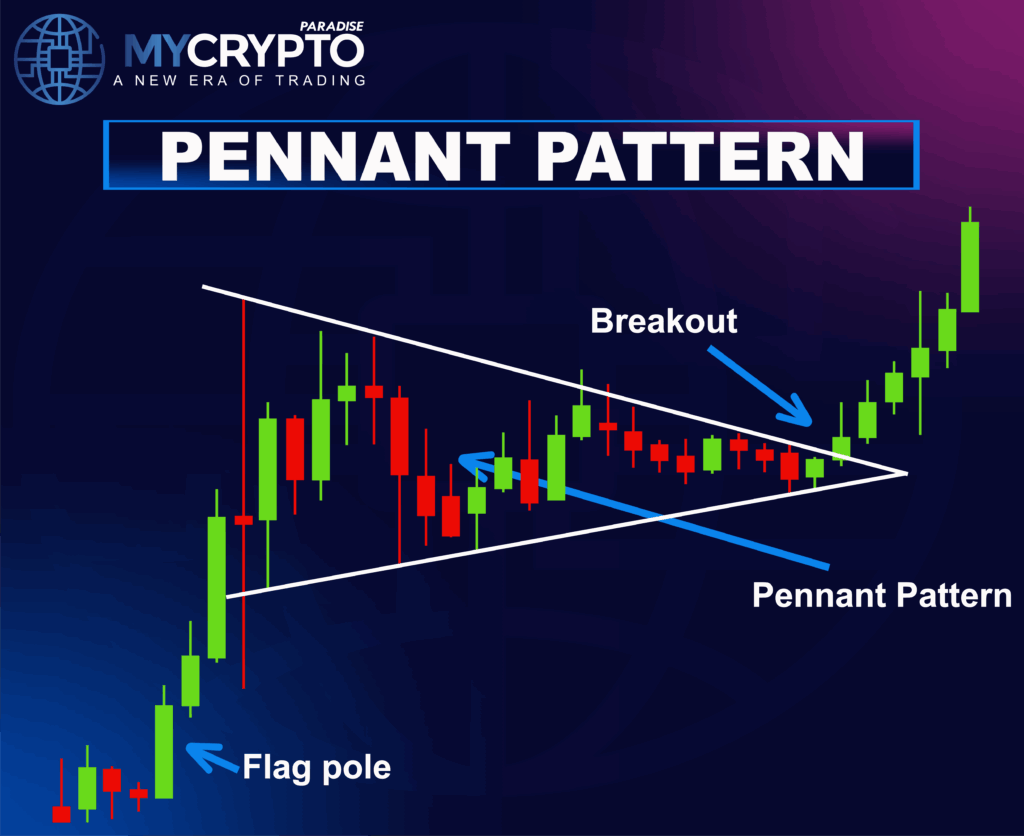
This consolidation forms the pennant shape, resembling a small symmetrical triangle. Unlike long-term formations, pennants are short-lived and typically develop over a few days or weeks. Trading activity usually decreases during the consolidation and then surges again once the price breaks out of the pennant, often in the direction of the original trend.
Due to this structure, the pennant is considered one of the most reliable continuation patterns in crypto trading. It offers crypto traders clear setups to enter with confidence when it is backed by confirmation.
How to Identify Pennant Pattern?
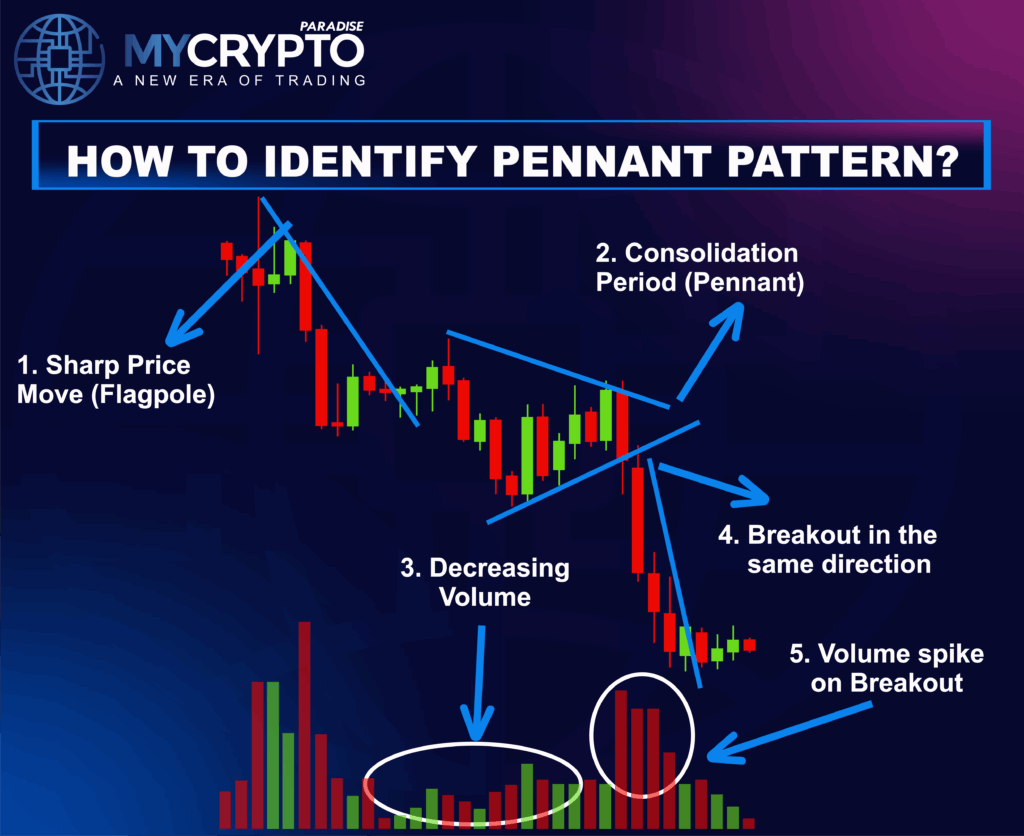
The pennant pattern forms through a distinct sequence that reflects market psychology. Let’s go through this pattern’s formation step by step:
The Flagpole: The Foundation of the Pattern
Every pennant pattern begins with a strong price surge known as the flagpole. This sharp move reflects aggressive buying or selling pressure and sets the direction of the pattern. Without a clear flagpole, the structure cannot be classified as a pennant.
The Consolidation Phase
Following the initial surge, the market enters a pause where price action contracts within two converging trendlines. This creates the pennant shape, resembling a small symmetrical triangle. The consolidation represents traders taking profits while new market participants prepare for the next move.
The Role of Volume
Volume behavior is crucial in confirming the pennant pattern. As the consolidation unfolds, trading activity generally declines, signaling a temporary reduction in participation. A breakout accompanied by a sudden spike in volume confirms the continuation of the original trend.
Timeframe and Validity
Pennant Pattern is a short-term structure, typically forming over a few days or weeks. If consolidation drags on too long, the pattern loses its validity and may transition into a triangle or another formation.
By understanding these elements, crypto traders can identify pennants early and prepare for strategic entries backed by confirmation.
Is Pennant Pattern Bullish or Bearish?
Pennant Pattern can be both bullish or bearish, but itself it is a continuation pattern of the prevailing market trend. Understanding the difference is essential for professional traders who want to trade with precision and avoid misinterpretation.
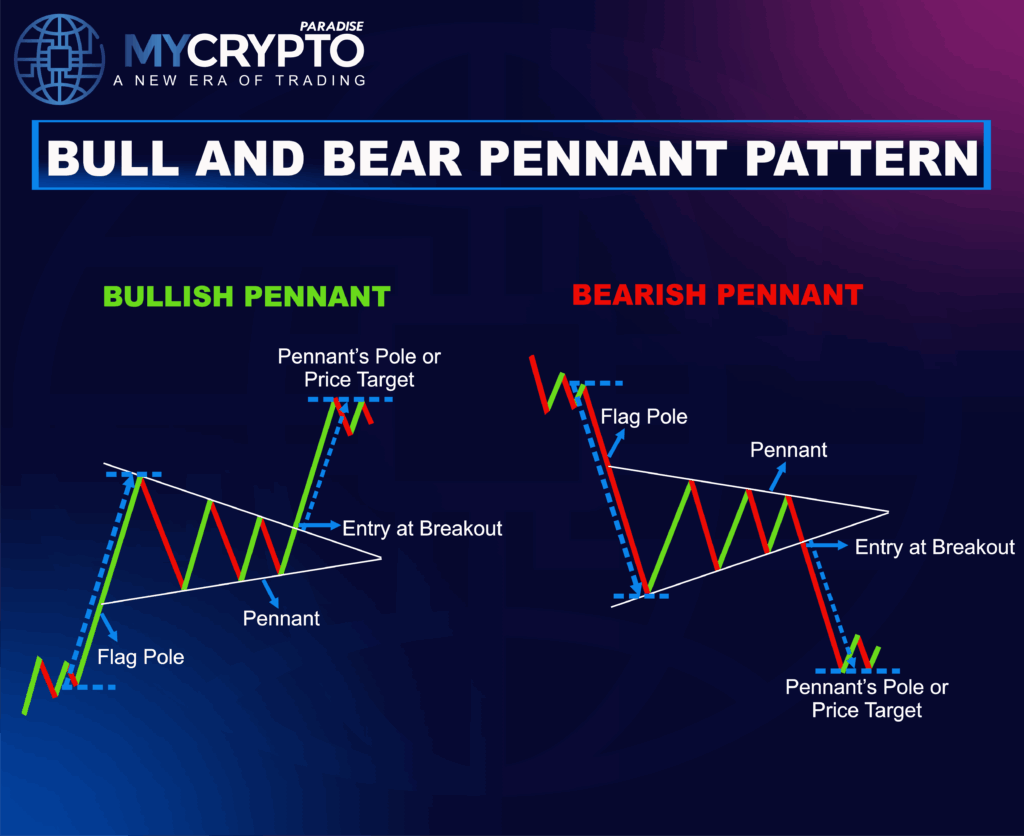
Bullish Pennant
A bullish pennant develops after a strong upward price move. The flagpole forms as buyers drive the market higher with strong momentum. This is followed by a brief consolidation phase where price contracts within converging trendlines.
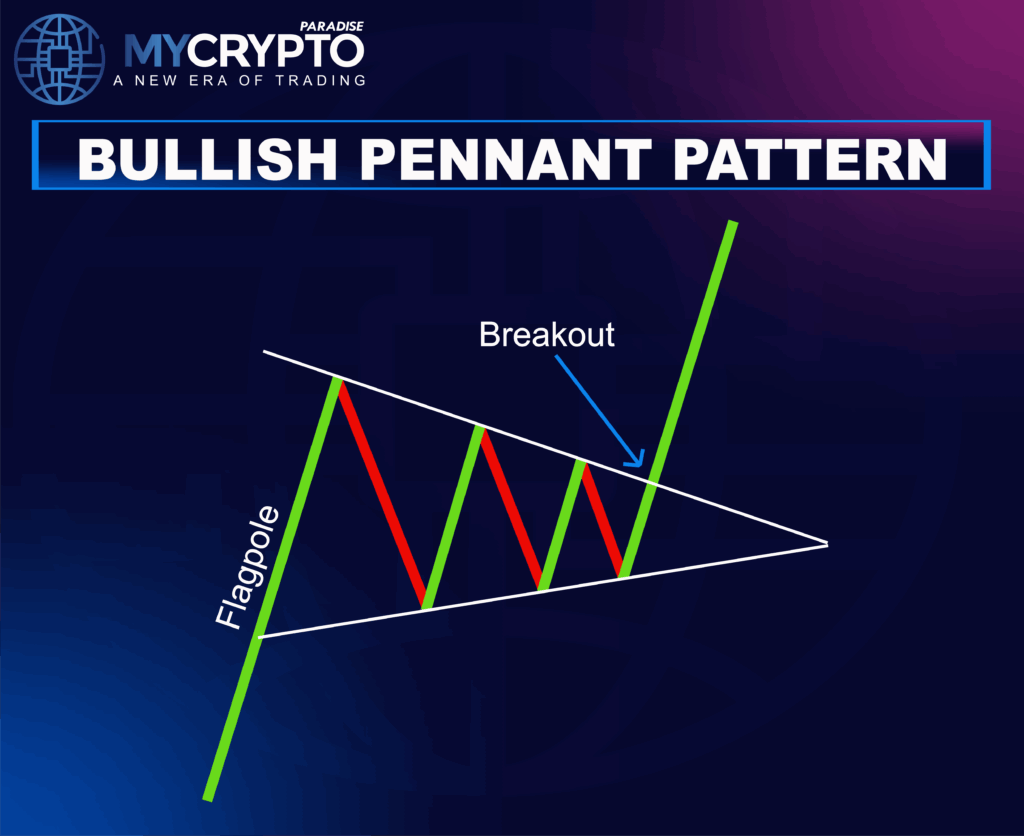
Once the consolidation is complete, a breakout to the upside, usually accompanied by increased volume, confirms the continuation of the bullish trend. In crypto markets, bullish pennants often appear during strong uptrends, especially when demand spikes around major news or adoption events.
Bearish Pennant
A bearish pennant is the mirror image, forming after a steep decline. The flagpole represents heavy selling pressure, and the consolidation reflects a pause where sellers and short-term buyers balance the market temporarily.
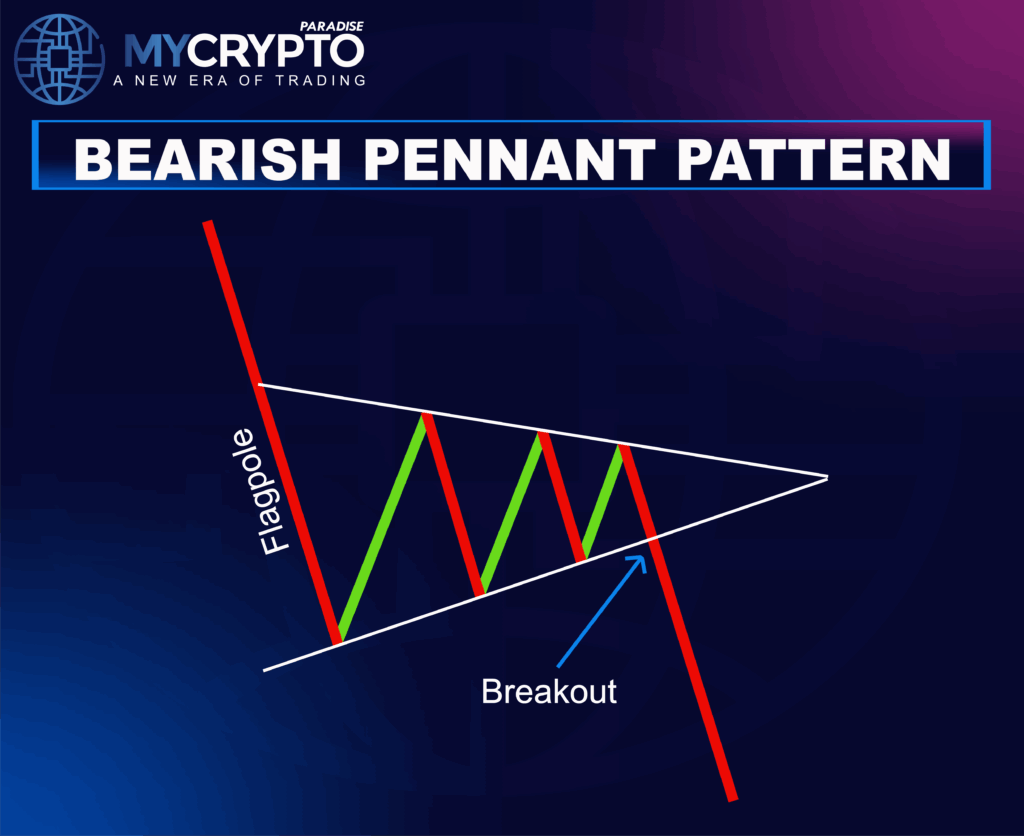
The breakdown occurs when selling pressure resumes, pushing prices lower with renewed momentum and higher volume. Bearish pennants are common in sharp downtrends, often triggered by negative sentiment, regulatory news, or broader market corrections.
Timeframe Considerations
Both bullish and bearish pennants can appear across different timeframes, from intraday charts to weekly setups. However, their reliability improves when spotted within strong trending markets, as consolidation against a weak or sideways backdrop may lead to false signals.
By recognizing whether a pennant is bullish or bearish, traders can align their strategy with the dominant market momentum and position themselves for high-probability setups.
How Reliable Is the Pennant Pattern?
The pennant pattern is widely regarded as one of the most reliable continuation signals in technical analysis. But like all patterns, its effectiveness depends on market context, volume confirmation, and disciplined execution.
Statistical Performance
Studies and backtests suggest that pennants have a relatively high success rate when traded correctly, often delivering follow-through in the direction of the original trend.
In crypto markets, where volatility is greater than in traditional assets, the pennant can generate strong continuation moves. But it also creates more frequent false breakouts if not confirmed by volume and trend strength.
Conditions That Improve Reliability
The pennant pattern is most dependable when it forms after a clear and powerful trend. The shorter the consolidation period, the more likely it is to result in a sharp continuation move.
A strong flagpole, followed by declining volume during consolidation, and then a volume spike on breakout, significantly increases the odds of success.
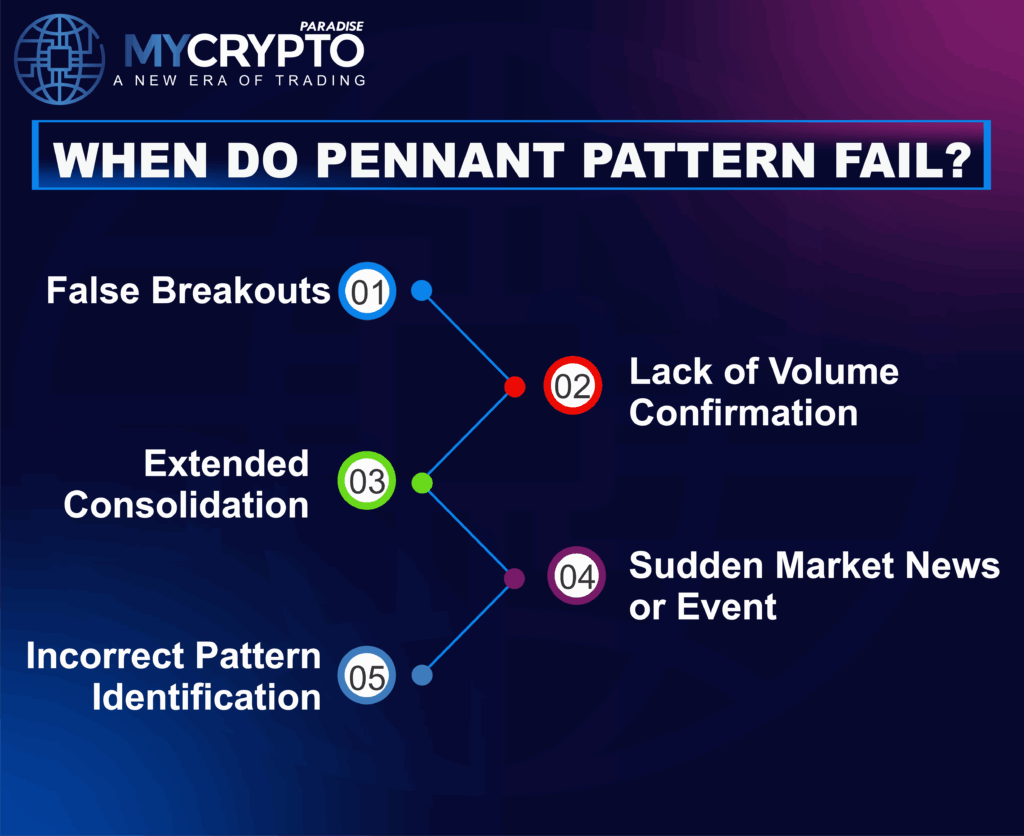
Common Mistakes and False Signals
Despite its strong reputation, the pennant is not foolproof. Traders often misidentify symmetrical triangles or wedges as pennants, leading to poor trade execution.
False breakouts are also common in choppy or low-volume markets, where the price briefly moves beyond the pennant only to reverse sharply. Entering before confirmation or ignoring volume dynamics are the main reasons traders fail with this pattern.
Comparing Reliability With Other Patterns
Compared to similar continuation patterns, such as flags or triangles, pennants tend to be more compact and resolve more quickly. This makes them attractive for active traders seeking short-term setups, though flags, due to their more defined parallel structure, can sometimes offer clearer signals.
Overall, the pennant pattern remains a high-probability tool for professional traders when applied with confirmation and risk management strategically.
How to Trade the Pennant Pattern in Crypto Trading?
Trading the pennant pattern requires discipline, patience, and proper money management. While the setup is relatively straightforward, execution must be precise to avoid false signals and protect capital.
Entry Point:
The following are the entry points for trading pennant:
- Breakout Entry: For a bullish pennant, traders typically enter a long position once the price breaks above the upper trendline (resistance) with strong trading volume. This breakout signals the continuation of the uptrend. Conversely, for a bearish pennant, a short position can be considered when the price breaks below the support line on high volume, confirming the downtrend’s continuation.
- Pullback Entry: Another approach is waiting for a pullback after the breakout. In this case, the price briefly retraces toward the broken support or resistance before resuming in the direction of the trend. This offers a safer entry with a clearer risk-to-reward setup, though it requires patience and discipline.
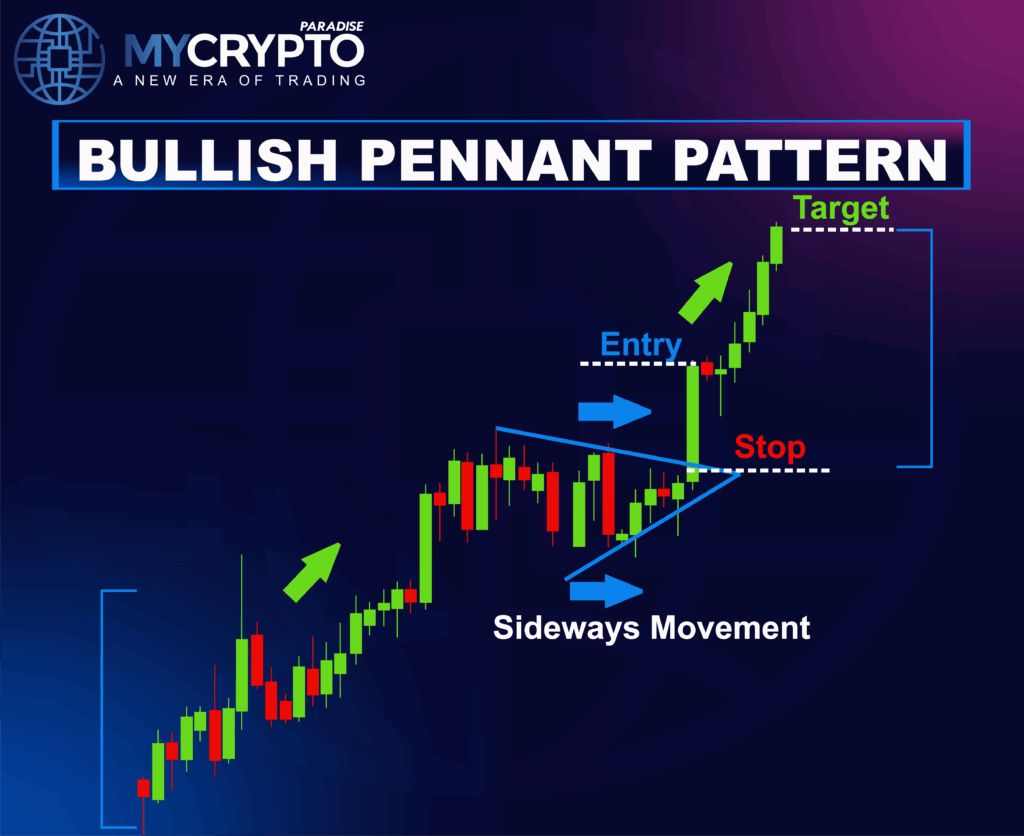
Stop-Loss Levels
Let’s view where you can place your stop loss for the long and short trading positions.
- Long Position: You can place a stop-loss just below the lower trendline of the pennant to guard against failed breakouts and sudden trend reversals.
- Short Position: In a bearish pennant trade, set the stop-loss just above the upper trendline to protect capital if the breakout fails.
Take-Profit Levels
You can set your profit taking levels using the following methods:
- Measuring the Flagpole: The most common method is to measure the length of the flagpole (the sharp price move before the pennant formed) and project it from the breakout point. This gives a realistic profit target aligned with the expected continuation.
- Previous Swing Highs or Lows: Another option is to set take-profit levels near prior swing highs (for bullish pennants) or swing lows (for bearish pennants). These levels often act as natural resistance or support, where price may stall or reverse.
By combining these strategies, professional crypto traders can trade pennant patterns with greater confidence, consistency, and safety. If you’re someone looking for a professional trading community, join us at ParadiseFamilyVIP🎖️.
Pennant Pattern vs Similar Patterns
Crypto traders often confuse the Pennant pattern with other continuation formations. While they share visual similarities, each pattern has distinct characteristics that traders must understand to avoid misidentification and costly mistakes.
Pennant vs Symmetrical Triangle
A pennant looks similar to a small symmetrical triangle, but the key difference lies in context. A pennant always follows a strong, sharp move (the flagpole), signaling continuation of that trend. A symmetrical triangle, on the other hand, usually forms without a preceding flagpole and can act as either a continuation or reversal pattern.
Pennant vs Flag Pattern
Flags and pennants are both continuation patterns, but they differ in shape. A flag forms as a rectangular channel that slopes slightly against the prevailing trend, while a pennant is a small, converging triangle. Both rely on a strong flagpole and breakout confirmation, but the pennant is more compact and tends to resolve faster.
Pennant vs Wedge
A wedge pattern also shows converging trendlines, but its slope is what sets it apart. Rising and falling wedges often tilt against the main trend and are typically reversal signals rather than continuation setups. Pennants, by contrast, are neutral in slope and almost always point to the continuation of the original move.
Pennant vs Channel
Channels display price movement between two parallel trendlines and are generally longer-term patterns. Unlike pennants, channels do not form after a flagpole surge and don’t signal immediate continuation. They are more useful for range trading strategies than for breakout trades.
By distinguishing pennants from triangles, flags, wedges, and channels, crypto traders can sharpen their pattern recognition skills and trade with greater accuracy and confidence.
Common Mistakes to Avoid
Even though the pennant pattern is one of the most reliable continuation setups, many crypto traders make avoidable mistakes that reduce its effectiveness. The following are some of the mistakes essential for safe and consistent trading.
Entering Too Early
One of the most common errors is jumping into a trade before the breakout is confirmed. Entering while the price is still consolidating inside the pennant often results in whipsaws or false signals. Waiting for a clear breakout with volume confirmation is critical.
Ignoring Volume Dynamics
Volume is a vital component of the pennant pattern. A valid breakout should occur with strong volume expansion. Crypto traders who neglect this factor risk trading weak signals that are more likely to fail.
Confusing Pennants With Other Patterns
Because pennants look similar to triangles, flags, and wedges, misidentification is a frequent mistake. Entering trades on incorrectly labeled patterns can lead to poor outcomes.
Trading in Sideways or Weak Markets
Pennants are continuation patterns and work best in strong trending environments. Applying them in flat, low-momentum markets increases the chance of false breakouts and choppy results.
Poor Risk Management
Relying solely on the pattern without proper stop-loss placement and position sizing exposes crypto traders to unnecessary risk. Overleveraging, or placing stops too close to the trendlines, can quickly lead to losses even when the pattern is valid.
Conclusion
The Pennant Pattern is a compact yet powerful continuation signal in crypto trading. By learning to identify the flagpole, consolidation within converging trendlines, and breakouts with volume, crypto traders can use it to capitalize on strong momentum moves and manage entries with precision.
Still, no single chart pattern guarantees success. Professional trading requires discipline, protective risk management, and a systematic strategy that blends technical setups with broader market context. At ParadiseFamilyVIP🎖️, we go beyond chart formations by combining technical analysis, on-chain insights, sentiment tracking, and whale monitoring. We deliver professional crypto signals and portfolio management designed for consistent long-term growth.
👉 Check membership availability for ParadiseFamilyVIP🎖️ (Click it)
If you’re serious about trading like a PRO, joining our inner circle is the next step. Seats are limited, so secure your membership or join the waiting list today.
FAQs
What is a pennant pattern in crypto trading?
A pennant pattern is a continuation chart formation that appears after a strong price move. The strong trend can be either bullish or bearish. It consists of a brief consolidation with converging trendlines, followed by a breakout in the same direction as the prior trend.
How do you identify a bullish pennant?
A bullish pennant forms after a sharp upward move, followed by a small triangular consolidation. The breakout typically occurs to the upside with increased volume, signaling a continuation of the uptrend.
What is the difference between a pennant and a flag pattern?
Both are continuation patterns, but a flag forms as a rectangular channel that slopes against the trend, while a pennant forms as a small symmetrical triangle. Pennants are usually shorter in duration and resolve faster than flags.
How reliable is the pennant pattern?
The pennant pattern is considered one of the more reliable continuation signals, especially when confirmed by strong volume during the breakout. However, false breakouts can occur in low-volume or sideways markets, so risk management is essential.
Can a pennant pattern be bearish?
Yes. A bearish pennant forms after a sharp downward move, with price consolidating into a small triangle before breaking lower. It signals continuation of the downtrend and is common during strong bearish markets.
On what timeframes does the pennant pattern work best?
Pennants can appear on any timeframe, but they are most effective on higher timeframes such as 4-hour, daily, or weekly charts, where price movements are more reliable and less prone to noise.