MCP Insights
 PRO Paradiser
 MCP MasterClass
  ParadiseFamilyVIP Crypto Signals💰
- The Double Bottom pattern helps spot early signs of a bullish reversal, with two near-equal lows showing strong support and weakening seller momentum.
- A confirmed breakout above the neckline is the trigger, not the second bottom. Volume and structure must align before entering the trade.
- Discipline is what makes this pattern effective, not spotting it, but executing it with structure, patience, and proper risk management.
Wondering if the market’s finally turning around? The double bottom pattern is one of the most recognized signals that a downtrend may be nearing an end, and a bullish reversal could be on the horizon. Used widely in technical analysis, this chart pattern helps crypto traders identify when prices have likely reached their lowest point and are ready to reverse.
In this beginner-friendly guide, you’ll learn what the double bottom pattern looks like, how to spot it early, and how to use it to improve your crypto entries and exits, even if you’re just getting started.
What Is a Double Bottom Pattern?
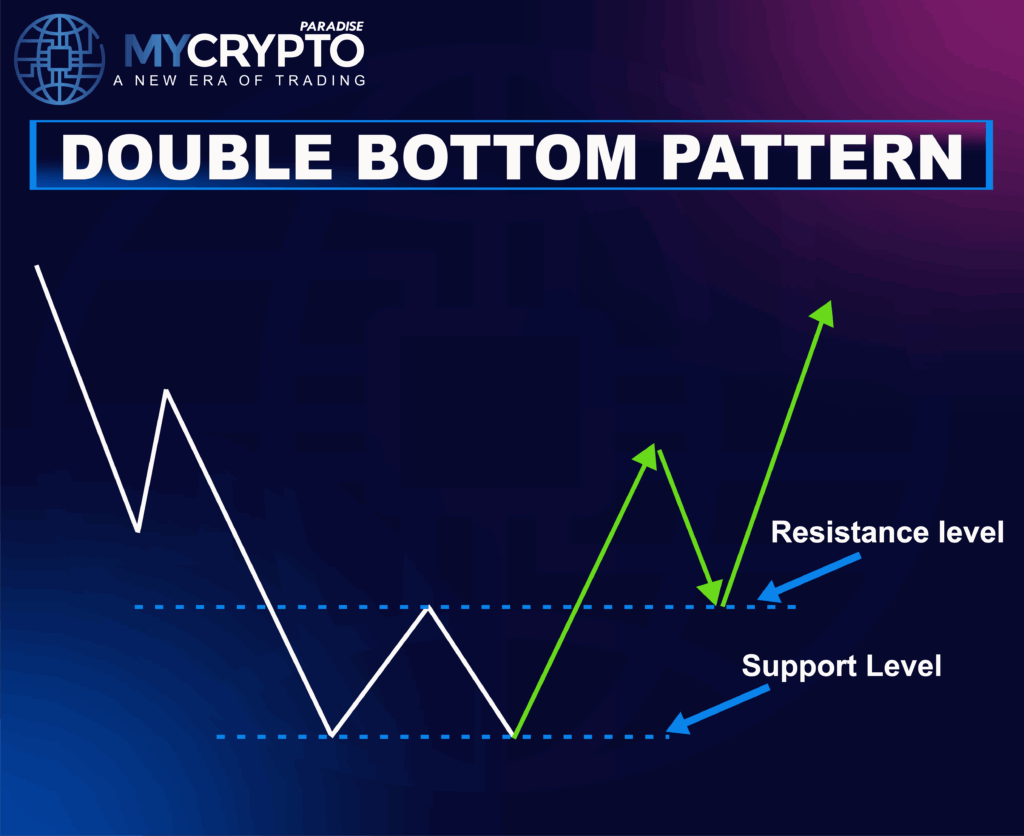
A double bottom pattern is a bullish reversal chart pattern that forms after a downtrend, indicating a potential shift toward upward price action. It’s a key pattern used by crypto traders to spot when the market may be ready to bounce.
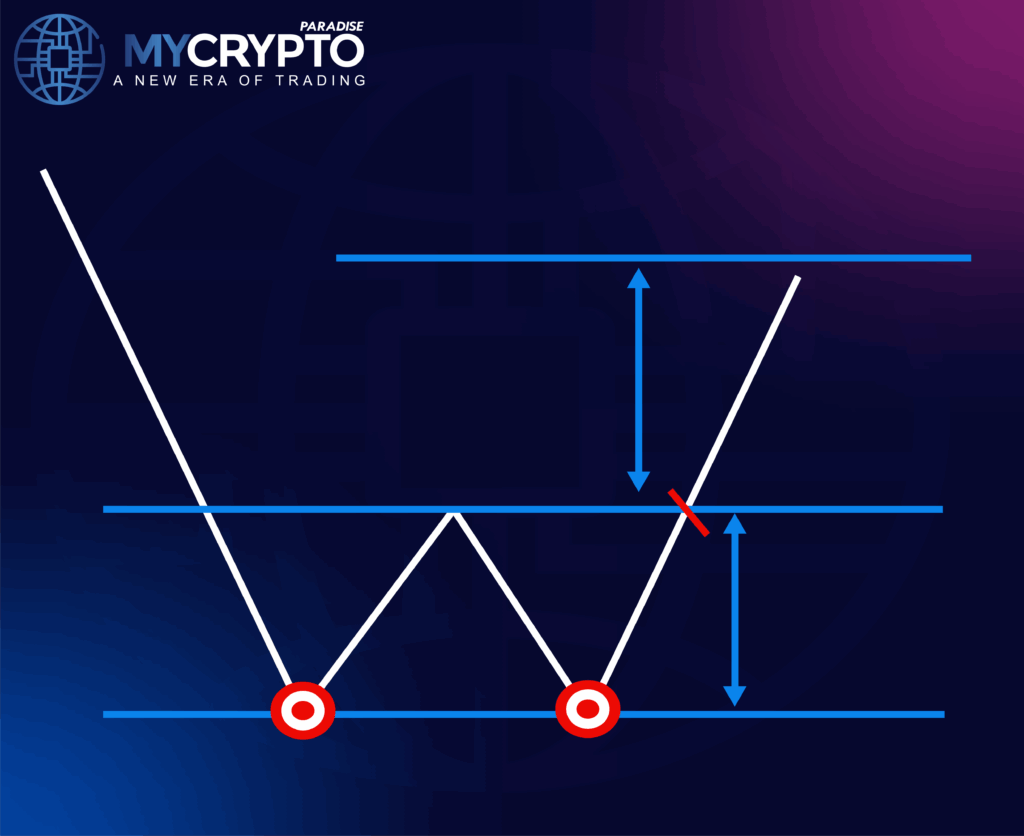
This setup resembles the letter “W” on a chart. The price drops to a low, finds support, and bounces slightly. It then falls again to a similar level, testing that support a second time. If the price holds and breaks above the resistance between the two lows (the neckline), the pattern is confirmed and often signals a bullish reversal.
What Does the Double Bottom Pattern Tell Crypto Traders?
The double bottom pattern is more than just a visual cue; it’s a strong signal that market sentiment is shifting from bearish to bullish. It forms when sellers try twice to push prices lower but fail, showing that support is holding and selling pressure is weakening.
Once the price breaks above the neckline, the resistance between the two lows, it confirms a bullish reversal, suggesting that buyers are regaining control and a potential uptrend may be starting.
For crypto traders, this isn’t just technical theory. It’s often the first clear sign that a downtrend is ending. Spotting this pattern early can help you enter trades before the breakout gains momentum, giving you a strategic edge in catching trend reversals before the crowd.
How the Double Bottom Pattern Is Structured
Understanding the structure of the double bottom pattern is key to spotting it early and trading it with confidence. Here’s how it forms, step by step:
First Bottom
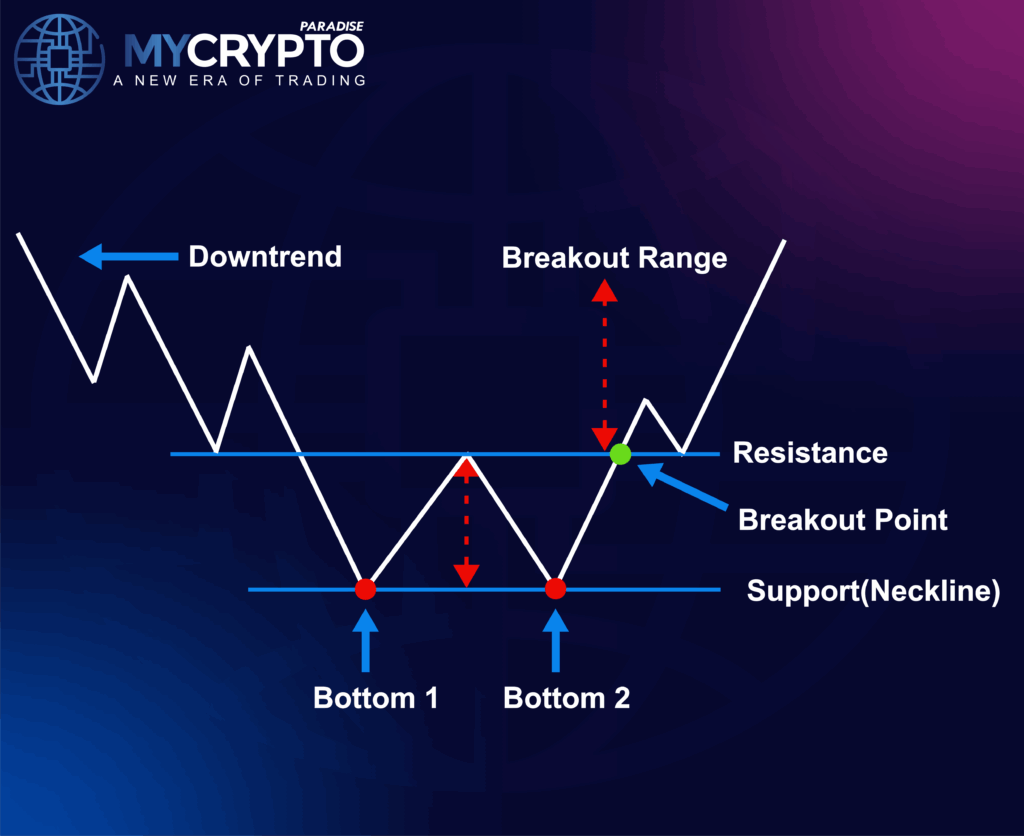
The pattern starts with a clear downtrend, often marked by aggressive selling and expanding bearish candles. Eventually, the price reaches a significant low, forming the first bottom, a key support level.
This first bottom often shows signs of exhaustion, such as:
- Long lower wicks rejecting further downside
- Oversold RSI (below 30)
- Decreasing bearish volume
- Failed closes below key swing lows
At this point, it’s not a reversal yet, but it’s where the market starts pushing back.
Neckline
Following the first bottom, the price rebounds upward, creating a temporary recovery. The high of this bounce forms the neckline, which becomes the pattern’s upper boundary and future resistance level.
Characteristics:
- Often aligns with previous reaction high
- Volume is usually neutral or fading, signaling a pause in momentum
- Midpoints of previous bearish candles
Volume during the bounce tends to be mixed, not yet signaling a reversal, but showing early interest from buyers.
Second Bottom
After failing to break above the neckline, the price pulls back again and retests the same support zone as the first bottom. This forms the second bottom, the most critical part of the pattern.
Characteristics:
- Price holds above or at the same level as the first bottom
- Less aggressive selling pressure
- Bullish divergence on RSI, MACD, or OBV
- Buyers begin stepping in earlier than before
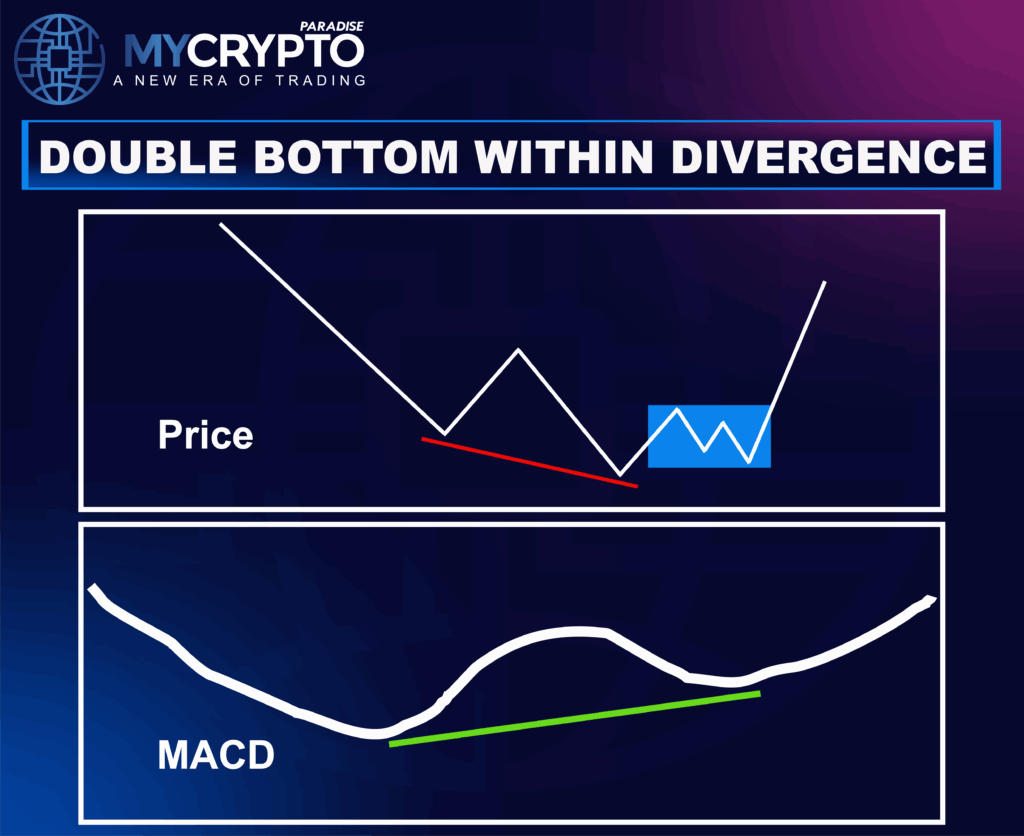
This second test of support confirms that sellers are losing control.
Breakout Point
As the price bounces from the second bottom, it heads back toward the neckline. This move is where many crypto traders anticipate a breakout.
Characteristics:
- Small consolidation below the neckline
- Volume slowly increasing
- Sellers are defending the zone but struggling to push the price back down.
Breakout: Structural Confirmation of Reversal Pattern
The pattern is confirmed when the price breaks and closes above the neckline, ideally on strong bullish volume. This signals a true shift in market sentiment, from bearish to bullish.
Technical expectations at this point:
- Clean candle close above the neckline
- Spike in volume confirming breakout strength
- Retest of the neckline from above often acts as confirmation and entry zone
How to Trade the Double Bottom Reversal Pattern
Entry Strategy
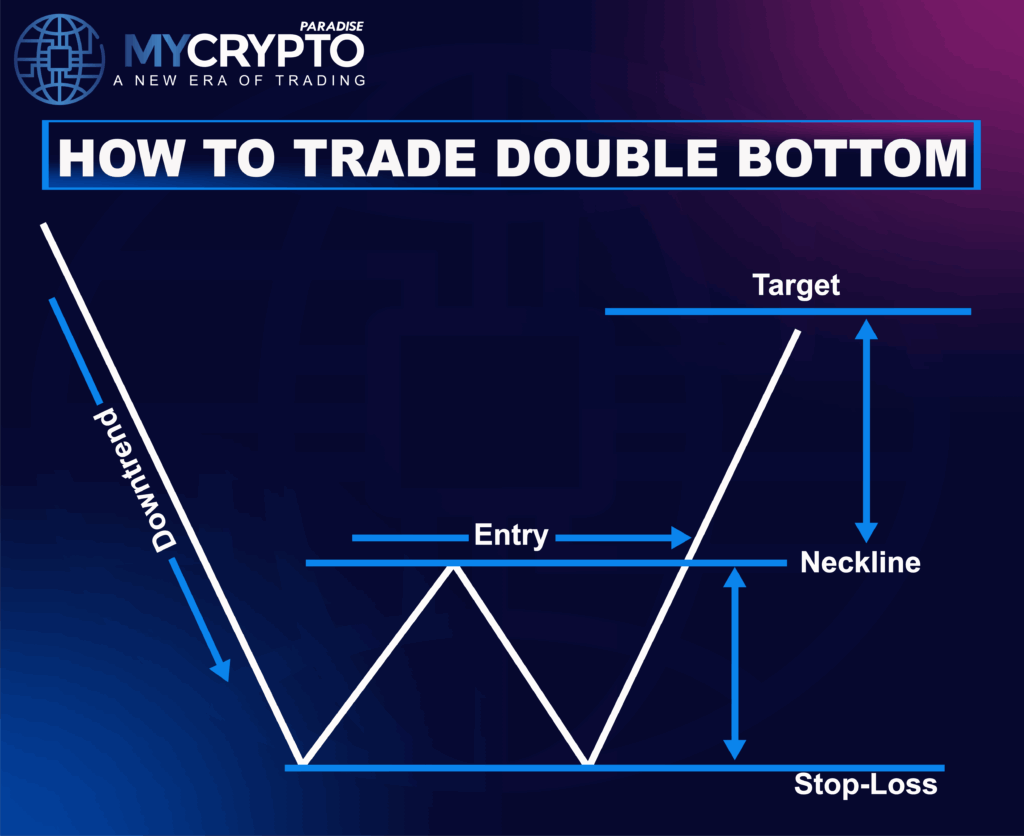
In a valid double bottom, the second low forms at or near the same level as the first, signaling strong support. But don’t jump in too early. The real entry signal comes when the price breaks above the neckline, the resistance formed between the two bottoms.
The safest way to enter is to wait for a clean candle close above the neckline, ideally with a noticeable increase in trading volume. This confirms that buyers have taken control and the pattern is active. Entering before the breakout can lead to getting caught in a fakeout or premature move.
Exit Strategy
Managing your exit is just as important as your entry. A smart exit plan includes both your stop-loss and your profit target, based on the pattern’s structure.
Place your stop-loss just below the second bottom. This is the last level where the bullish setup still makes sense. If the price breaks below this zone and holds, the pattern has likely failed, and staying in the trade exposes you to unnecessary downside. Your stop should give enough space to avoid being shaken out by normal price noise, but not so wide that your risk becomes unmanageable.
To set your profit target, measure the height from the lowest bottom to the neckline, then project that same distance upward from the breakout point. This is called the measured move, and it gives you a realistic target that aligns with the pattern’s potential. For example, if the double bottom forms between $0.80 and a neckline at $1.00, the projected target after breakout would be around $1.20.
At ParadiseFamilyVIP 🎖️, we guide our traders through Double Top setups with real-time structure confirmation, breakdown alerts, and exit management, because the difference between spotting a pattern and trading it well is execution. 👉 Check availability here (Click it).
Common Mistakes to Avoid When Trading the Double Bottom Reversal Pattern
The Double Bottom is one of the clearest bullish reversal patterns in crypto, but even solid setups can fail if they’re traded without discipline. Here are the most common mistakes beginner crypto traders make, and how to avoid them in live conditions.
Misreading the Pattern Structure
Not every “W”-shaped move is a true Double Bottom. A valid setup requires two clean, well-defined lows at similar levels, with a clear bounce in between. If the second low is much lower, or there’s no real downtrend leading into it, the pattern may be invalid.
This mistake often happens when crypto traders force patterns into charts instead of waiting for a clean structure. If it doesn’t meet the criteria, don’t trade it.
Jumping In Before Pattern Reversal Confirmation
One of the most common errors is entering after the second bottom forms, but before the neckline is broken. This is risky. Until that breakout happens, the market may still be in a downtrend or ranging.
The neckline break is what shifts control from sellers to buyers. Wait for a strong close above the neckline; it’s worth the wait to avoid getting faked out.
Placing Stops Too Close to Support
Setting your stop just below the second bottom might feel safe, but in crypto, it’s often a setup for failure. Minor dips or volatility wicks can trigger your stop, even when the pattern is still valid.
Instead, place your stop just beyond the structure, below recent wick lows or a level that breaks the pattern’s integrity. This gives the trade room to play out while still protecting you if the reversal fails.
Ignoring Volume at the Breakout
A breakout without conviction is often a trap. If price breaks the neckline on low volume, it may not follow through and could quickly reverse.
Volume confirmation remains a key in confirming the reversal. Strong buying volume at the breakout strengthens the signal and reduces the risk of a fake move.
FAQs
What does a double bottom pattern mean in crypto trading?
A double bottom pattern signals that a downtrend may be ending and a bullish reversal could be starting. It shows that buyers are stepping in at a strong support level after sellers failed to push the price lower twice.
How do I know if a double bottom is valid?
A valid double bottom has two clearly defined lows at similar price levels, with a bounce in between that forms a resistance line (the neckline). The pattern is confirmed only when the price breaks and closes above that neckline.
Where should I set my stop-loss in a double bottom setup?
Place your stop-loss below the second bottom, ideally under the lowest wick. This protects your trade if the pattern fails, while giving it enough room to avoid being stopped out by normal volatility.
Can a Double Bottom pattern be combined with other indicators?
Yes, combining the Double Bottom with tools like bullish RSI divergence, a MACD crossover, or a moving average reclaim can add strong confirmation. These signals help validate the reversal and reduce the risk of entering on a false breakout.
Why does the double bottom formation pattern sometimes fail?
The double bottom formation pattern can fail due to false breakouts, where the price briefly breaks above the neckline but doesn’t sustain. Lack of volume confirmation also weakens the pattern, as it shows insufficient buyer interest to drive the price up.
Conclusion
The Double Bottom pattern gives crypto traders a reliable way to spot when a bearish trend is losing steam, and when buyers may be ready to take over. Its clear structure, two lows, one neckline, and a confirmed breakout, helps cut through the noise and brings structure to chaotic price action.
But recognizing the pattern is just the start. Execution is everything. That means waiting for a confirmed breakout, placing stops where the pattern truly fails, and backing your setup with volume or supporting indicators.
That’s exactly what we deliver inside ParadiseFamilyVIP 🎖️. Our team uses proven setups like the Double Bottom pattern, supported by on-chain data, sentiment analysis, and whale tracking, to deliver high-quality crypto signals, complete with real-time entries, exits, and portfolio support.
Ready to trade with more structure and confidence?
👉 Check availability for ParadiseFamilyVIP 🎖️ (Click it)
If spots are full, you can join the waitlist to lock in your place for the next opening.
Just getting started? Our free Telegram channels are the perfect space to learn, grow, and connect with a serious community of focused traders.