


Technical Analysis Indicator
In short
Moving Averages are influential indicators that calculate an asset's average price over a specified period. They are commonly known as Simple Moving Average (SMA) or Exponential Moving Average (EMA), with EMA giving more weight to recent prices. This technical tool is widely applied across various financial markets, including cryptocurrency trading, to help identify trends.
Moving averages are one of the most influential indicators across all markets. As the name suggests, the moving average measures the average price at which the asset is trading for a given duration. The ‘moving average’ is widely known as the arithmetic mean or the Exponential Moving Average, which response toward more recent values.
Interestingly, with the cryptocurrency market crossing $1.5 trillion in value, traders and investors joined in on the movement. Cryptocurrency trading is easily the most influential market of this decade, mostly when Bitcoin, the leading asset in the cryptocurrency market, has been dubbed as the decade’s best performing asset and has continuously taken the mantle of the best-performing asset every year.
Consequently, the cryptocurrency market is no exception to the moving average market indicator. So, in this article, we’ll explain how to trade cryptocurrencies using Moving Average.
What are Moving averages?
Before we dive into trading cryptocurrencies, we need to understand what the Moving average indicator originally is. Moving Average is commonly known as Simple Moving Average. The previous price action is the one, on which the Moving Average lagging indicator relies upon.
You may adjust the number of times taken into account when constructing a moving average. A cycle is a unit of time dependent on the time period you’re watching on the graph. If you have a 50-period moving average and are looking at an hourly chart, for example, the moving average will smooth the value depending on the last 50 hours of data. The price will be sorted using the last 50 days of price action unless you’re following the daily chart.
The moving average lengths of 9, 20, 50, 100, and 200 are the most notable. The lower periods are commonly known as faster periods, while higher periods are depicted as slower periods or look back periods. We must recognize that each of these periods is lagging.
Interestingly, Moving averages are great indicators for trading trending markets. You can integrate them with each variation of themselves of other indicators to develop sophisticated and discretionary strategies.
Determining Time Period
Now that we understand what moving averages are let’s move on to trading with moving averages. Before we start using moving averages, we should determine the most suitable time periods for our trading style.
A shorter moving average would suit your trading strategy if you are already a short-term trader. Consequently, if you’re a long-term trader, you’ll be better off with a longer moving average.
Now that we’ve determined what time period is perfect for our trading style, let’s move on to trading with moving averages.
How does the moving average indicator perform in trading?
A moving average functions as a support and resistance measure. The longer your time spans, like most metrics, the greater the active support or resistance. This means that when the moving average is heading towards or pointing upward, it indicates that the primary price action is moving in an upward trend.
With the indication of an upward or downward trend, we can remember some key information about the trend’s intensity, such as how much the price has deviated from the moving averages and how long the moving averages have been shifting from heading upwards to heading downwards.
Details like these can help us tell the conditions of a trend.
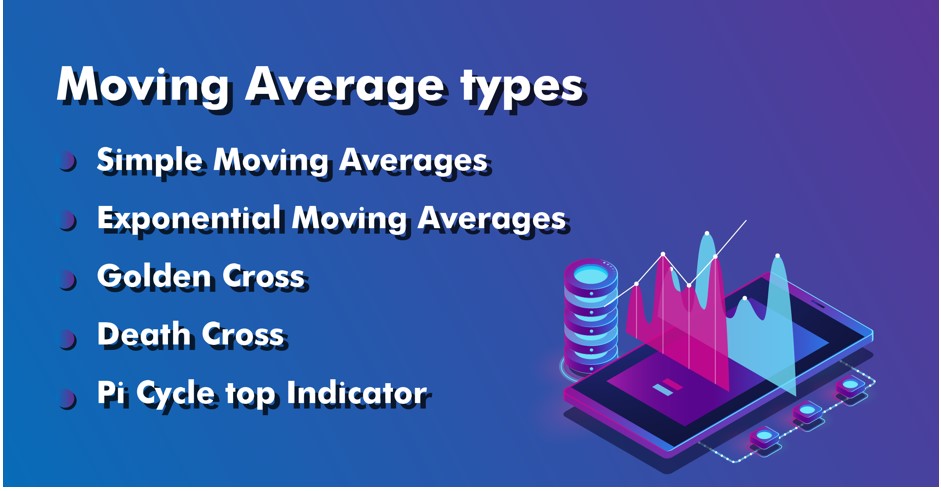
Moving Average types
There are various types of moving averages. The two main types are traditional moving average, commonly known as simple moving average, and the latter is known as exponential moving average, a weighted moving average that emphasizes recent prices.
Simple Moving Averages
With the indication of an upward or downward trend, we can remember some key information about the trend’s intensity, such as how much the price has deviated from the moving averages and how long the moving averages have been shifting from heading upwards to heading downwards.
Exponential Moving Averages
Unlike Simple moving averages, Exponential moving averages place mover weight on more recent trading actions. Therefore, EMAs are prone to price actions than SMAs and can determine trends before it. However, earlier opportunities with EMA could be deemed fake and have a higher degree of risk.
Golden Cross
The Golden Cross is when a shorter MA moves above a longer one and typically cover 50- and 200-day MAs. This indicator often highlights a potential upward trend.
Death Cross
Opposite the Golden Cross, the Death Cross is when the shortening of the MA passes below the longer one and occupies the 50-and 200-day MA. This indicator often highlights a potential downward trend.
Pi Cycle top Indicator
Proposed by Philip Swift, this variant of moving average strategy was ideal for high-priced, highly volatile assets such as Bitcoin. The Pi Cycle Top indicator is based on Bitcoin’s 350-day MA and doubles the MA price. Besides, the 111-day MA is also inserted into the chart. The intersection of these MAs allows uses to call tops in the price of Bitcoin within three days.
Conclusion
Moving averages are commonly-used trading indicators that are very versatile and functional. You can use various combinations, tactics, and moving average variations to achieve different trading results and approaches.
What is different here
Most guides stop at the theory. The MyCryptoParadise team shares the live trades, and the reasoning behind each one, inside ParadiseFamilyVIP. Everything here is education, not financial advice.
Crypto trading involves substantial risk and is not suitable for everyone. Nothing here is financial advice; it is education only. Never risk more than you can afford to lose.


Join the discussion 1
Nice, good description