


Elliott Wave Theory
In short
A zigzag correction is a sharp, three-wave (A-B-C) pullback pattern within Elliott Wave Theory that typically follows an impulse wave. It involves waves A and C moving in motive mode and wave B in corrective mode, resulting in a steep retracement before the original trend resumes. This pattern helps traders identify deep pullbacks and potential trend continuation points.
- Zigzag correction is a sharp, three-wave (A-B-C) pullback that helps the market reset before continuing in the same direction.
- Trend channels help predict Wave C’s endpoint, turning Zigzag corrections into high-probability trade setups.
- Traders can use Zigzag corrections to anticipate deep pullbacks and identify strategic entry points before the trend resumes.
A zigzag correction is one of the most common patterns in Elliott Wave Theory, appearing right after an impulse wave. It’s a three-wave (A-B-C) structure that creates a steep retracement before the trend resumes.
Understanding zigzag corrections helps traders navigate pullbacks, avoid false signals, and spot trend continuation opportunities. In this article, we’ll break down the characteristics of zigzag waves, their rules, and practical applications in trading. Let’s dive in.
What is a Zigzag Correction?
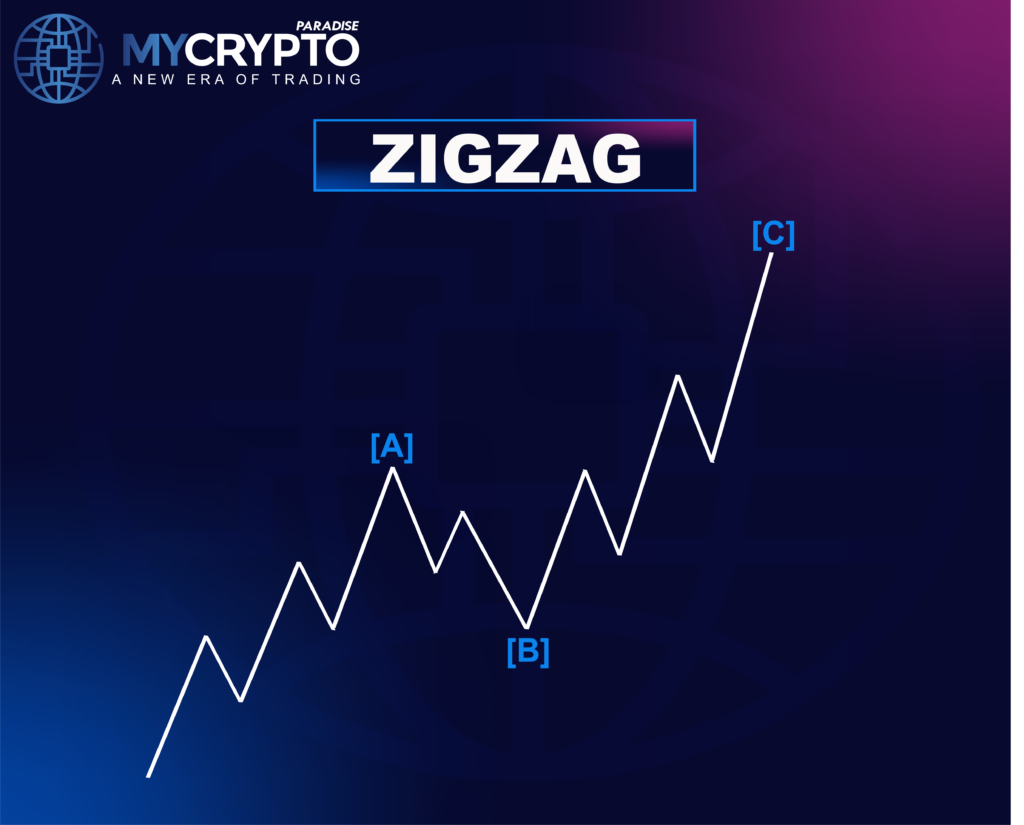
A zigzag correction is the most famous corrective pattern in Elliott Wave Theory, occurring after a five-wave impulse. Once the market completes an impulse wave, it doesn’t move in a straight line forever. Instead, it enters a correction phase, where the price retraces part of the previous move before continuing the trend. Among all corrective structures, the zigzag correction stands out as one of the sharpest and most directional patterns, creating a steep three-wave (A-B-C) retracement.
Unlike flat or sideways corrections, a zigzag forms a quick and deep pullback, often retracing more than 50% of the previous impulse wave. The pattern consists of Wave A and Wave C moving in motive mode, while Wave B moves in corrective mode, making it an essential formation for traders looking to anticipate trend continuation. The steep nature of zigzags often confuses traders, leading them to believe a full trend reversal is happening when in reality, the market is just resetting before its next move.
Recognizing a zigzag correction early provides crypto traders with a strategic advantage, allowing them to avoid false reversal signals, enter trades at optimal price levels, and align with the main trend.
Nature of Zigzag Corrections
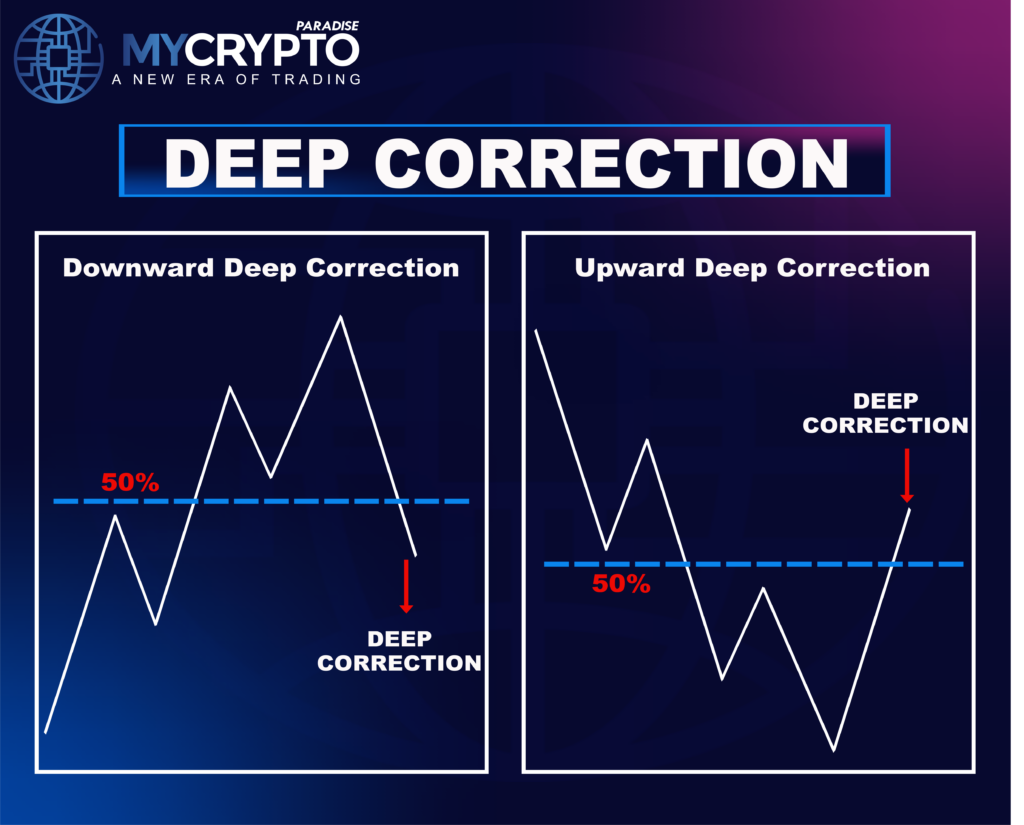
A zigzag correction is a deep and most structured retracement in Elliott Wave Theory, typically pulling back more than 50% of the previous impulse wave. Unlike shallow corrections that barely disrupt the trend, zigzags create a sharp and decisive move against the main direction, temporarily shifting market sentiment.
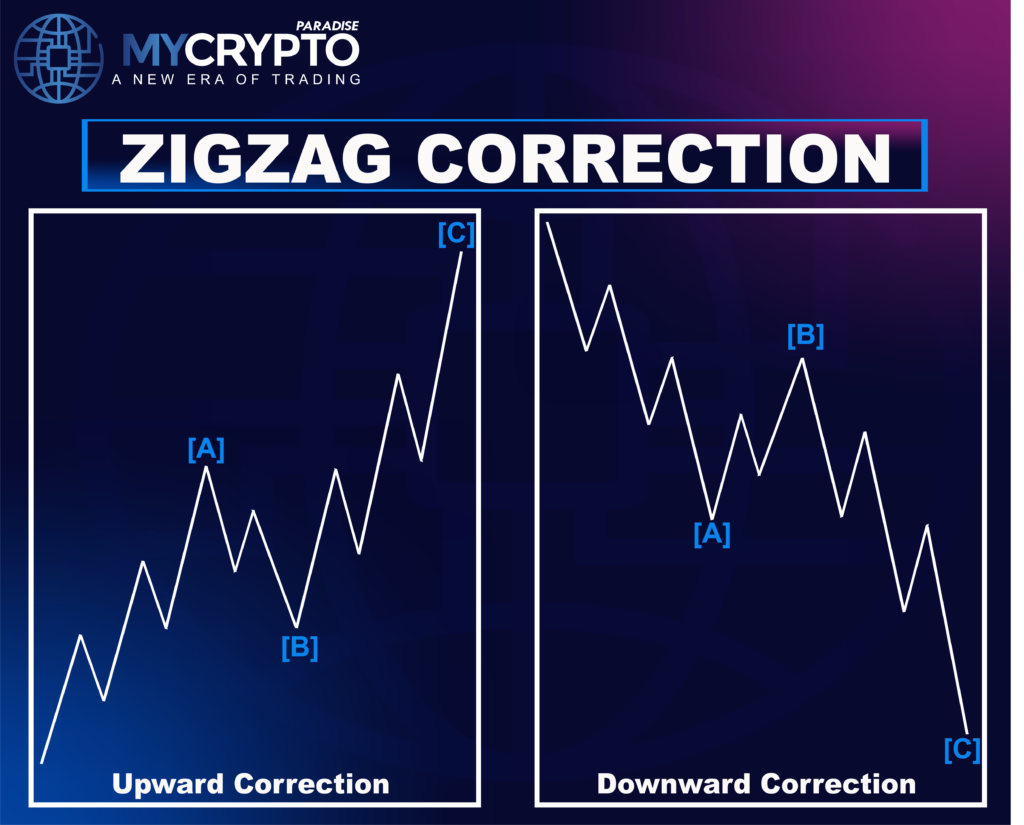
An upward zigzag correction drives prices lower in a forceful pullback. Wave A starts the decline, Wave B brings a brief recovery, but Wave C extends the drop, often reaching new lows before the trend resumes. This movement can trick traders into believing the uptrend is over when, in reality, the market is just resetting before continuing higher.
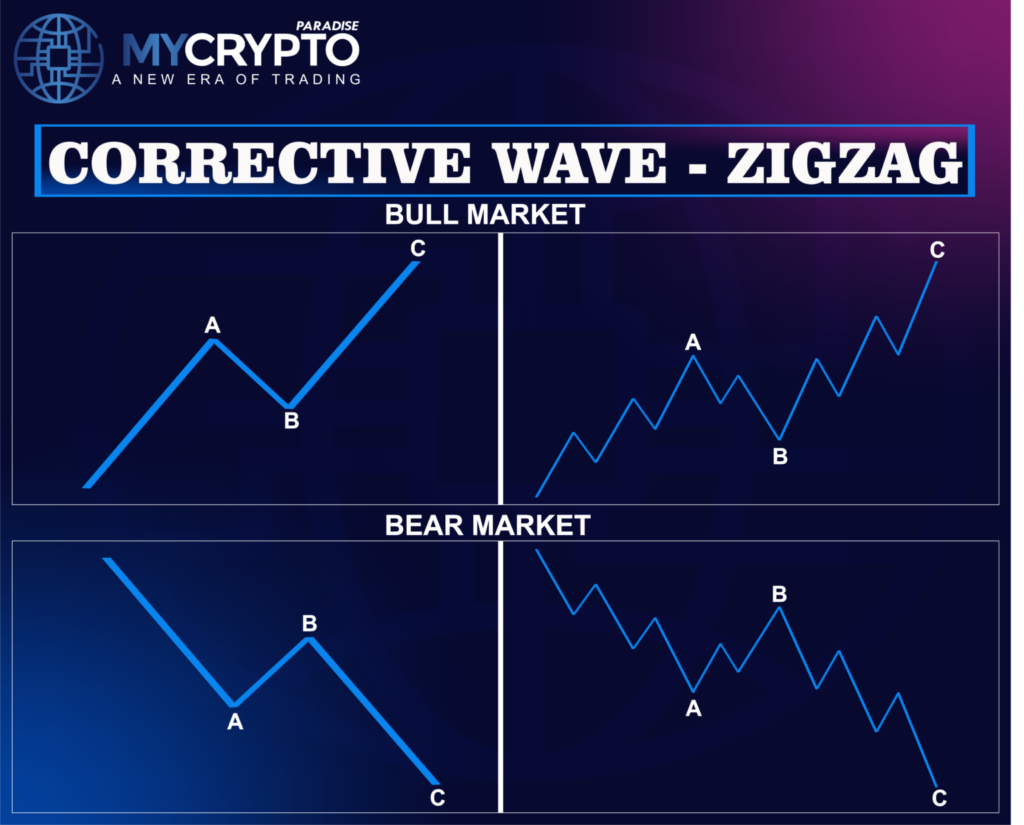
A downward zigzag correction works in reverse, creating a fast but temporary rally. Prices rise sharply, giving the illusion of a reversal, but once Wave C completes, the downtrend resumes. Many traders get caught entering too early, only to see the market turn back against them.
Since zigzags create deep corrections, they serve as crucial turning points in price action. Identifying them early helps traders differentiate between a temporary pullback and an actual trend reversal, allowing for better market timing and trade execution.
What Makes a Zigzag Unique?
Zigzag correction stands out because of its structured and directional nature. Any complex corrective pattern can be broken down into zigzags, and zigzags themselves consist of impulse waves. This makes them one of the most predictable corrections in Elliott Wave Theory.
Characteristics:
- Always consists of three waves (A-B-C).
- Wave A and C are in motive mode, while Wave B is in corrective mode.
- Zigzag correction can be prolonged through double or triple zigzag.
- Zigzag is a deep correction.
To understand how zigzag corrections shape market movement, let’s break down their structure and examine the role of each wave.
Wave Structure of a Zigzag
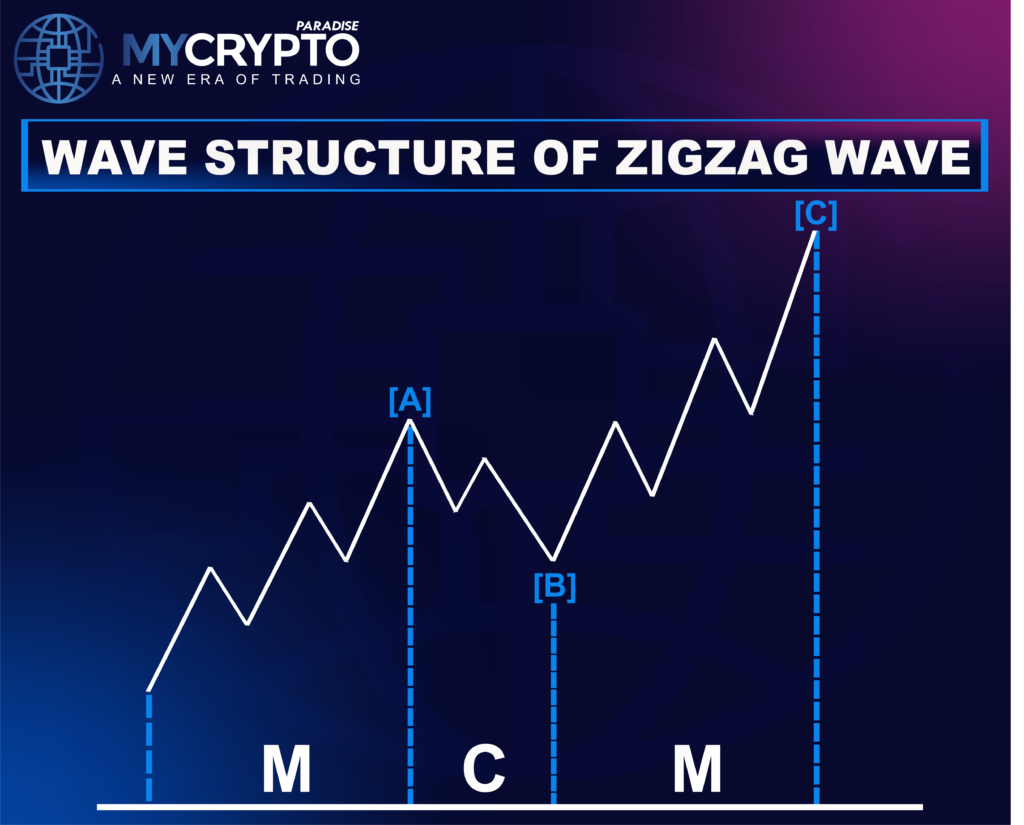
The zigzag wave pattern follows a strict three-wave structure, labeled A-B-C, where each wave has a specific mode of formation. In Elliott Wave Theory, motive waves are waves that push the market forward in a trend, while corrective waves move in the opposite direction, creating temporary retracements.
In a zigzag pattern:
- Wave A → Motive Mode (Usually an Impulse, sometimes a Leading Diagonal).
- Wave B → Corrective Mode (Can take the form of a Zigzag, Flat, or Triangle).
- Wave C → Motive Mode (Typically an Impulse, occasionally an Ending Diagonal).
Understanding how these waves interact is key to recognizing zigzag corrections early and using them to anticipate market movements.
Wave A
Wave A is the first sign of a zigzag correction, breaking the momentum of the previous trend. It always forms in motive mode, meaning it follows an impulse wave structure (five sub-waves) or, in some cases, a leading diagonal. Since Wave A moves forcefully, it can sometimes trick traders into thinking the trend is reversing, when in reality, it’s just the start of a correction.
Wave B
Wave B is the trap that catches many traders off guard. Unlike Wave A, it is always corrective, meaning it lacks the strength to continue the trend. It moves against Wave A but never fully retraces it.
Wave B can take several forms, including:
- A smaller Zigzag (5-3-5 structure)
- A Flat correction (3-3-5 structure)
- A Triangle (3-3-3-3-3 structure)
Wave C
Wave C is the most powerful part of the zigzag correction, completing the retracement. Like Wave A, it forms in motive mode, usually as an impulse with five sub-waves. In some cases, Wave C develops as an ending diagonal, signaling that the correction is losing steam before the main trend resumes. Most of the time, Wave C extends beyond the end of Wave A, confirming the full completion of the correction. While rare, a truncated Wave C (where it fails to surpass Wave A’s endpoint) can occur.
In the next section, we will break down the rules and identify the end point of zigzag correction to ensure a clear and systematic approach.
Zigzag Correction Rules
1. Zigzag Correction is a Three-Wave Structure
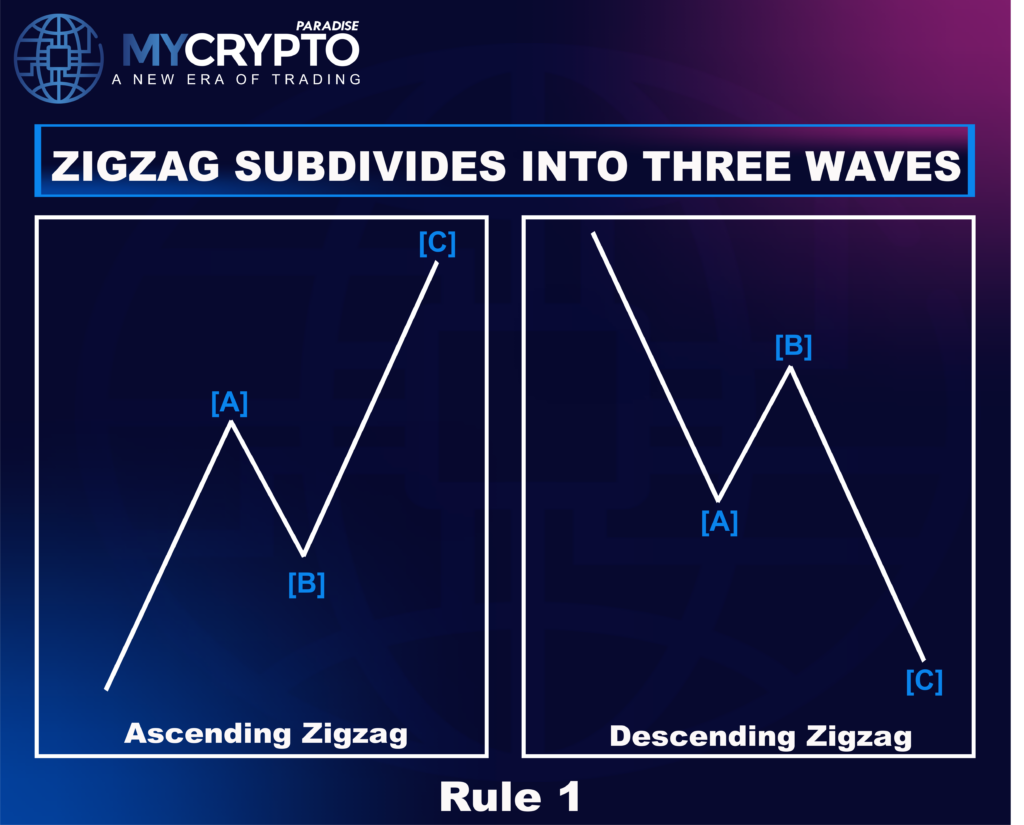
A zigzag correction must always consist of three waves, labeled A, B, and C. This structured three-wave formation is what makes a zigzag distinct from other corrective patterns.
2. Wave Formula
The internal structure of a zigzag wave comprises:
- Wave A, Motive mode.
- Wave B, Corrective mode.
- Wave C, Motive mode.
3. Wave B is Always Shorter than Wave A
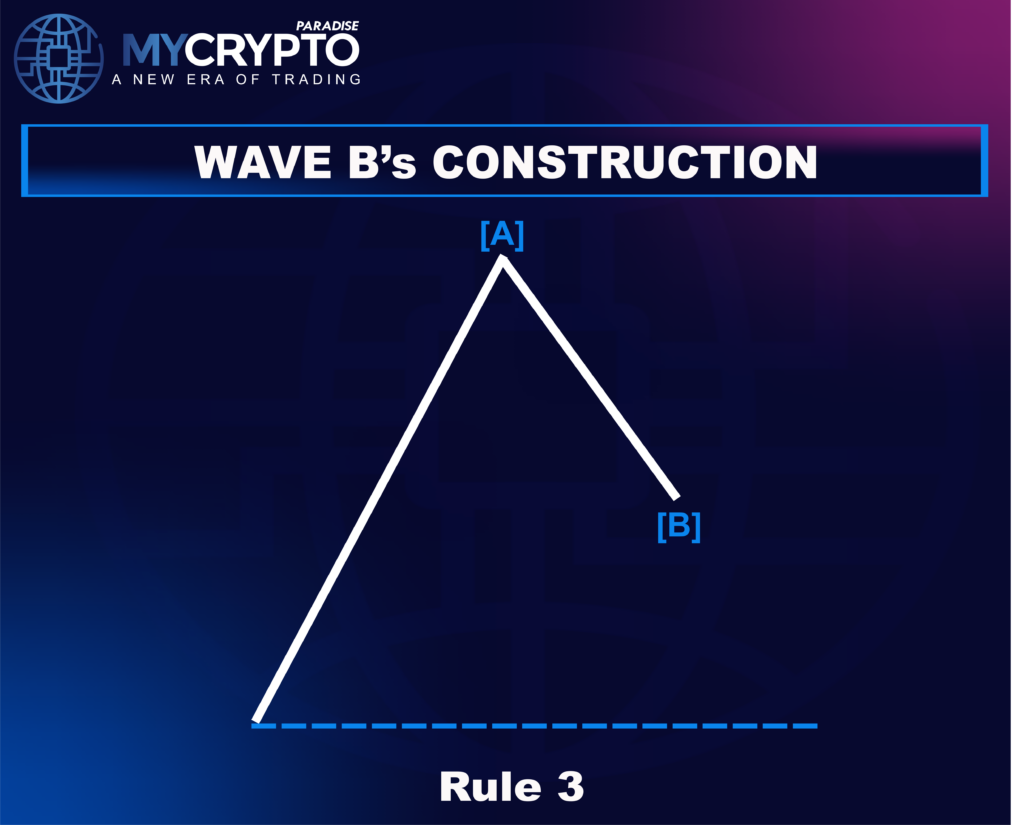
Wave B is a corrective wave and is always shorter than Wave A. It retraces part of Wave A but never fully negates it, ensuring that the correction remains structured.
4. Wave C Almost Always Ends Beyond the End of Wave A
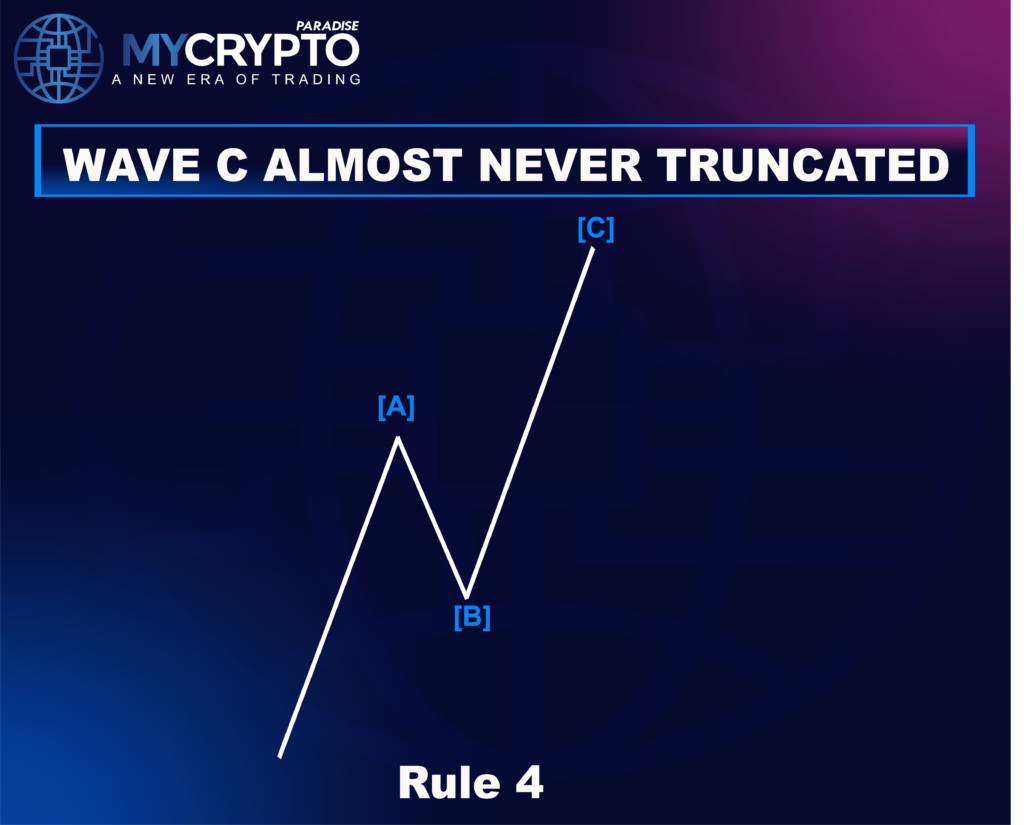
In most cases, Wave C extends beyond Wave A’s endpoint, completing the zigzag pattern. While truncated Wave C formations exist, they are extremely rare.
5. Zigzag Corrections Must Retrace at Least 50%
A defining characteristic of a zigzag correction is its depth. To be classified as a zigzag, the correction must retrace at least 50% of the preceding impulse wave. This distinguishes zigzags from shallow corrections, which do not reach this threshold.
Descending Pattern of a Zigzag Wave
A Zigzag correction can occur in both uptrends and downtrends, following the same structural principles. In a downtrend, this pattern is called a Descending Zigzag Wave, where the price follows a three-wave sequence (A-B-C).

How Waves Behave in a Descending Zigzag Correction?
Just like an ascending zigzag, a descending zigzag wave also consists of three sub-waves:
- Wave A: The first wave moves downward, establishing the initial bearish move. It often follows an impulsive or leading diagonal structure.
- Wave B: This wave moves upward, retracing much of Wave A but staying within its range. It typically forms a corrective pattern like a flat, triangle, or another zigzag.
- Wave C: The final wave moves downward again, extending beyond the end of Wave A and resuming the overall downtrend. Wave C is often impulsive, confirming bearish continuation.
Descending Zigzag Wave Rules
To confirm a valid Descending Zigzag Wave, traders should look for these structural rules:
- Three-wave structure: A descending zigzag always subdivides into three waves (A, B, C), following a corrective pattern.
- Wave Formula: The wave sequence follows a Motive-Corrective-Motive (M-C-M) structure.
- Wave B Is Shorter Than Wave A: Wave B is a corrective wave and must not retrace beyond the start of Wave A.
- Wave C Is Almost Never Truncated: Wave C typically reaches its expected Fibonacci extension, usually 100%-161.8% of Wave A, and does not fall short.
- Zigzag Corrections Are Deep Retracements: A descending zigzag wave usually corrects 50% of the preceding move, making it a deep correction compared to other corrective structures.
By recognizing these characteristics, traders can identify descending zigzag patterns and anticipate potential trend continuation or reversal points.
Predicting the End of a Zigzag Correction
Catching the end of a zigzag correction before it happens is a skill that sets PRO traders apart. While corrections may seem unpredictable, zigzags follow a structured pattern, making them easier to track than they appear. By using wave symmetry and trend channeling, traders can get ahead of the market and pinpoint where Wave C is most likely to end, transforming uncertainty into a strategic opportunity.
Wave A and Wave C are Often Equal in Length
One of the most effective ways to spot the end of a zigzag correction is by analyzing Wave A’s length. In many cases, Wave C will extend by a similar distance, as both waves move in motive mode and follow a structured price movement.
For example, if Wave A measures 100 points, Wave C will often reach a comparable length before hitting support or resistance. While this isn’t a fixed rule, it occurs frequently enough to serve as a valuable forecasting tool. Instead of guessing when the market will reverse, traders can measure Wave A’s range, project it forward, and prepare for Wave C’s potential completion.
Using Channels to Predict Wave C’s End
Another powerful method for predicting where a zigzag correction will end is trend channeling. This simple yet highly effective technique visually maps out price movement. It eliminates uncertainty and provides traders with a clear boundary for Wave C’s projected path.
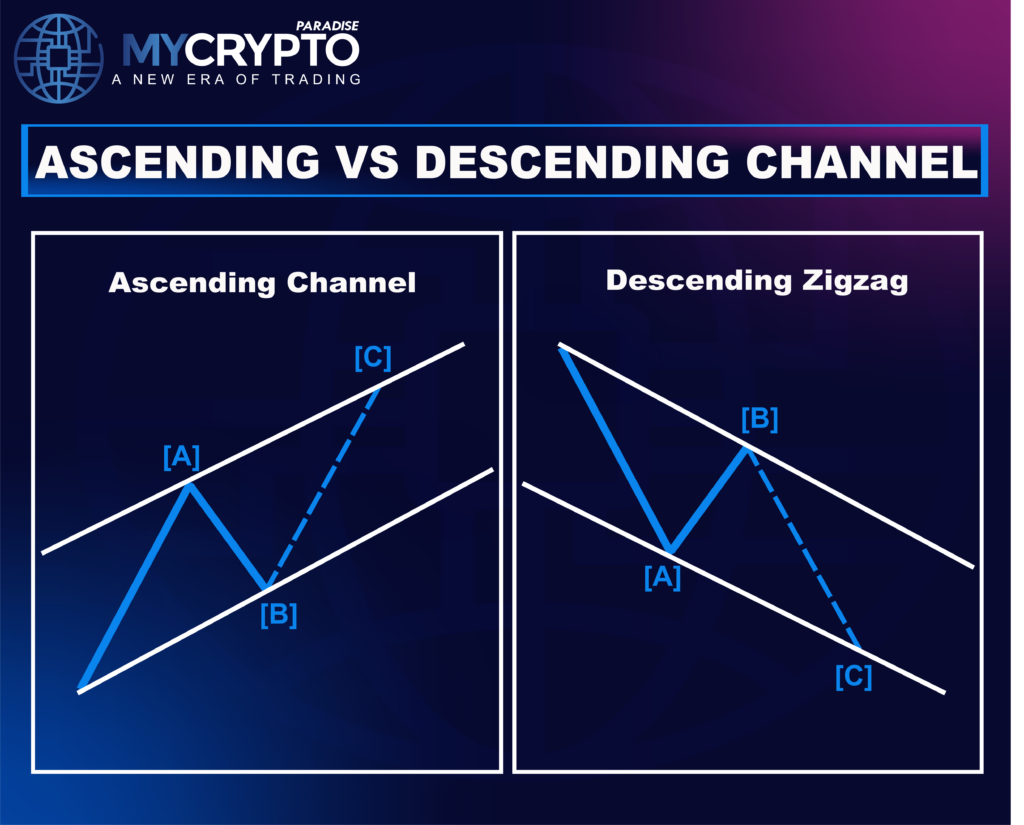
Here’s how to apply it:
- Draw a trendline from the beginning of Wave A to the end of Wave B. This establishes the correction’s foundation.
- Duplicate this trendline and place it at the end of Wave A. This creates a projected boundary for Wave C.
By combining wave symmetry (A = C) with trend channeling, traders can turn zigzag corrections into high-probability trade setups. Let’s see how they can be used in trading strategies.
Trading Strategy for Zigzag Correction
Once you can spot a zigzag correction and identify where Wave C is likely to end, the next step is knowing how to trade it. A structured approach helps traders find smart entry points and exit with confidence.
Entry Strategy
The first step is identifying the completion of Wave B, which typically retraces 38.2%-61.8% of Wave A before the market resumes its trend. Since Wave A is the initial drop (or rise) in a zigzag, Wave B moves against it but remains weaker. Signs of exhaustion, such as price rejection at Fibonacci levels, weakening momentum, or reversal candlestick formations, can help confirm that Wave B is ending.
A well-timed entry occurs when the price breaks a key support or resistance level with strong momentum, signaling the start of Wave C, which moves in the same direction as Wave A and typically follows a structured price movement.
Exit Strategy
With Wave C often mirroring the length of Wave A, traders can use this relationship to establish precise profit targets. The 100% extension of Wave A serves as an initial target, while the 1.618 Fibonacci extension provides a potential level for extended moves. These measured projections help traders set realistic expectations for the completion of the correction.
Equally important to the strategy is trend channeling, which provides further confirmation for exit planning. By drawing a trendline from the start of Wave A to the end of Wave B and placing a parallel copy at Wave A’s endpoint, traders create a projected path for Wave C. As the price approaches this boundary, it often signals the end of the correction and an ideal point to exit.
By combining Wave B exhaustion with Wave C endpoint trading, traders can take a structured approach to zigzag corrections. They can identify high-probability entries, effectively time exits, and avoid common market traps.
Navigating corrections like the Zigzag can be tricky. At ParadiseFamilyVIP 🎖️, we simplify complex patterns, offering real-time setups, expert insights, and a supportive community to guide you. Whether you’re just starting or looking to refine your skills, we’re here to help you trade with confidence. Join us today!!
Zigzag Corrections FAQ
What is a zigzag correction?
A zigzag correction is the most common corrective pattern in Elliott Wave Theory, forming a steep three-wave (A-B-C) retracement after a five-wave impulse. It resets the market before the prior trend continues in the same direction.
How deep does a zigzag retrace?
A zigzag is a deep correction that must retrace at least 50% of the preceding impulse wave. This depth distinguishes it from shallow or sideways corrections that do not reach the 50% threshold.
What is the wave structure of a zigzag?
A zigzag follows a Motive-Corrective-Motive sequence. Wave A is motive (usually an impulse), Wave B is corrective and stays shorter than Wave A, and Wave C is motive and almost always extends beyond the endpoint of Wave A.
Why do traders mistake a zigzag for a trend reversal?
The sharp, directional move against the trend makes a zigzag look like a full reversal, especially during Wave B and the start of Wave C. Recognizing the three-wave structure early helps traders avoid false reversal signals and enter near the end of Wave C.
Crypto trading involves substantial risk of loss. This article is educational and is not financial advice. Past performance does not guarantee future results. Always do your own research.
What is different here
Most guides stop at the theory. The MyCryptoParadise team shares the live trades, and the reasoning behind each one, inside ParadiseFamilyVIP. Everything here is education, not financial advice.
Crypto trading involves substantial risk and is not suitable for everyone. Nothing here is financial advice; it is education only. Never risk more than you can afford to lose.


Join the discussion
No comments yet. Pro Paradiser members, share how you are reading this.