Elliott Wave Correction
In short
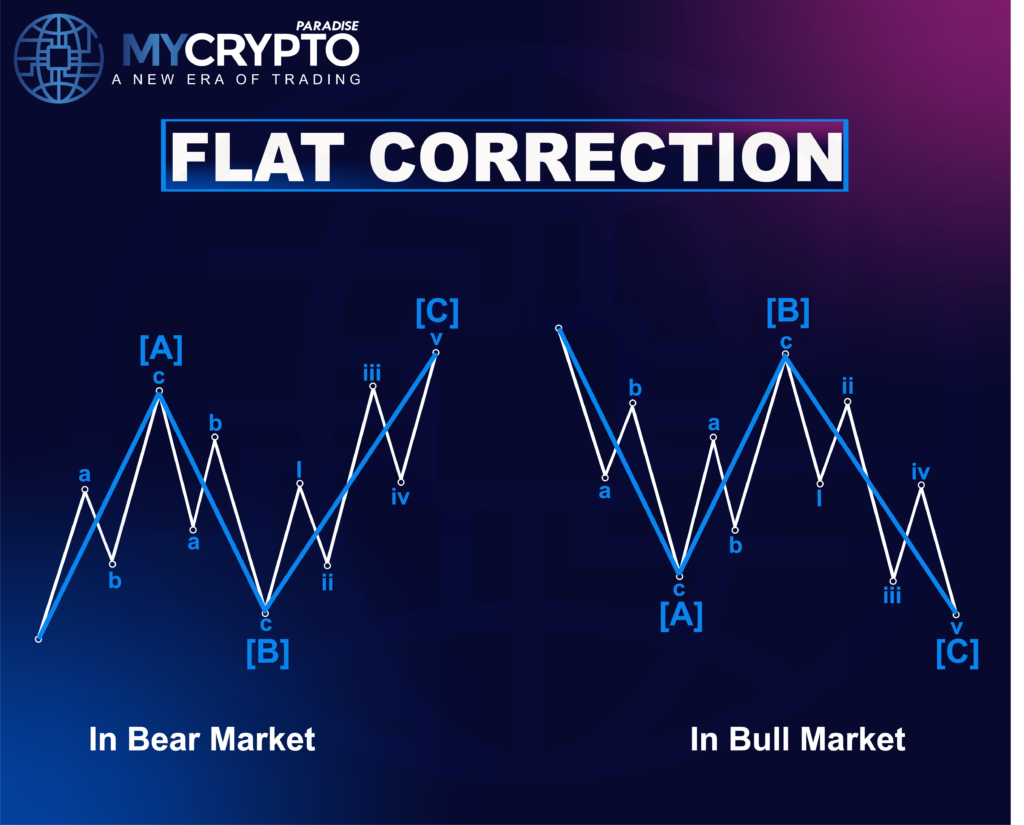
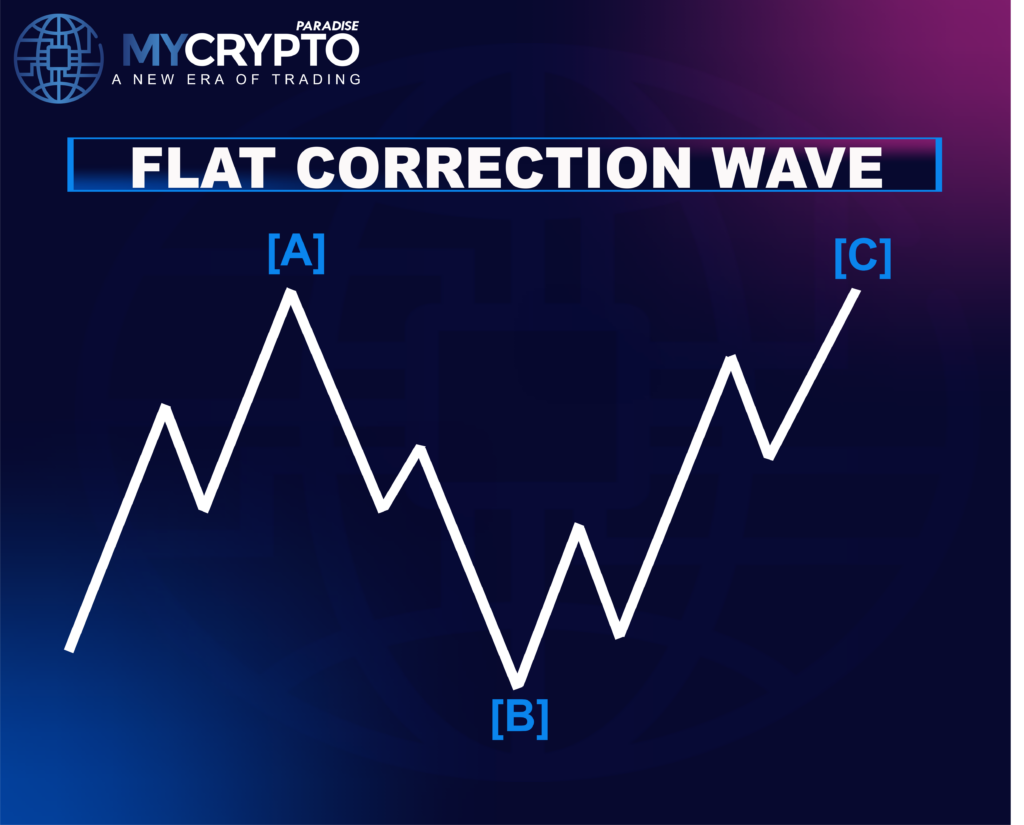
A Flat correction is a three-wave (A-B-C) pattern in Elliott Wave Theory that develops sideways, signaling market consolidation. In this pattern, waves A and B are corrective, with wave B retracing nearly 100% of wave A, while wave C is motive and typically forms an impulse. This sideways movement indicates a period of market consolidation that can precede either a trend continuation or a reversal.
- A Flat correction consists of three waves (A, B, and C) and develops sideways rather than sharp reversals.
- Waves A and B are both corrective, while Wave C is motive and often forms as an impulse.
- The Flat correction signals market consolidation and can indicate continuation or reversal depending on the trend.
The Flat correction is one of the fundamental corrective patterns in Elliott Wave Theory. In previous articles, we explored the Zigzag, another simple corrective structure. While the Zigzag often results in sharp price movements, the Flat correction is characterized by its sideways development, making it a crucial pattern for identifying market consolidations.
Flat correction in crypto trading can help you recognize potential continuation or reversal zones, especially when the market moves in a range. In this article, we will break down the rules of Flat correction, its different types, and how you can strategically trade it in the crypto market.
What is a Flat Correction?
A Flat correction is a three-wave corrective pattern in Elliott Wave Theory, labeled as A-B-C. Unlike sharp corrections like the Zigzag, the Flat correction develops sideways, indicating market consolidation before the next major move. This pattern occurs frequently in the crypto market and can help traders anticipate trend continuation or reversal zones.
In a Flat correction:
- Wave A forms in the corrective mode, meaning it lacks strong directional momentum.
- Wave B is also corrective and is typically equal to or slightly exceeds Wave A in length.
- Wave C is motive, meaning it follows a stronger directional trend and often forms an impulse wave or, in rare cases, an ending diagonal.
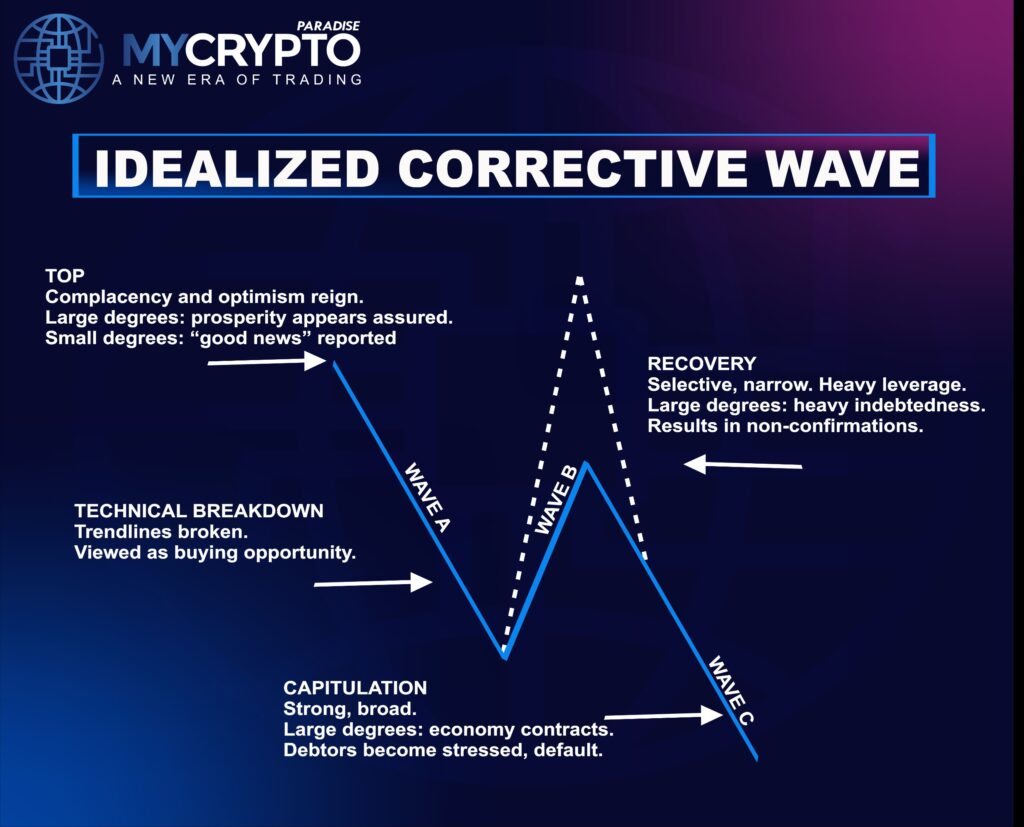
How Each Corrective Wave Typically Behaves
A Wave
In a bear market, the A wave is seen as a temporary pullback before the next advance. Many continue buying, even as technical damage begins to show. The structure of A influences B: a five-wave A implies a zigzag B, while a three-wave A points to a flat or triangle.
B Wave
B waves are deceptive bull traps, speculative, narrow, and often technically weak. They tend to concentrate in select areas and lack confirmation from broader movement. These rallies are almost always fully retraced by wave C. X and D waves in expanding triangles share similar traits. If something feels “off” in the market, it’s likely a B wave.
C Wave
C waves are strong and broad. The economy contracts, and stress builds. Debtors face pressure and may default. This wave follows the failed recovery of wave B and completes the correction.
Since the Flat correction moves horizontally rather than steeply, it often signals temporary market indecision before the price resumes its larger trend. Understanding this pattern allows crypto traders to position themselves strategically and manage risk effectively.
Why is Flat Correction Important?
The Flat correction is a common and crucial pattern in Elliott Wave Theory, helping traders identify market consolidation zones and potential trade setups. Since it develops sideways, it signals that the market is temporarily in equilibrium before making its next move. Understanding the importance of the Flat correction can give traders an edge in anticipating price behavior.
Here’s why the Flat correction matters:
- Frequent Market Occurrence : Flat correction is one of the most commonly observed corrective patterns, making it essential for traders to recognize and integrate into their strategy.
- Helps Identify Continuation or Reversal Zones : Since the Flat moves horizontally, it often indicates that the market is building strength for the next trend move. Recognizing whether the pattern will lead to continuation or reversal can significantly improve trade timing.
- Defines Market Structure and Corrective Behavior : Unlike sharp Zigzag corrections, Flats reflect a more balanced struggle between buyers and sellers. This makes them useful for spotting accumulation or distribution phases within a larger trend.
By learning how the Flat correction works, traders can strategically position themselves before a breakout, improving their decision-making and risk management.
Rules of the Flat Correction
The Flat correction follows a structured set of rules that define its formation. Unlike the sharp Zigzag pattern, the Flat correction is more balanced, with waves that often have similar lengths. Understanding these rules helps traders identify Flats correctly and anticipate market movements.
Rule 1:
A Flat correction is always composed of three waves, denoted as A-B-C. Each of these waves represents a phase of price movement within the correction. This three-wave structure differentiates it from motive waves, which contain five sub-waves.
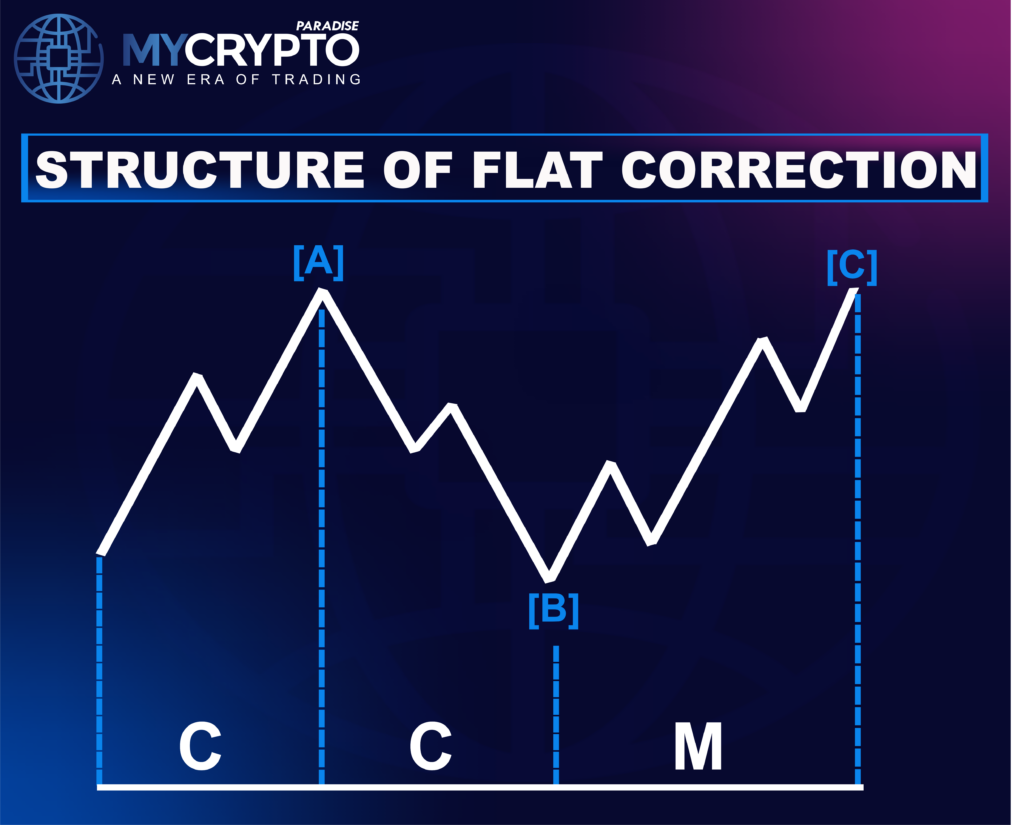
Rule 2:
- Wave A forms in a corrective manner, meaning it does not show strong trend continuation.
- Wave B is also corrective and often retraces most or all of Wave A.
- Wave C, unlike the first two, is a motive wave, meaning it follows a clear trend direction. It can form an impulse wave or, in some cases, an ending diagonal.
Rule 3:
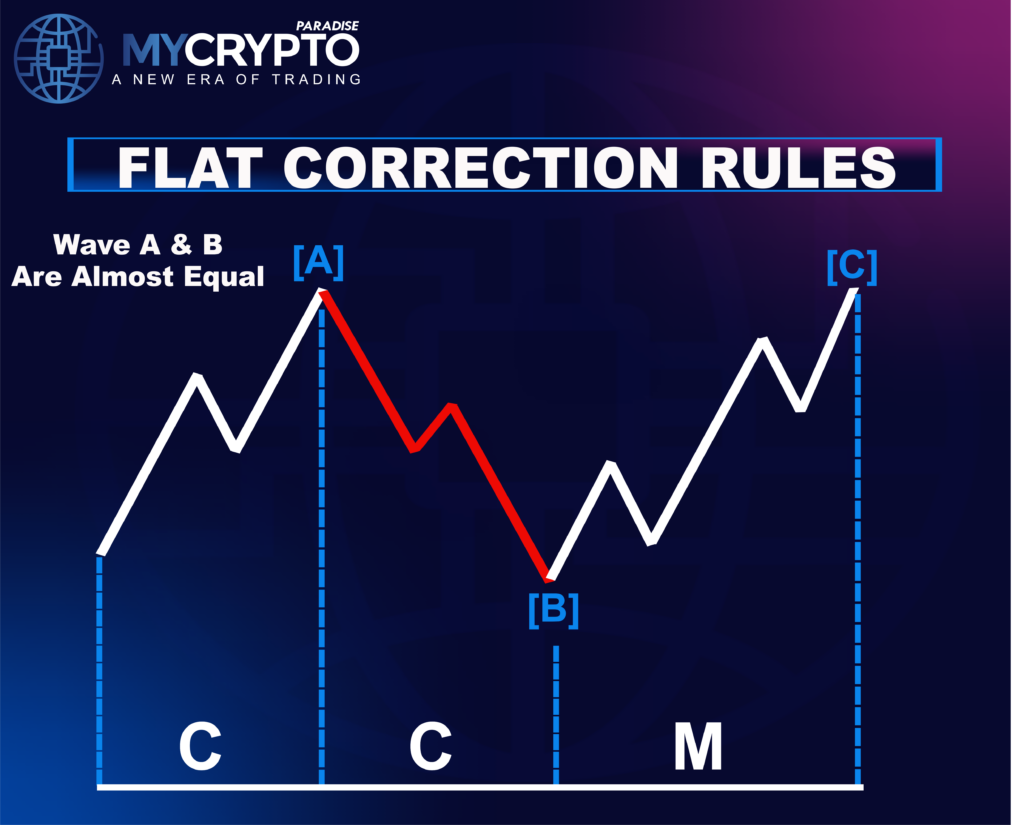
The Flat correction is considered a sideways pattern because Wave B tends to retrace close to 100% of Wave A. This balance between the two corrective waves results in a horizontally moving structure, distinguishing it from a Zigzag, which typically has deeper retracements.
Rule 4:
Wave C completes the Flat correction and can take different forms:
- It is often equal in length to Wave A or B, maintaining the horizontal structure.
- In some cases, Wave C extends beyond Wave B, leading to more aggressive price movement. This variation helps define different types of Flat corrections, which we will cover in the next section.
By understanding these rules, traders can accurately identify Flat corrections and make informed trading decisions. Next, we’ll explore how Flat corrections behave in a downtrend and how their structure remains consistent.
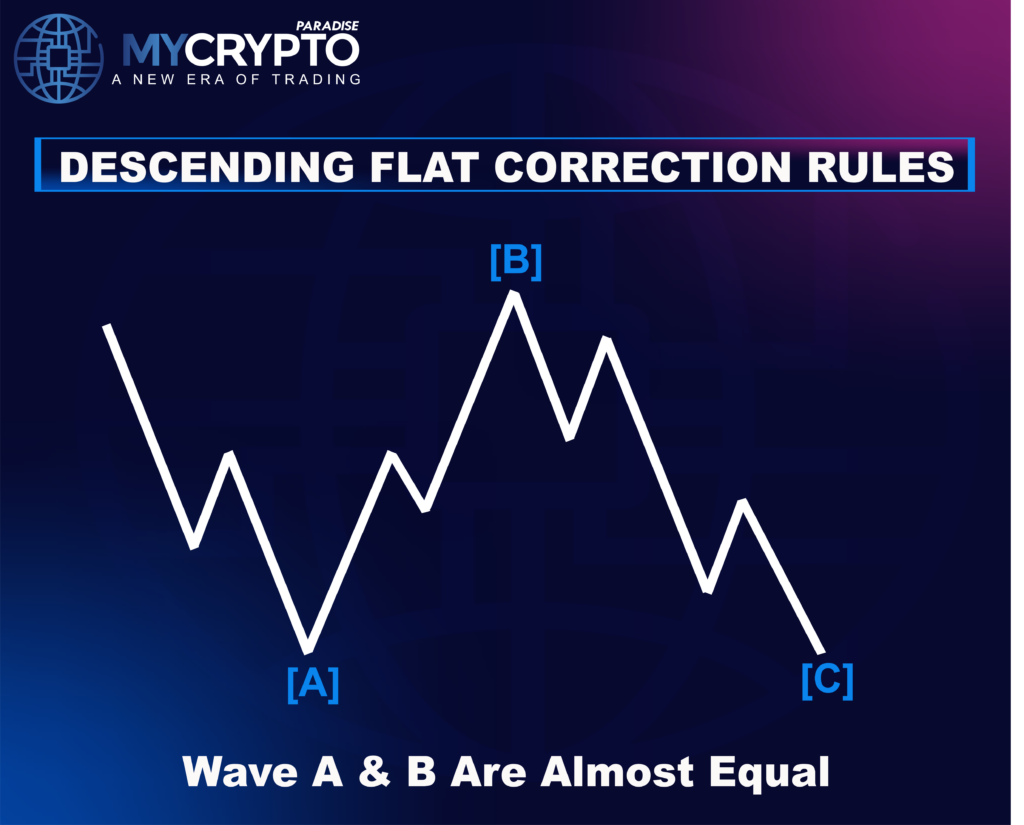
Descending Pattern of a Flat
A Flat correction follows the same structural rules in both uptrends and downtrends. When a Flat forms within a bearish market, it is called a descending Flat correction. This means the correction occurs against the prevailing downtrend before the price continues lower.
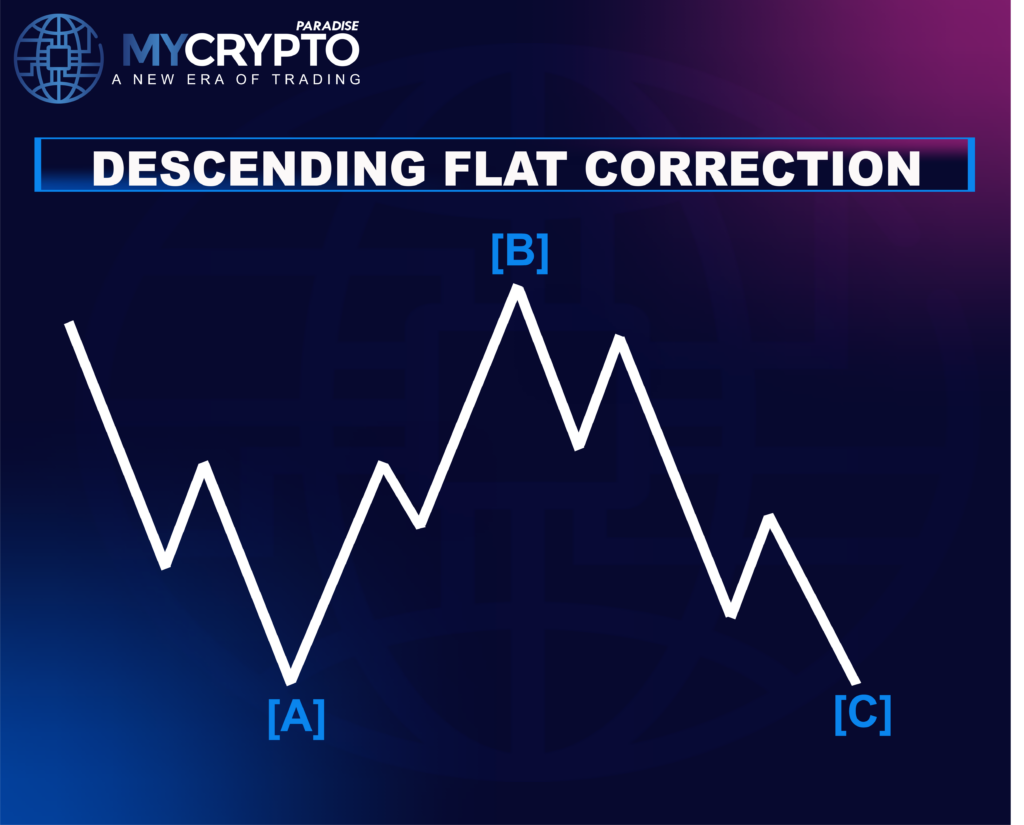
How Waves Behave in a Descending Flat Correction?
- Wave A: The first wave of the Flat moves upward in a corrective manner, forming a temporary retracement against the downtrend. This is a weak bullish reaction to the dominant bearish trend.
- Wave B: Wave B then moves downward, often retracing close to 100% of Wave A. In some cases, it may extend beyond Wave A, indicating bearish strength.
- Wave C: The final wave of the pattern is a motive wave that pushes downward, resuming the overall downtrend. Wave C can be equal to or extend beyond Wave B, leading to a continuation of the bearish trend.
Since descending Flats typically appear in corrective phases of larger downtrends, they provide traders with valuable insights into potential trend continuation zones. Recognizing this pattern allows traders to anticipate breakouts or trend acceleration points after the correction completes.
Guidelines for Identifying a Flat
A Flat correction is a sideways corrective pattern that often appears during market consolidations. Unlike the zigzag, which tends to be a deeper retracement, a Flat correction maintains a more balanced structure, where price action moves horizontally before resuming the primary trend.
Key Characteristics of a Flat Correction
- Sideways Movement: The Flat correction does not create significant directional movement. Instead, it develops horizontally, reflecting temporary indecision in the market.
- Common in Consolidation Phases: This pattern frequently forms after strong impulsive moves, allowing the market to stabilize before the next major trend move.
- Three-Wave Structure with Relative Balance: The A and B waves tend to be similar in length, reinforcing the Flat’s equilibrium-like nature before Wave C completes the pattern.
Understanding these characteristics helps traders differentiate a Flat from other corrective patterns and anticipate potential breakout zones once the correction concludes.
Next, let’s break down the three main types of Flat corrections and how they influence market behavior.
Types of Flat Correction
Flat corrections are not all the same, depending on the relationship between Waves A, B, and C, they can be classified into three different types: Regular Flat, Expanded Flat, and Running Flat. Understanding these variations helps traders anticipate the strength of the correction and the potential outcome of price movements.
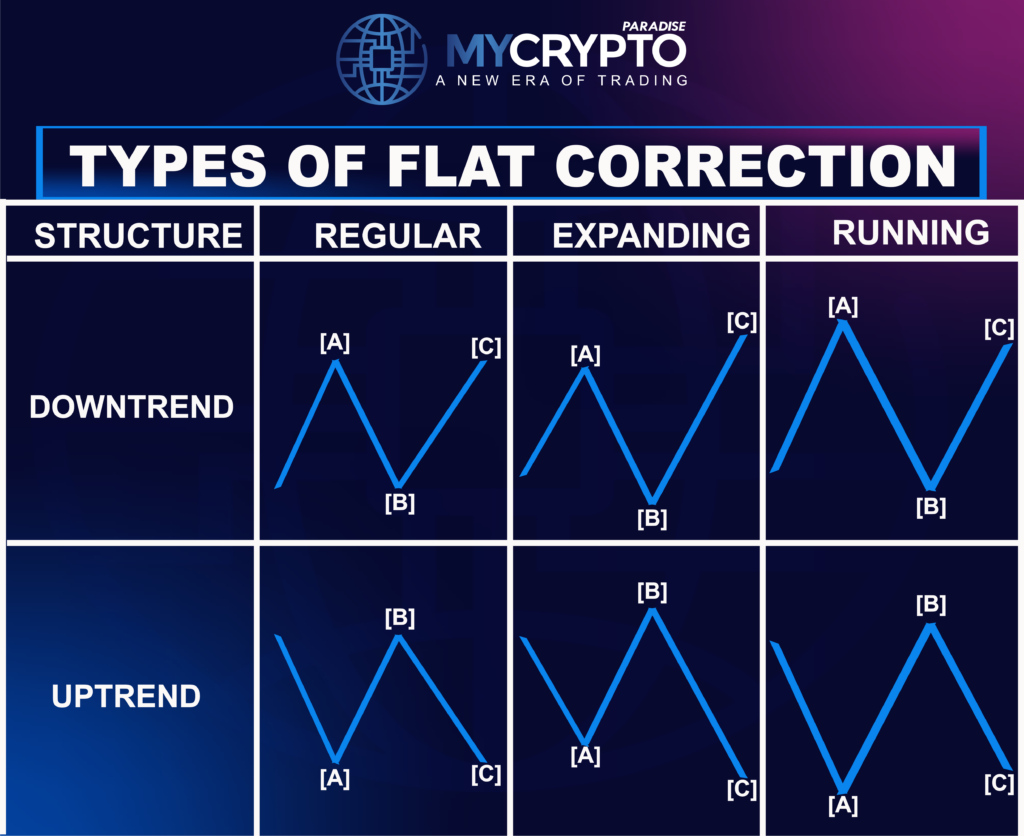
Regular Flat Correction
A Regular Flat is the most balanced form of a Flat correction, where the three waves, A, B, and C, are approximately equal in length. This pattern maintains a sideways structure, indicating that neither buyers nor sellers have significant control.
- Wave B retraces close to 100% of Wave A.
- Wave C is nearly equal to Wave A, forming a well-proportioned correction.
- This type of Flat suggests market indecision before the price resumes its primary trend.
Expanded Flat Correction
An Expanded Flat occurs when Wave B extends beyond the starting point of Wave A, and Wave C moves beyond Wave B. This formation reflects increased volatility due to a stronger battle between buyers and sellers.
- Wave B exceeds the starting level of Wave A, creating an “overextended” retracement.
- Wave C pushes beyond Wave B, creating a more aggressive move.
- Expanded Flats typically signal strong momentum shifts and often lead to a continuation of the previous trend.
Running Flat Correction
A Running Flat is an unusual variation where Wave B extends beyond Wave A, but Wave C fails to surpass Wave B. This structure suggests strong trend continuation pressure, often indicating that the existing trend is too dominant for the correction to make a significant impact.
- Wave B extends beyond Wave A, showing strong countertrend momentum.
- Wave C is weaker and does not exceed Wave B, meaning the market resumes its trend earlier than in other Flat patterns.
- Running Flats suggests that the trend is strong, and the correction is shallow, leading to a rapid continuation of the previous move.
Each type of Flat correction gives traders valuable insight into market sentiment and potential breakout points. Recognizing these patterns early can help traders prepare for continuation or reversal scenarios.
Next, we’ll compare the Flat correction with the Zigzag to highlight their key differences.
Zigzag vs. Flat Correction
While both Zigzags and Flat corrections are three-wave corrective patterns in Elliott Wave Theory, they have distinct characteristics that traders must recognize to adapt their strategies accordingly.
Wave A: Motive vs. Corrective
In a Zigzag correction, Wave A is a motive wave, meaning it moves with strong momentum in the direction of the correction. This gives Zigzags their steep, impulsive structure.
In a Flat correction, Wave A is corrective, meaning it lacks strong directional movement and often appears sideways and choppy.
Structure and Price Action
Zigzags are steep and directional. They resemble sharp retracements and typically indicate strong market corrections before the trend resumes.
Flats move sideways. They show price consolidation rather than a sharp move, suggesting the market is temporarily undecided.
Wave B Characteristics
In a Zigzag, Wave B is typically short, usually retracing only 38% to 79% of Wave A. This indicates a weak countertrend move.
In a Flat, Wave B is usually equal to or longer than Wave A, often reaching 100% or more, showing stronger price resistance before Wave C completes the correction.
Market Context
Zigzags often appear in fast-moving markets, such as corrections after strong impulse waves.
Flats usually form in range-bound conditions, where price consolidates before continuing in the dominant trend.
Trading Implications
Recognizing whether a correction is a Zigzag or a Flat helps traders anticipate its depth and potential reversal points. Zigzags typically lead to stronger breakouts, while Flats indicate a more gradual price continuation.
How to Trade Flat Correction?
Flat corrections provide valuable trading opportunities when identified correctly. Since they move sideways rather than sharply trending, traders can anticipate breakouts and adjust their strategies accordingly. Here’s how to approach trading a Flat correction effectively.
Identify the Flat Structure
- Confirm the presence of three waves labeled A, B, and C.
- Check if Wave B retraces at least 90% of Wave A, ensuring it’s a Flat and not a Zigzag.
- Look for sideways price action, as Flats don’t have strong directional movement.
Wait for Wave C Completion
- Wave C is the most tradeable wave in a Flat correction.
- In a Regular Flat, Wave C often reaches the same level as Wave A.
- In an Expanded Flat, Wave C extends beyond Wave A, offering a potential false breakout before reversing.
- In a Running Flat, Wave C may fail to exceed Wave B, indicating a strong trend continuation.
Use Technical Indicators for Confirmation
- Fibonacci retracement levels: Wave B should extend near the 100% level of Wave A, while Wave C may reach 1.0x or 1.618x of Wave A in an Expanded Flat.
- RSI and Stochastic Oscillator: Look for overbought or oversold conditions when Wave C completes.
- Divergence on MACD or RSI: If price action forms higher highs or lower lows while indicators show the opposite, a reversal may be near.
Trade Entry and Stop-Loss Placement
- Aggressive entry: Enter near the end of Wave C when signs of reversal appear, such as candlestick patterns (e.g., pin bars, engulfing candles).
- Conservative entry: Wait for a breakout from the flat structure, confirming the trend’s continuation.
- If going long, place a stop below the lowest point of Wave C.
- If going short, place a stop above the highest point of Wave C.
- Target previous trend highs/lows or Fibonacci extension levels (1.618x of Wave A).
- If trading the breakout, set trailing stops to lock in profits as momentum builds.
Trading the Flat Correction can be challenging. Our ParadiseFamilyVIP 🎖️ offers real-time setups, expert insights, and a supportive community to guide you. Whether you’re just starting or looking to refine your skills, we’re here to help you trade with confidence. Join us today!!
Flat Correction FAQ
What is a Flat correction in Elliott Wave Theory?
It is a three-wave corrective pattern labeled A-B-C that develops sideways rather than sharply. Waves A and B are corrective and Wave C is motive, signaling market consolidation before the next move.
How does a Flat correction differ from a Zigzag?
A Zigzag produces sharp, deep retracements, while a Flat moves horizontally with more balanced waves. In a Flat, Wave B retraces close to 100% of Wave A, keeping the structure sideways.
What are the three types of Flat correction?
The three types are the Regular Flat, the Expanded Flat, and the Running Flat. They are classified by the relationship between Waves A, B, and C, which signals the relative strength of the correction.
What does a Flat correction signal for traders?
It signals temporary equilibrium and consolidation, often appearing after a strong impulsive move. Depending on the larger trend, it can mark a continuation or reversal zone, helping traders plan entries and manage risk.
Crypto trading involves substantial risk of loss. This article is educational and is not financial advice. Past performance does not guarantee future results. Always do your own research.
What is different here
Most guides stop at the theory. The MyCryptoParadise team shares the live trades, and the reasoning behind each one, inside ParadiseFamilyVIP. Everything here is education, not financial advice.
Elliott Wave Correction is one of the layers the MyCryptoParadise team reads before building a setup. The trades, and the reasoning behind them, are shared inside ParadiseFamilyVIP.