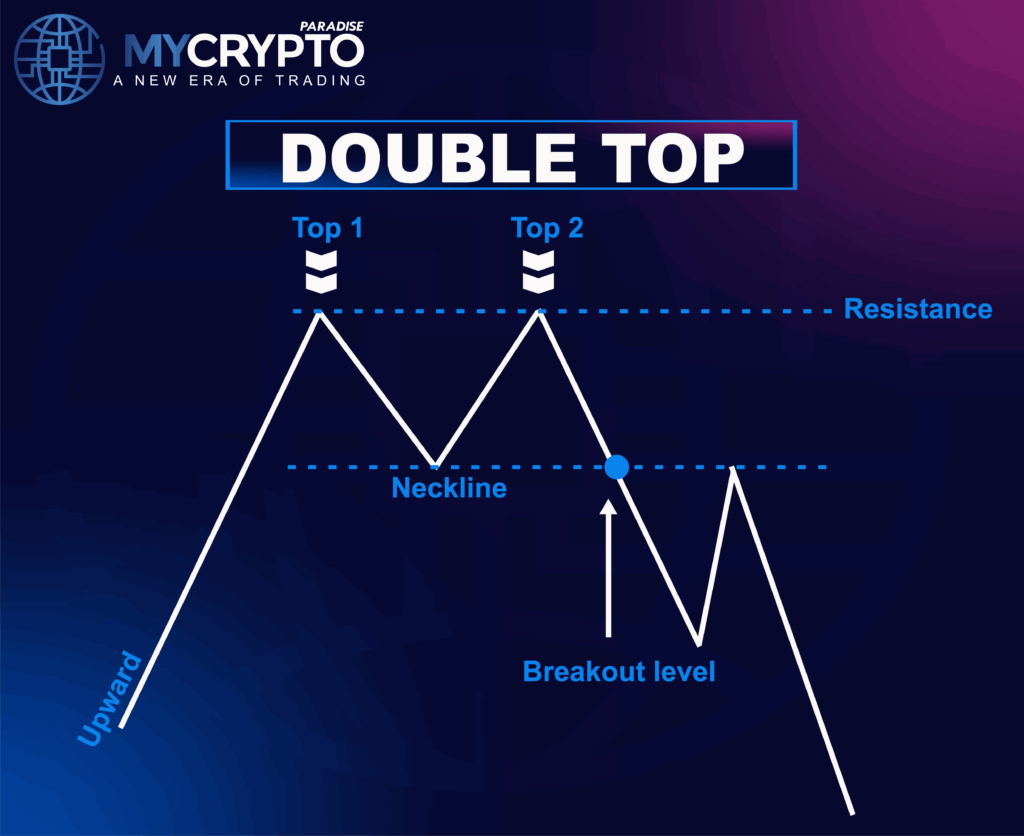
- The Double Top pattern is a two-peak bearish reversal structure that forms after an uptrend, with the neckline acting as critical support whose break confirms the shift in trend.
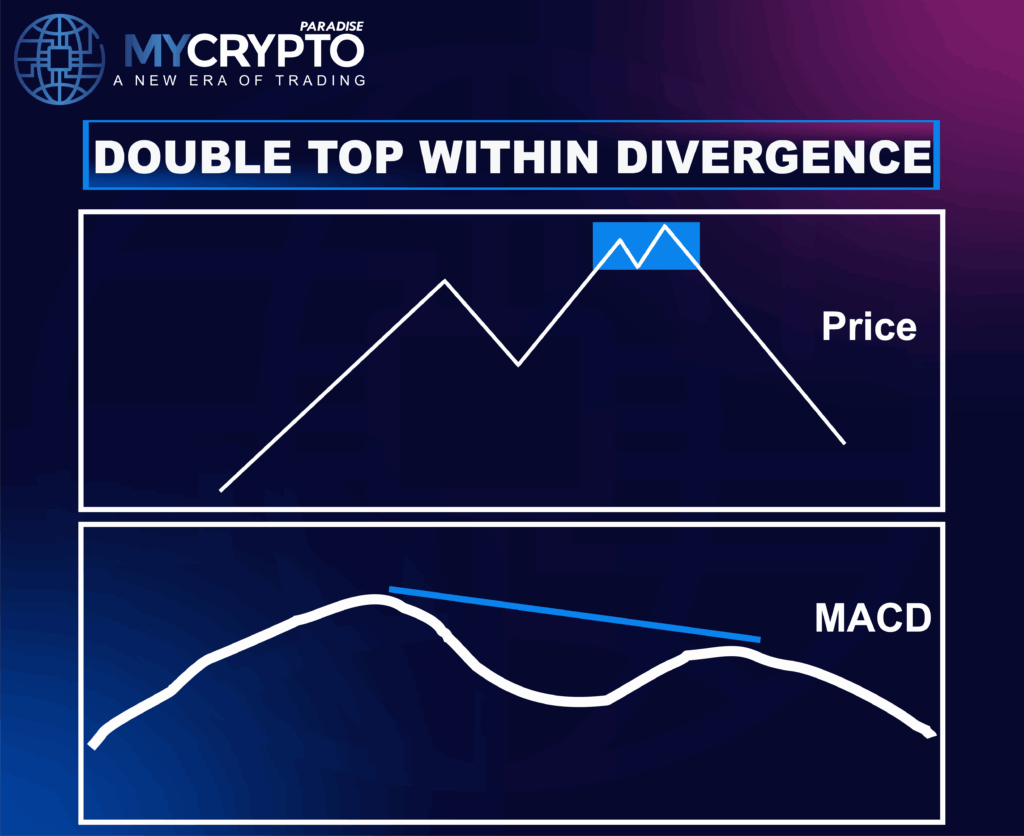
- A valid Double Top requires near-equal highs separated by a pullback, often paired with lower volume or momentum divergence on the second peak to signal weakening bullish strength.
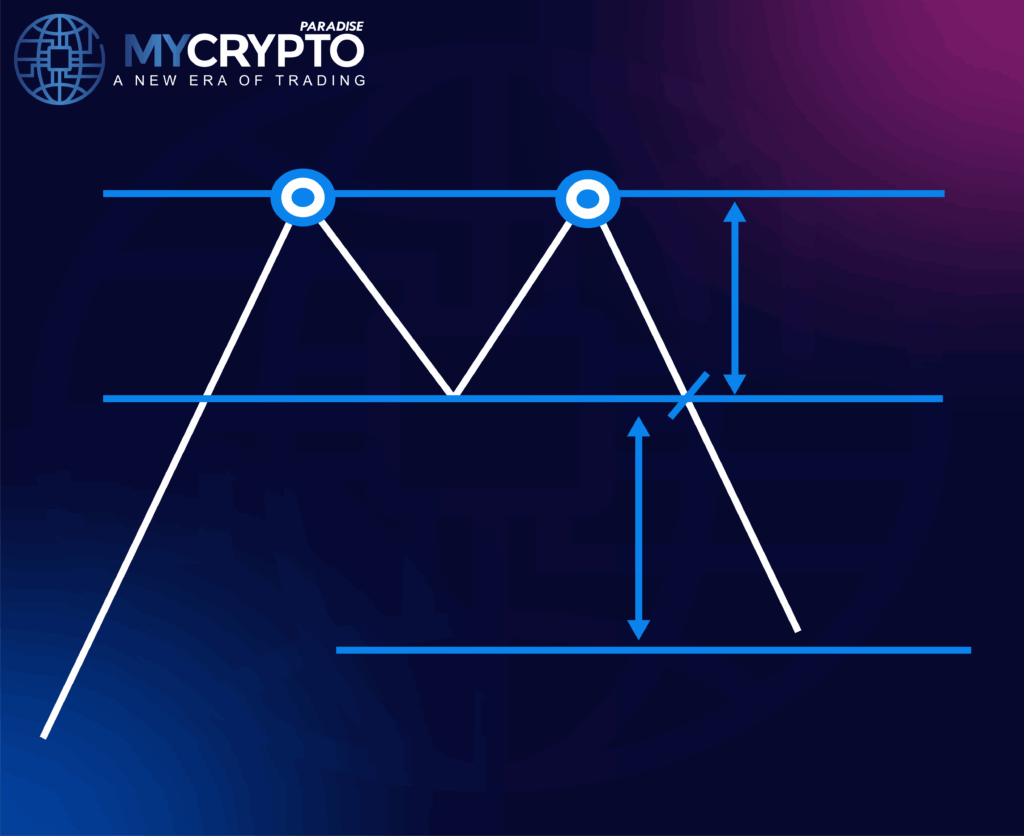
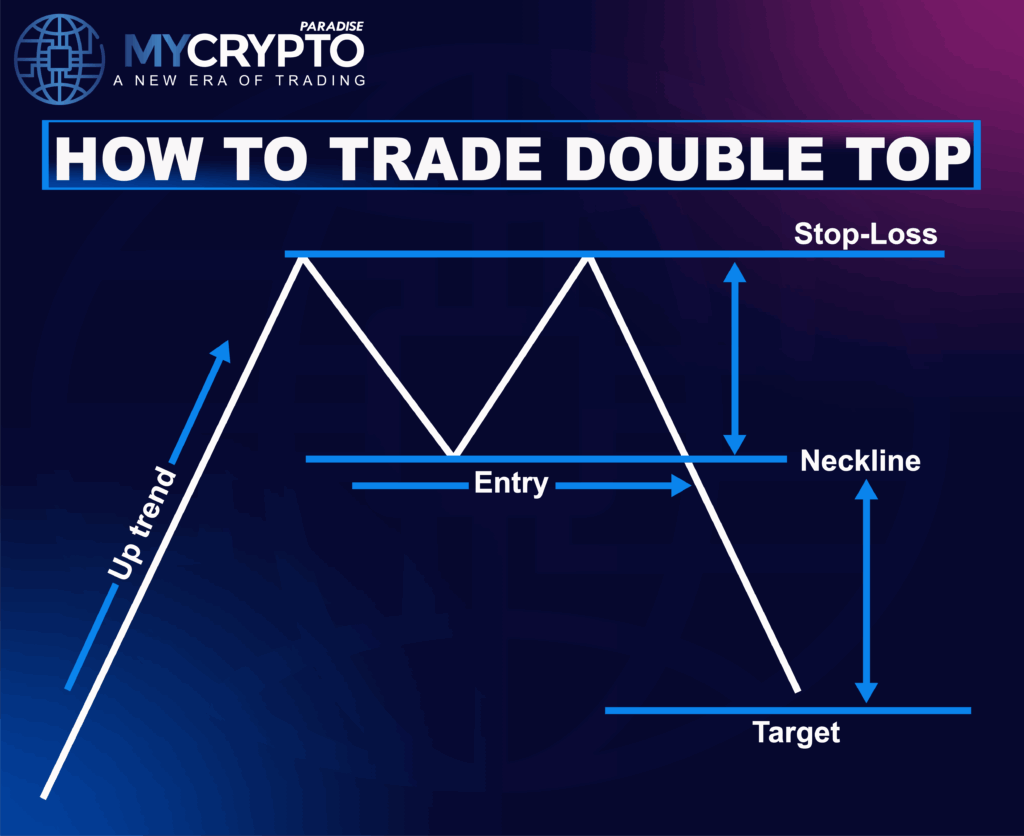
- Once confirmed, the measured move target equals the vertical distance from peak to neckline, with stops placed above the second peak to manage risk effectively.
A Double Top pattern is a classic bearish reversal pattern in crypto trading, often marking the transition from bullish strength to bearish momentum. It typically forms after a strong uptrend and is defined by its distinctive shape, two nearly equal peaks.
In this guide, we’ll break down what the double top looks like, why it forms, how to confirm it, and when to act.
What Is a Double Top Pattern and Why Does It Matter?
The Double Top pattern is a bearish reversal setup that forms after an extended uptrend. It reflects one core idea: buyers are running out of strength. In crypto, where volatility and hype drive quick rallies, this pattern helps you catch a potential top before the market turns.
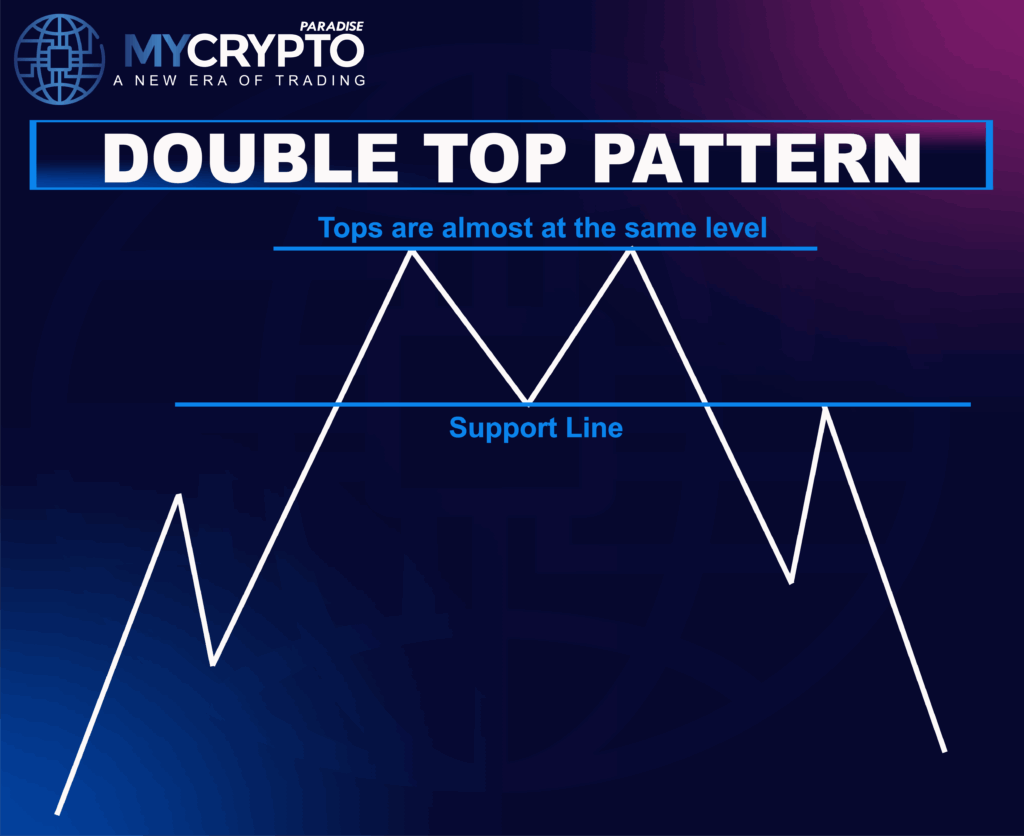
Structurally, it forms when price pushes into a high, pulls back, and then fails to break that high on a second attempt. The pattern completes once the price breaks down through the neckline, a horizontal support zone between the two peaks.
Key Characteristics:
- Appears after bullish trends
- Looks like the letter “M”
- The second peak shows fading momentum
- Break of the neckline confirms the signal for a bearish shift
Structure of a Double Top Pattern
The Double Top pattern unfolds in a clear sequence and revolves around three core zones: two peaks and a neckline. Understanding how each part forms gives you the edge in spotting reversals early, especially in fast-moving crypto markets.
Step-by-Step Breakdown of a Bearish Reversal Pattern
First Top
The pattern begins with a strong bullish impulse, often with expanding volume and large-bodied candles. This leg creates the initial high (Top 1), marking a resistance level that will later define the reversal zone.
The first top is a continuation leg that ends once momentum begins to decelerate, often visible through:
- Long upper wicks
- Fading volume at the top
- Overbought RSI (above 70)
- Failed candle closures above the key swing level
This peak is not yet a reversal, but it sets the cap.
Pullback
After rejecting the first high, the price retraces, usually in a controlled manner, forming a trough or pivot low. This becomes the neckline of the pattern.
The neckline isn’t just a visual divider; it’s a structural support that defines whether the uptrend still has legs. It typically aligns with:
- Local demand zones
- Previous breakout levels
- Midpoints of recent impulsive candles
Volume usually fades here, signaling uncertainty and a pause, not panic.
Second Top
The second top is the most telling part of the pattern. Price rallies again, often off a clean neckline bounce, but this move fails to exceed or decisively close above the first top.
Despite the similar height, this leg lacks confirmation. Key signs include:
- Lower volume than the first top
- Momentum divergence on RSI, MACD, or OBV
- Smaller candle bodies or rejection wicks at resistance
It creates the appearance of strength, but underneath, it’s a failure of trend continuation.
Neckline
After the second rejection, the price descends again toward the neckline. This is where many crypto traders misread the move, assuming it’s another bounce zone.
Technically, this is a confirmation-based leg:
- The move often accelerates on higher volume
- Consolidation just above the neckline can signal pressure building
- If the neckline breaks without volume, expect a fakeout
Real breakdowns usually occur with a clean candle close below the neckline, often followed by a brief retest from underneath.
Breakdown: Structural Confirmation of Reversal
The final leg is a decisive close below the neckline, ideally on increasing sell volume. This confirms the Double Top as active and opens the door for a measured move to the downside.
Technical expectations at this point:
- Target = height from top to neckline, projected downward
- Stop loss = above the second peak (invalidates the pattern)
- Breakdown = ideally with a wide-range candle + volume spike
In most cases, the measured move completes quickly.
What Does the Double Top Pattern Indicate?
The Double Top pattern reflects a critical shift in market behavior. It forms when price fails to break through the same resistance level twice, creating two peaks of similar height. This repeated rejection signals that bullish momentum is slowing and that buyers are struggling to maintain control.
When the second peak falls short of establishing a new high, it often indicates buyer exhaustion and the early presence of distribution. Momentum begins to fade, and the balance of power starts to tilt toward the sellers.
The key confirmation occurs when the price breaks below the neckline, the support level between the two tops. This breakdown transforms the pattern from a potential setup into a confirmed bearish reversal, suggesting that the prior uptrend has likely concluded.
How to Trade the Double Top Pattern
Entry Strategy
In a valid Double Top, the second peak forms after a pullback off the first top and often rallies back into the same resistance zone. But this second push lacks strength, usually printing with lower volume and showing signs of momentum divergence on RSI or MACD.
The ideal entry comes after the price breaks below the neckline, the support level formed between the two tops. A clean candle close below this line, especially with an increase in volume, signals that buyers have lost control and sellers are stepping in. This breakdown confirms the pattern and activates the trade.
Exit Strategy
Just as important as entry is knowing where your trade is invalidated and where your targets lie. For a Double Top, the stop-loss is placed just above the second peak, which represents the last level where a bullish structure could still hold. If price breaks back above this zone and holds, the pattern is invalidated.
To set a target, measure the height from the top to the neckline, and then project that same distance downward from the point of breakdown. This gives you a measured move and a logical profit target that reflects the pattern’s structure. For example, if a coin tops out at $1.00 and the neckline is at $0.90, the target would be near $0.80.
At ParadiseFamilyVIP 🎖️, we guide our traders through Double Top setups with real-time structure confirmation, breakdown alerts, and exit management, because the difference between spotting a pattern and trading it well is execution. 👉 Check availability here (Click it)
Common Mistakes to Avoid When Trading the Double Top Reversal Pattern
The Double Top is one of the clearest bearish reversal setups in technical trading, but even when the pattern is correct, poor execution can ruin the trade. These are the most common mistakes crypto traders make, and how to avoid them in real market conditions.
Misreading the Structure
Not every pair of highs qualifies as a Double Top. A valid pattern requires two distinct, near-equal peaks with a visible pullback in between, forming a neckline. If the second top is significantly higher or there’s no clear trend before it, the setup lacks integrity.
This mistake often comes from rushing to spot patterns instead of waiting for real symmetry. Always check the bigger picture before acting.
Entering Without Reversal Confirmation
One of the most costly mistakes is entering too early, usually before the neckline is broken. Without that break, the pattern is incomplete, and what looks like a Double Top might just be a bullish consolidation.
The neckline break is the shift in control. Wait for it. The extra candle of confirmation is worth avoiding a full invalidation.
Placing Stop Losses Too Tight
In crypto, where volatility and wicks are common, placing your stop right at the second peak often leads to premature exits. Price may briefly sweep that high before rolling over.
Instead, set your stop just above the second top, allowing for volatility buffers like ATR or recent swing wicks. A stop that respects structure improves your overall win rate.
FAQs
What is the Double Top Pattern in crypto trading?
The Double Top is a bearish reversal pattern that forms after an extended uptrend has occurred. It consists of two price peaks at similar levels, separated by a trough, and signals that bullish momentum is weakening. Once the price breaks the neckline, it often triggers a shift toward a downtrend.
Why is the Double Top pattern important for crypto traders?
It helps traders spot potential market tops and exit long positions before breakdowns occur. The structure is easy to recognize, offers clear invalidation levels, and provides short-selling opportunities with defined risk, making it a go-to pattern for reversal-based setups.
How do I know if a Double Top setup is valid?
A valid Double Top includes two near-equal highs, a clear neckline (support), and forms after a well-defined uptrend. The pattern becomes tradable only after the neckline is broken with a candle close and, ideally, increased volume.
Can a Double Top pattern be combined with other indicators?
Combining the pattern with bearish RSI divergence, a MACD crossover, or a moving average rejection (such as the 50 EMA) adds extra confirmation. These indicators help strengthen the case for a reversal and reduce the chances of entering on a false signal.
Can a Double Top form on any timeframe?
Double Tops can appear on any timeframe ranging from 5-minute charts to weekly candles, but their reliability increases with higher timeframes, such as the 4H, Daily, or Weekly.
Conclusion
The Double Top pattern gives crypto traders a reliable edge in spotting trend exhaustion before the market turns. With its defined structure, two peaks, one neckline, and a clean breakdown, it cuts through noise and brings clarity when the charts get emotional.
But like any pattern, success comes down to execution. That means waiting for confirmation, placing smart stops, and aligning with volume and momentum. Patterns don’t trade themselves; discipline does.
That’s exactly what we deliver inside ParadiseFamilyVIP 🎖️. Our team applies proven setups like the Double Top pattern, backed by on-chain data, sentiment analysis, and whale tracking, to deliver elite crypto signals with real-time entry, exit, and portfolio management support.
Ready to trade with more structure and confidence?
👉 Check availability for ParadiseFamilyVIP 🎖️(Click it)
If spots are full, join the waitlist to reserve your place in the next opening.
New to structured trading? Our free Telegram channels are the perfect place to learn, grow, and connect with a serious community of traders.