

In short: Simon and the ParadiseTeam stay short-term bearish on Bitcoin after a bearish MACD cross and a break below the ascending trend line. He sees the fifth wave up likely complete near $65,000, expects a move down. And marks the $60,000 to $59,000 zone as his preferred high-probability buy on confirmation.
Is Bitcoin about to crash to $60,000?
Not guaranteed, but Simon leans that way short term. Bitcoin has broken below the ascending trend line and printed a bearish MACD cross. So the ParadiseTeam sees the next big move pointing down toward the $60,000 to $59,000 zone.
He stresses this needs confirmation. Price sits squeezed between support and resistance, so patience matters before acting. Simon frames $57,000 as a low-probability extreme, held up by strong support below.
Why is the fifth wave up likely finished?
On the weekly, Simon reads Bitcoin in the final fifth wave, with a possible push toward $79,000 later before a rejection. On the daily, he counts an A-B-C structure where the C wave is now forming.
The recent five moves up look complete near $65,000, exactly the lower boundary of his resistance zone. That raises the odds of a pullback. A move to $67,000 or $69,000 stays possible but low probability while price holds below the trend line.
What key Bitcoin levels is Simon watching?
Simon marks tight levels. Immediate support sits at $63,600 and the ascending trend line acts as resistance near $64,700, leaving price squeezed in between.
Above, $65,000 still acts as resistance, with another confluence at $66,450 and targets at $67,000 and $69,000. Below, his preferred buy zone is $60,000 to $59,000. More level-by-level reads sit in the Bitcoin analysis hub.
What do funding and liquidations show?
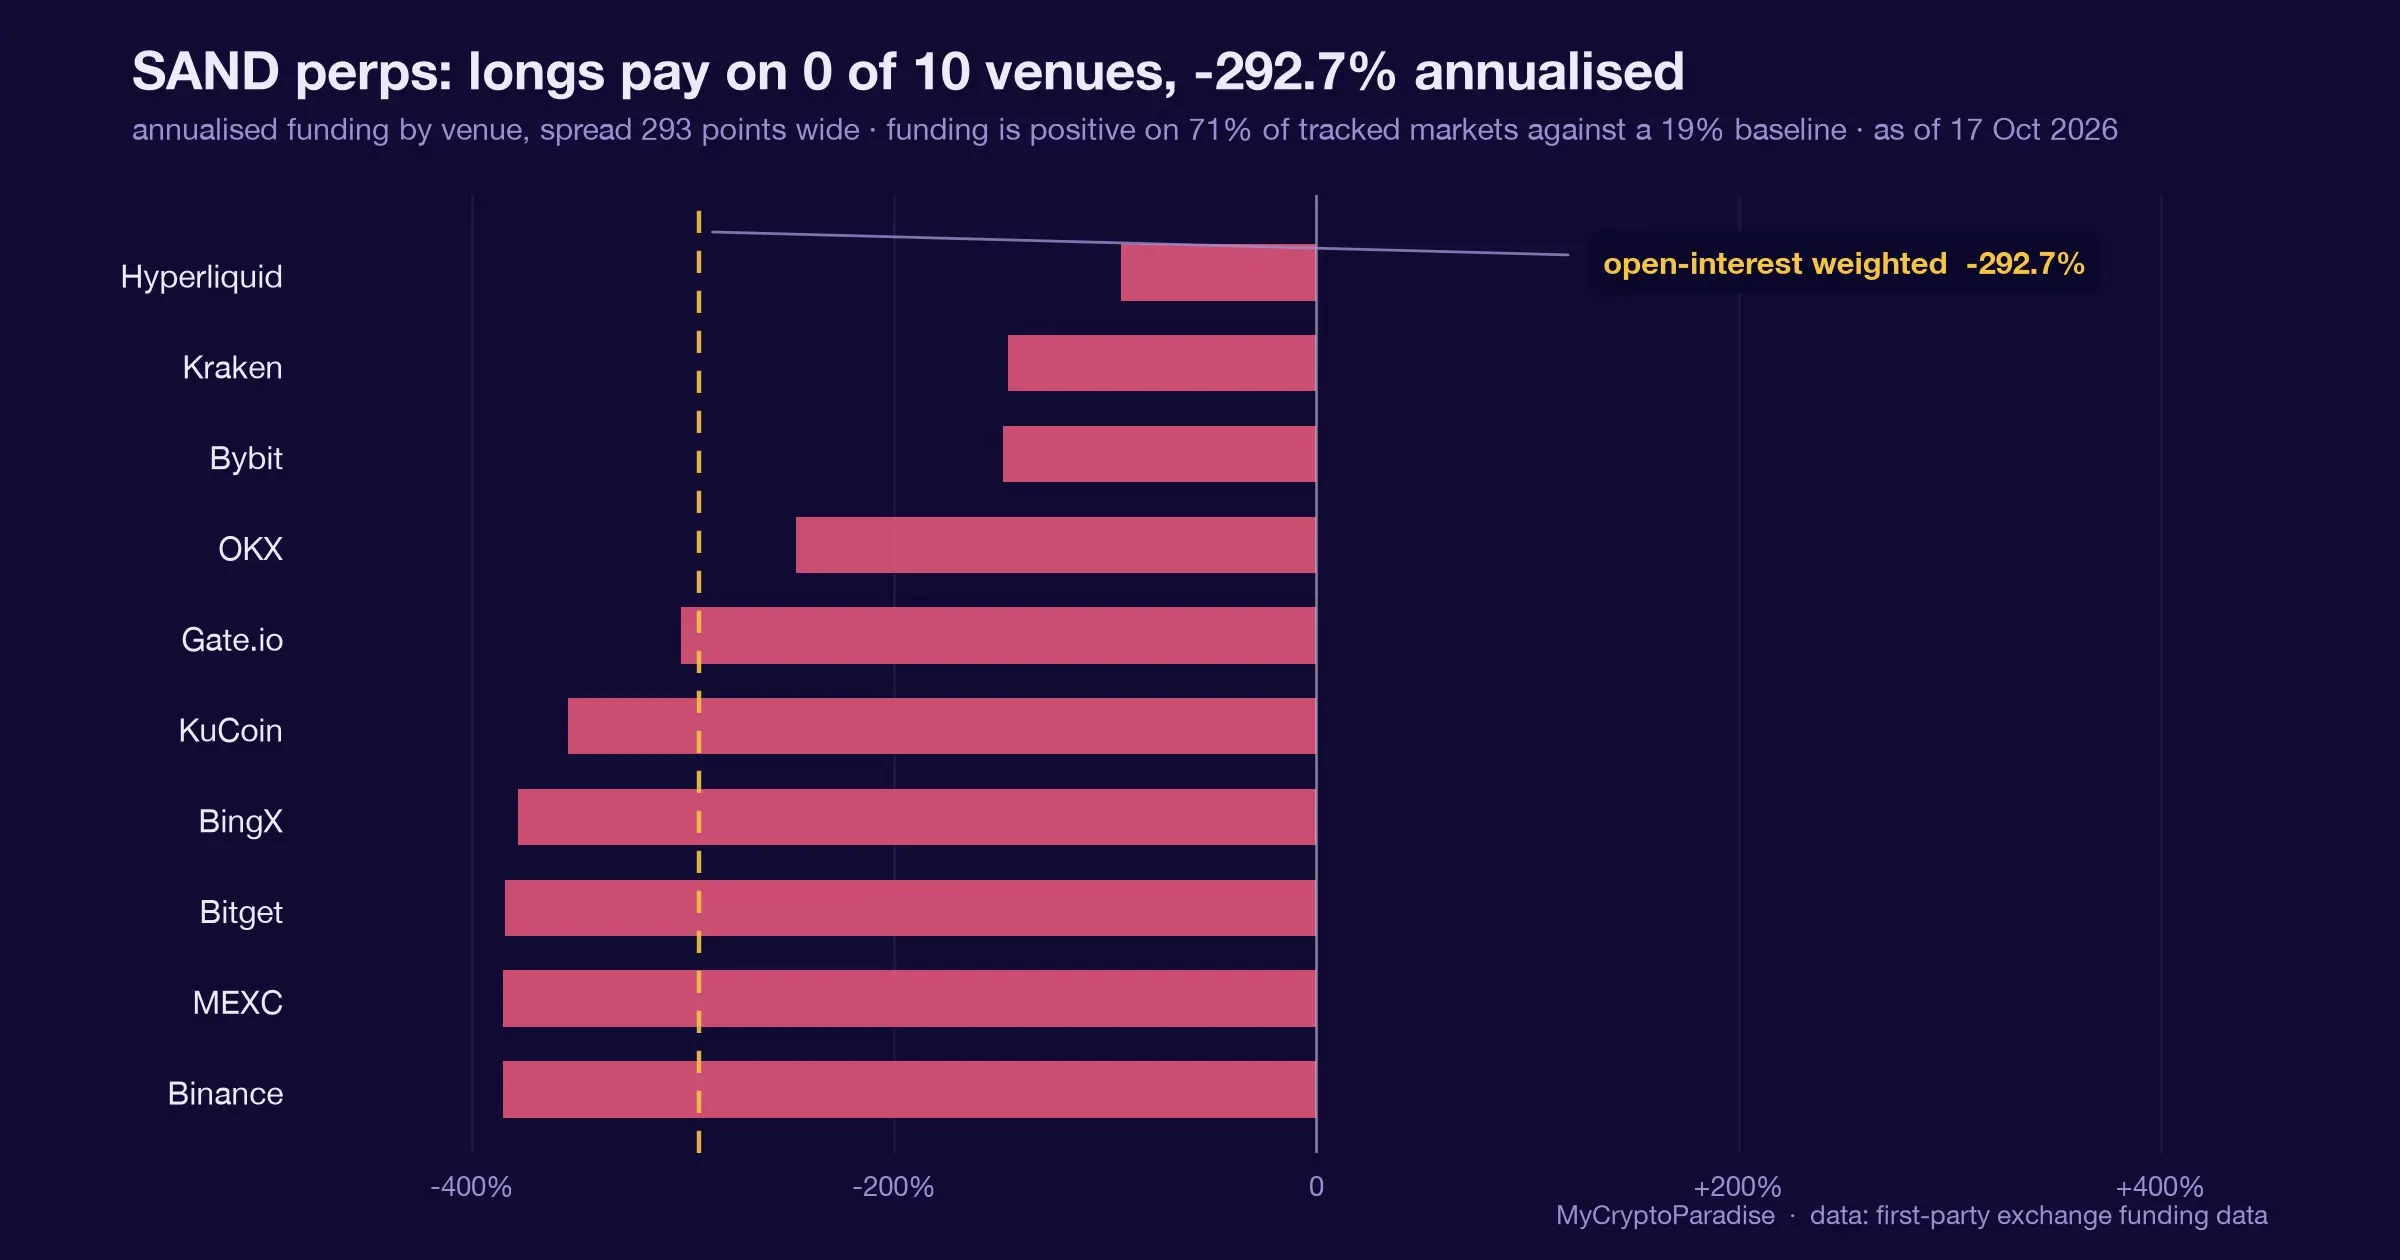
Positioning looks crowded long. Simon notes 81% of market funding is positive and funding rates are heating up, though still mild for thin summer liquidity. The crypto funding rates board tracks this in real time.
On the 30-day view an imbalance remains. A push down toward $59,000 would liquidate around $6 billion in longs, versus roughly $3 billion of shorts on the upside. Fear and greed reads neutral, and the squeeze probability sits near 16%, already warm.
Why is a long position a no-go right now?
Because the odds and the math both point against it. With the five-wave move up likely done and price under strong resistance, Simon calls a long here a no-go on risk-reward grounds.
A long entry would need a stop below the low, and the first target near $65,000 offers thin reward. He would rather wait for the $60,000 to $59,000 zone. This guide on position sizing and capital preservation mirrors that discipline.
Frequently asked questions
Is Bitcoin going to crash to $60,000?
Simon sees the next big move likely pointing down, with the $60,000 to $59,000 zone as his target and preferred buy area. He calls $57,000 a low-probability extreme because strong support sits below. He stresses this is short-term and needs confirmation before he would act on it.
Where does Simon want to buy Bitcoin?
His preferred high-probability entry is the $60,000 to $59,000 zone, and only on confirmation. He points to multiple confluences there and better risk-reward than chasing a long near current price. Until price reaches that area or reclaims key levels, he favors patience over forcing a trade.
What does the bearish MACD cross mean here?
The bearish MACD cross, alongside a bearish RSI cross and declining bullish volume, signals fading upside momentum to Simon. He reads it as the bulls getting weaker as price pushes higher. A confirmed continuation lower on the RSI trend line would reinforce his short-term bearish view.
What are the key Bitcoin levels in this video?
Simon watches immediate support at $63,600 and trend-line resistance near $64,700, with price squeezed between them. Above sit $65,000, $66,450, $67,000 and $69,000. Below, his buy zone is $60,000 to $59,000, and he views $57,000 as an unlikely extreme for this move.
Should I open a long position on Bitcoin now?
Simon calls a long here a no-go for himself on risk-reward grounds, since the five-wave move up looks complete and price sits under strong resistance. He notes every trader differs, so those with an edge and a fitting tactic may act, but he prefers waiting for confirmation.
MyCryptoParadise has run a professional crypto signals and trading-education service since 2016, led by founder Simon Mach and the ParadiseTeam. Simon records these sessions three times a week, and every episode lands on the Bitcoin video analysis hub.
Video transcript
Auto-captioned from the video audio and lightly cleaned, so it can contain transcription errors; the video itself is the record. It is speech, not a written article; for the structured breakdown read the sections above.
Bitcoin is breaking below this ascendant trend line and we have just got bearish cross on MACD. Is this [music] just a fake out or are we about to crash towards $60,000? Let's analyze the probabilities. [music] >> My cryptoiseise. >> Hello ladies and gentlemen of Paradise.
This is S from my crypto paradise. Welcome back. It's great to be here. Today is Thursday and that means that you're watching the second video of this week. So let's quickly recapitulate what we talked about in the previous video on the weekly time frame with the highest probability.
We are in the final fifth wave which will subdivide itself into five small waves and we might be right now creating the secondary one that might take us up to $79,000 before we will see another rejection. So let's take a look right now on the daily time frame how this wave might be upfolding itself.
It's a three-wave structure from which we have already created the A and B wave with the highest probability we are right now creating the Cwave. About the Cwave what we know that again it sublat itself into five small waves because it's an impulse.
And if we take a look at the structure of this sequence right here, what we can see is that we are right now creating the subwaves of the first wave. And if we calculate it, we can actually see that we have created already first wave right here, secondary right here, third wave, fourth wave right here.
Well, and right now we are waiting for the finishment of the fifth wave. So as you can see, I have fifth wave right here. But what we talked about in the previous video is that this fifth wave might take us towards $65,000, which we already hit.
we hit exactly the lower boundary of our resistance zone and the upper target might be around $67,000. So if this fifth wave wasn't finished just yet, there might be another push towards that 67. But as you can see right now, if you will start breaking above this ascendant trend line, the price action is already slowing down, right?
So, we will need to find another confluence and the another confluence will be around 1.618 Fibonacci retracement level that is sitting much higher than $67,000. So, we might go up to $69,000. All right. So, is it a high probability that we will start pushing back?
Well, from the current perspective that we are seeing right now in the market, we are not yet above the ascendant trend line and we are not back in the channel that would confirm some probabilities of going even higher. So if we take a look at the fifth wave structure, what we know about the fifth waves again it's an impulse henceforth it needs to subdivide itself into five smaller waves.
So if we take a look at the sequence on the 1 hour time frame, we can actually see that we have created already 1 2 3 4 right this was 1 2 3 4 5 aka A B CDE E because it's the corrective mode wave pattern.
So this was open triangle where you're creating higher highs and lower lows and afterwards we have created a final fifth wave of that fifth right here. So pretty much this could be a completion of the fifth wave and we just finished it at that $65,000 that we were predicting in the previous videos.
So the probabilities as you can see are actually decreasing are decreased right now that we would be going even higher given that we are below extremely strong resistance and other confluences. All right. So right now in this perspective also given that we are below the ascending trend line from the current perspective the probabilities are actually quite low that we will be going up to $69,000.
That doesn't mean that it cannot happen for sure. If we will see if we will see a nice reclaim of this ascending trend line back from resistance into a support there might be like continuation towards that 67 $69,000. However, from the current perspective, it's right now a low probability.
So, what can we see is bearish right now on the 4hour time frame? Well, first of all, we need to understand that we have already created the fivewave structure, right? So, of course, it might be just first wave of that fifth given that the third wave kind of wasn't an extended one.
So, there is also a possibility that we have created a first wave of that fifth like this. Right now we are creating a secondary wave. Then we will push with the third wave above that ascendant trend line. We will create a fourth wave and then we will push towards that 67 $69,000 and the fifth wave will finish right there.
However, right now it's a lower probability. So given that we have already finished the fivewave structure of that fifth wave with the highest probability right now looking for a long position from a swing trading perspective is not really a high probability thing to do.
Right? So not only it's a low probability that we will start pushing above this resistance but also the riskreward is not really favorable given that we are working as professional traders with multiple targets. We would need to if we would be entering we would be probably entering right here.
We will place our stop loss below this support. But since we understand that right now during the summer the liquidity is extremely thin, we would need to place it below this low at least. And if you want to be even safer, we need to confluence it with some levels, right?
So probably we would need to drag it down towards that 1.272. Well, I wouldn't if I would be entering a long position, I would just place it below the low right here with a little bit of a breathing room. So, we are also below the low that we have created on 8th of July.
And however, the first target we would need to place really right here since the $65,000 is still acting as as a resistance. So, it wasn't reclaimed right with this touch right here. Not even much weaken. So this will be still acting as a resistance.
And then we have another huge confluence right here at $66,450. Then we have another right here. But the thing is that for the first take profit target, I would need to place smart target around that $65,000. And as you can see the risk is not really favorable for that, right?
So for me it's a nogo for a long position. Really for me the long position that might be a high probability play and great riskreward as well will be if you will start touching this zone at 60 to $59,000. All right, if you will start pushing to the downside, we will liquidate over $6 to 7 billion worth of long positions that are right now piling into the market.
However, what we need to also understand is that there is no longer the imbalance that we have been seeing in the previous videos. As you can see, if you will start pushing to the upside around the same direction, the same measurement of the move, we will basically liquidate the same amount around $7 billion worth of short positions.
That means that right now there are no longer the imbalances from the longer time frame perspective. All right? And if we shift our focus on the 30-day time frame, however, there still is the imbalance. As you can see, if you will start pushing to the downside towards that $59,000, I don't believe that 57 because that would be below this support, right?
Which is having a lot of confluences and also below this low. So given that we would be predicting for this downside that it would create the secondary wave before we start pushing to the upside, liquidating the long positions that are at $57,000 would be a low probability.
It would be really hard for the bears to push below this support or right to that $57,000. So much higher probability is to liquidate this cluster as you can see. Then we have great spot of no liquidations around that 58 to $59,000. So the domino effect can stop right here.
All right. So we will liquidate around $6 billion and as you can see the same direction to the upside we will liquidate only around $3 billion. Right? So this is still a huge imbalance on the lower time frame. If we will start pushing to the downside from the current market price, we will create exactly 6.7 billion and to the upside only $3 billion.
Yes. So huge imbalance. So the probabilities also supporting the idea that we will be having the secondary wave. The next big move is going to be to the downside. Henceforth we will create the secondary wave. nice buying opportunity upon confirmations and uh because there's multiple confluences, right?
So upon confirmations that we are creating the exhale of the market before preparing ourselves for the next inhale, this would be a great probability play and also great risk reward ladies gentlemen. So from the shortened time frame perspective, I'm still I'm still bearish.
All right, on the fear and greed index, we are right now in neutral zone. But if we take a look on the funding crates, we can see that we are still heating up. All right, we are kind of warm. It's nothing crazy, but we are in the summer, right?
So don't expect some huge movements or some huge extremes on the funding craze because a lot of traders are not trading. So 16% probability of a squeeze in the past 2 months. Basically, once the probability went to around 2025, we always got a squeeze afterwards, right?
So 16% is kind of already overheated for the current market situation. So I would be definitely careful with long positions and for me a great buying opportunity would be only if we will start touching the 60 to $59,000 zone. So not much have changed ladies and gentlemen from the previous video.
Pretty much nothing. So we have been waiting in the previous video for the completion of the fifth wave. Right? Right now it seems that we have really created nicely the five moves to the upside. 1 2 3 4 and the final fifth wave.
So it's just increasing the probabilities that we will start pushing to the downside. So right now we need to understand also from the lower time frame perspective we are at support definitely lower time frame support at $63,000. Yeah, $63,600 to be absolutely exact.
And we are actually squeezed. All right, in between acting resistance of this ascendant trend line which is right here at $64,700 and the actin support at $63,600. Yeah. So right now I do believe that patience is so very important is extremely important at this moment and waiting for either reclaim of this ascendant trend line or reclaim of the support into resistance is really the smart idea to do from a swing trading
perspective. Ladies and gentlemen, in the next video we will go through the momentum indicators and and everything else. This video is just an update of the previous one. Very quick one, but you can clearly see what's going on on the RSI. We are already having a bearish cross, right?
Which is predicting what might happen on the moving average on the price action. And right now, we are just testing if it's going to hold as a resistance. If it does and will start pointing to the downside, yeah, looking to the downside with this RSI trend line, it will be a confirmation of a continuation to the downside and it will kind of predict what's going to happen on the price action.
So, definitely watch out for the RSI, watch out for the momentum indicators. We might get the bearish cross on the MACD on 4hour time frame as well. The bullish volume is declining as you can see as the price action is trying to push higher and higher.
So the bulls are getting weaker. The buying pressure is getting absorbed. It was absorbed right here on the CVD. We have been watching that a lot of aggressive buying is going on right here. But on the momentum indicators, it was already visible that it's the momentum of the bulls is really decreasing as they are pushing to the upside.
So then the only option was to the downside. Definitely I wouldn't be extremely bearish on the 1 hour time frame given that the pairs are also not very strong right here and they are getting exhausted. So we are creating somewhat a bullish divergence which is not confirmed just yet.
We would need to have on the 1 hour time frame a bullish cross on the MAD histogram as well. But you can see that pretty much this is the momentum of the bears. This was the momentum on this low right here. the bears are really pushing like trying to push a lot right now on the lower time frame on the lower time frame I mean okay so multi- time frame analysis it's
really something else what's happening on the daily or or what's happening on the 1 hour time frame so I'm just talking about the 1 hour time frame the bears are really pushing a lot they are exhausting themselves but they are unable to create a lower low as they have done on the momentum yeah so really it's a patience game right Now predicting from the lower time frame perspective some high probability movement
is given that we are squeezed below this resistance and above this immediate support is kind of gambling I would say. So confirmations always win waiting for a proper setup that always wins for a long-term profitability. So really right now the support needs to become a resistance for confirmation that we will start pushing lower towards the next medium time frame support at this this zone 60 to $59,000.
And the same likewise for this ascendant trend line. We need to change it from the acting resistance right now into support to have some increasement of probabilities that we might be pushing above this resistance. But given that we can see how many on the funding crates, we can see clearly how many people are already uh like in a long position, right?
We can see that the long positions are paying shorts. We can see the funding crates are really much more aggressive. We can actually see exactly 81% right now of the market funding is positive. Yeah. So a lot of people are believing that we will start we will continue to go higher which is making the downside vulnerable right.
So there might be the domino effect created where we will start squeezing those long positions. I would be definitely careful about some aggressive high leverage long positions ladies gentlemen but again it's about your trading tactic right some people might be entering long position right here might be within their trading tactic it's all about making sure that you are playing with a strategy that in your own system is having an edge just
follow it over and over again with discipline follow your trading system with discipline if you believe that you have an edge on a trading setup based on your trading strategy, go for it. If you find a great trading tactic how to get into the position where you will get out of the position that gives you a great risk reward, go for it.
Right? So, every trader is absolutely different. Every trader has a different personality. always you should be making sure that you are playing with such trading tactic that is suitable to your personality in order for you to be able to follow it with discipline over the long period of time.
Right? So it's always it's it's the same thing as they say that you should be doing in life what you love. Right? If you want to be successful in something, you need to do what you love because if you do something what you hate, you will not be consistent.
You will not be able to do it in the good times and in the bad times. Right? as well. You will quit sooner or later, right? The bad times come and you will quit. You will quit because you don't love it. But if you love it and it suits your personality, that means it's easy for you to follow it with discipline over and over again, you will stick with it during the
good times and during the bad times as well. So it's extremely important that as a professional trader, as a professional traders, we always trade with this kind of trading strategy that seeds our personality, right? Because that will help us to stick with it.
All right? Find your edge. Create a trading tactic around it and stick with it. I wish you great success, ladies and gentlemen, and I'll see you again on Saturday. Cheers. Calm breath, [music] clear eyes. Work done now. Right. No rush, no drag. [music] Right time, full snap.
Clean set up. Clean click. Execute like [music and singing] a pro. That's it. M clean set
Educational content, not financial advice. Crypto trading carries substantial risk; you can lose your capital. Past performance does not guarantee future results.











Join the discussion
No comments yet. Members, share how you are reading this.