- The bearish flag is a classic continuation pattern in crypto trading that reflects a temporary pause within an established downtrend. Its structure consists of a sharp decline, a counter-trend consolidation, and a volume-backed breakdown.
- Watching volume is key: during the consolidation (FLAG), it usually quiets down, then jumps when the price breaks lower.
- It works best in a clear, strong downtrend and when the larger timeframe aligns with the move. It fails if the price pushes above the flag or strong buying enters, so paying attention to the broader market context is important.
The bearish flag pattern is one of the high-probability continuation chart patterns in crypto markets, yet very few traders truly understand or trade it effectively. This often happens because of behavioral biases and emotional blocks that prevent traders from acting against short-term pullbacks within a strong downtrend.
This pattern works best in strongly trending environments, where momentum and liquidity expansion drive clear directional moves. In such conditions, the temporary consolidation phase represents a pause in selling pressure before the trend resumes, offering traders a structured and strategic breakdown opportunity.
At MCP University FREE, this guide is part of our precision-trading series developed for disciplined, structure-focused crypto traders. After reading the full article, you will be able to identify, confirm, and trade the bearish flag pattern with expert accuracy and confidence.
What is the Bearish Flag Pattern in Crypto Trading?
The bearish flag pattern is a continuation pattern that occurs after a strong price drop. It commonly emerges when fear, intense selling, or weakness in the crypto market is experienced.
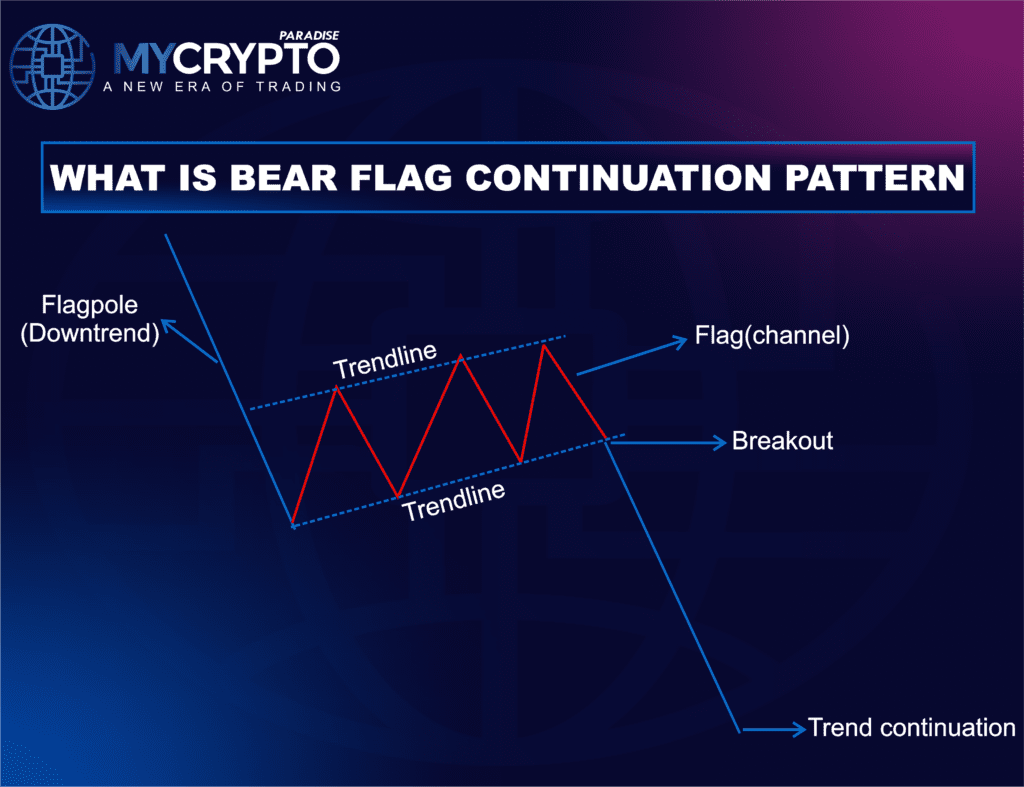
At its core, the bearish flag represents a temporary counter-trend consolidation within a dominant downtrend. Following an impulsive sell-off (the flagpole), the price enters into a corrective phase that typically slopes slightly upward or moves sideways within a tight parallel channel. This consolidation (flag) reflects short-term profit-taking and weak counter-trend buying, not genuine bullish reversal pressure.
Rather than a reversal, this pattern typically indicates that the market is merely taking a pause before continuing in the same direction. The pattern is typically confirmed when the price breaks below the lower boundary of the flag with increased volume, signaling that sellers have regained control. We have already covered the bullish flag pattern previously.
The Psychology Behind the Bearish Flag
The crypto market is highly emotional. Understanding the psychology behind the bearish flag adds depth to its interpretation. The initial sharp sell-off typically reflects aggressive institutional selling, negative news flow, or a broader risk-off environment.
As prices decline rapidly, short-term traders take profits and bargain hunters attempt to buy the dip, causing a temporary upward retracement. However, this bounce lacks conviction because the underlying sentiment remains bearish.
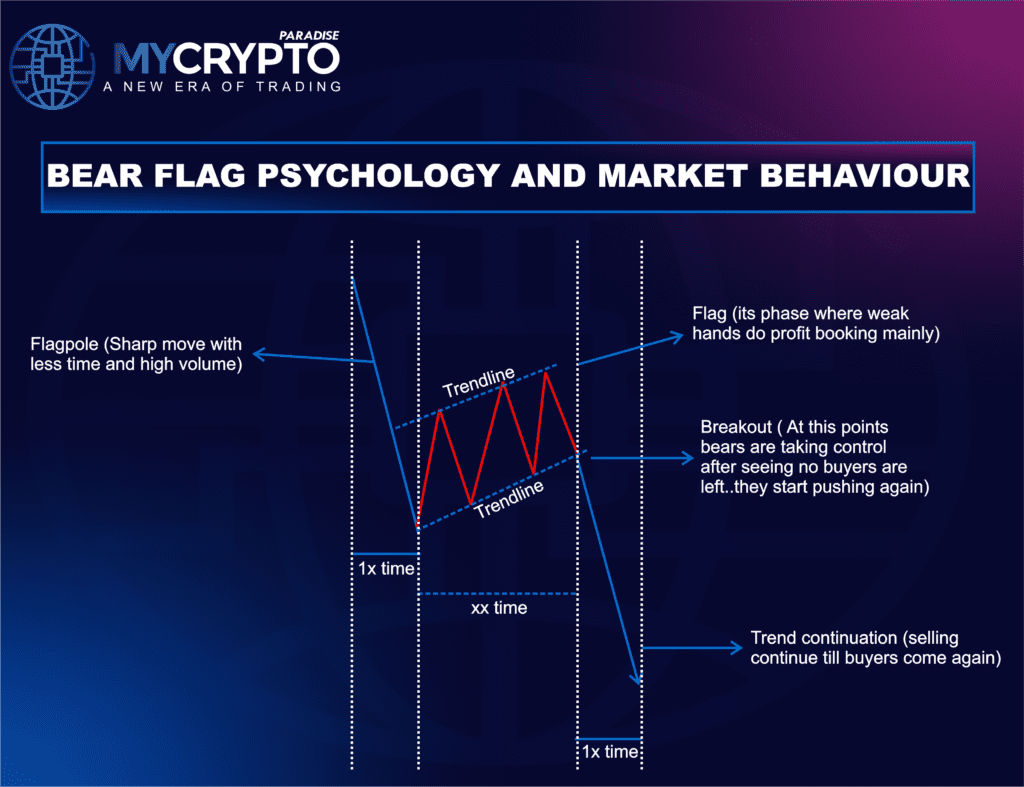
Volume usually contracts during the consolidation phase, indicating weak buying interest rather than genuine accumulation. When sellers re-enter the market and the price breaks below the lower boundary of the flag, it confirms that bears remain in control. The pattern shows a weak market where buying pressure is fading and sellers remain in control. It reflects temporary consolidation before continued downside, as supply still outweighs demand.
Bearish Flag Pattern Structure
To spot a legitimate bearish flag pattern, you have to read the structure, grasp the context, and wait for confirmation. A proper bearish flag has three structural components: 1) a strong downward impulse (flagpole), 2) a flag, and 3) a breakdown.
Flagpole:
The flagpole should show clear momentum with long bearish candlesticks and minimal overlap, with high volume.
Flag:
The consolidation that follows often slopes slightly upward or moves sideways within parallel trendlines. This counter-trend move should retrace only a modest portion of the prior decline, commonly between 38.2% and 50% on Fibonacci measurements.
If the retracement becomes too deep or structurally complex, the pattern risks evolving into a reversal rather than a continuation.
Breakdown:
The breakdown phase is confirmed when the price closes strongly below the lower boundary of the flag, ideally supported by high volume.
Types (Variations) of bearish flag pattern
The bearish flag pattern has three main types: the bearish flag, bearish pennant, and bearish wedge, but their shapes are different.
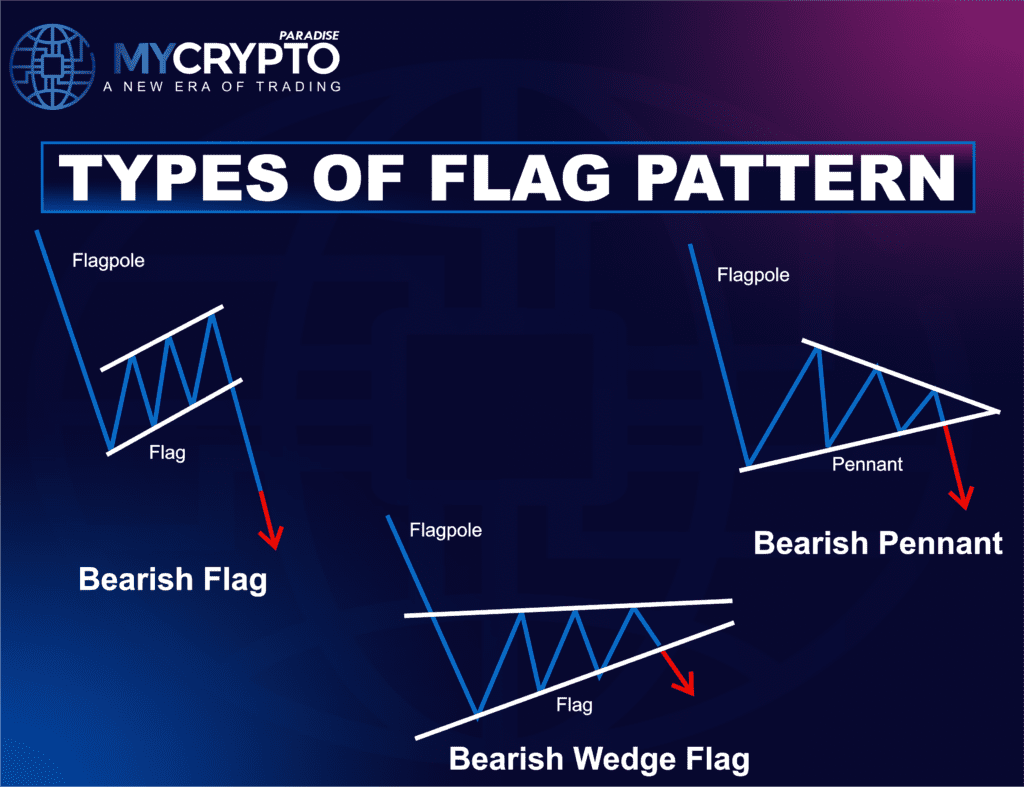
Bearish Flag: This forms as a small upward or sideways channel after a sharp decline. Price moves between two parallel lines before breaking down in the direction of the trend.
Bearish Pennant: This pattern forms after a strong decline and creates a small triangle where the lines converge. The price tightens into a point before breaking lower.
Bearish Wedge: This occurs when the price moves upward inside two converging lines that slope downward. It shows weakening bullish momentum, and a breakdown below the lower line usually continues the downtrend.
Volume Analysis in Bearish Flag Pattern
Volume behavior plays a critical confirming role in assessing the quality of a bearish flag in the crypto market, as it’s highly emotional and sentiment-driven.
- Flagpole:. During the flagpole phase, volume should expand, indicating strong participation and conviction behind the decline.
- Flag: As the price consolidates, volume typically contracts, suggesting that buying pressure lacks institutional backing. This contraction reflects market hesitation rather than strength.
- Breakdown: When the breakdown occurs, volume expands to discover the new price range to the downside. If volume fails to expand during the breakdown, traders should remain cautious, as false breakouts become more likely. Observing relative volume, volume divergence, and participation across correlated assets can further strengthen conviction in the setup.
How to Trade the Bearish Flag Pattern?
Trading the bearish flag requires disciplined timing and risk management, as it’s not as easy as it looks in the chart, as there are variations in bearish flags with a lot of parameters to check before trading.
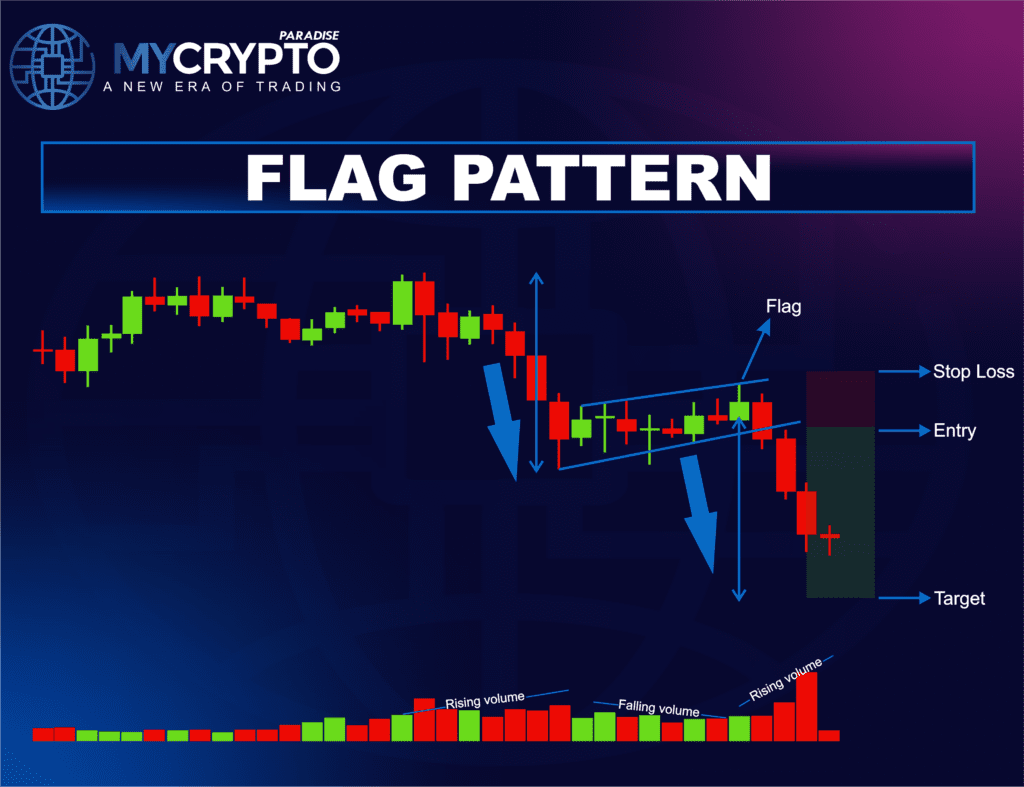
Entry:
The optimal entry comes after a confirmed candle close below the lower trendline of the flag, supported by strong volume. Volume expansion during the breakdown is critical because it confirms real selling pressure rather than a fakeout.
While aggressive crypto traders may position near the flag’s upper resistance in anticipation of the move, waiting for confirmation significantly increases the probability of a successful continuation.
Stop-loss:
Your stop-loss should be placed just above the upper boundary of the flag or slightly above the most recent swing high inside the consolidation. This placement protects you from false breakdowns and liquidity grabs, which are common in the crypto market.
Target:
The primary target is calculated by measuring the length of the flagpole and projecting that same distance downward from the breakout point. Professional crypto traders aim for a minimum 2:1 risk-to-reward ratio to maintain long-term profitability.
As momentum builds, you can trail your stop-loss to lock in profits and ride the continuation because in strong crypto downtrends, volatility can accelerate quickly in your favor.
Bearish Flag Pattern Failure Signals and Market Context
No pattern works every time, so spotting failure signs is important. If price breaks above the flag’s top, the bearish pattern fails and may trigger short-covering rallies.
Changes in the overall market or positive news can also make the pattern fail. Bearish flags work best in strong downtrends with negative sentiment and falling broader indices.
In sideways or low-volatility markets, false signals are more likely. Traders should check higher time-frame trends before risking capital.”
Conclusion
The bearish flag is a reliable continuation pattern that provides clear entries, defined risk, and strong risk-to-reward potential. When traded in a strong downtrend with proper confirmation, it can offer high-odds opportunities, but disciplined risk management remains essential.
At ParadiseFamilyVIP 🎖️, we train crypto traders to mix real-time reversal structures with institutional-level risk frameworks. We focus on clarity, patience, and precision, not hype. Our goal is to assist traders in navigating volatility with structure rather than emotion.
Join ParadiseFamilyVIP 🎖️ today and start trading with precision and discipline. Position yourself properly and stay prepared for the next high-probability action.
FAQs
1. What is a bearish flag pattern?
A Bearish Flag Pattern is a continuation chart pattern that forms after a strong downward move, followed by a brief upward or sideways consolidation. It signals that the downtrend is likely to resume once the price breaks below the flag structure.
2. How do you identify a bearish flag on a chart?
I identify a bearish flag by first spotting a sharp, high-volume sell-off, and then I look for a tight, low-volume consolidation. Confirmation comes only when the price breaks below the lower boundary with expanding volume.
3. How reliable is the bearish flag pattern?
It is one of the most reliable continuation trading setups when traded correctly. Historically, it has demonstrated 60%–70% probability of downside continuation when executed with strict confirmation and confluence.
4. What is the target of a bearish flag breakout?
The target of a Bearish Flag Pattern breakout is usually calculated by measuring the length of the flagpole (the initial sharp drop) and projecting that same distance downward from the breakout point. This measured move gives traders an estimated continuation target in a bearish trend.
5. Where should you place a stop loss in a bearish flag?
You need to set the stop-loss just above the upper trendline of the flag or slightly above the recent swing high within the consolidation. This helps protect against false breakdowns while maintaining a favorable risk-to-reward ratio.