


Technical Analysis
In short
Hidden bearish divergence occurs when an asset's price forms higher highs, but an oscillator like RSI or MACD shows lower highs. This pattern indicates weakening upward momentum within a broader downtrend, suggesting the bearish trend might continue.
In the world of technical analysis, traders are constantly searching for patterns and indicators that can provide valuable insights into potential market reversals. One such pattern is known as hidden bearish divergence. Hidden bearish divergence is a powerful signal that can help traders identify potential downside momentum and anticipate future price declines.
In this article, we will explore the concept of hidden bearish divergence, how it differs from regular bearish divergence, and how traders can effectively incorporate it into their trading strategies.
Understanding Divergence
To understand this divergence, it is essential first to grasp the concept of divergence. Divergence occurs when the price of an asset and an oscillating indicator move in opposite directions. It is a sign that the prevailing trend may be losing momentum and could potentially reverse. Regular bearish divergence is a widely recognized signal that indicates a potential trend reversal from bullish to bearish.
What is Hidden Bearish Divergence?
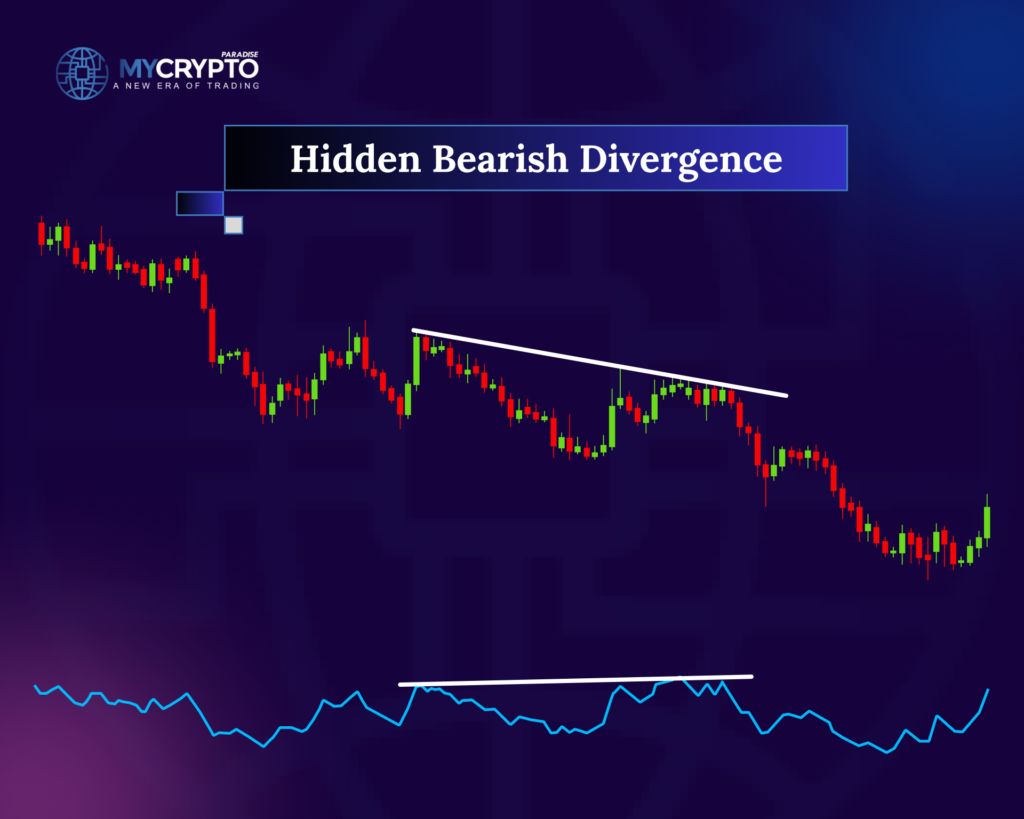
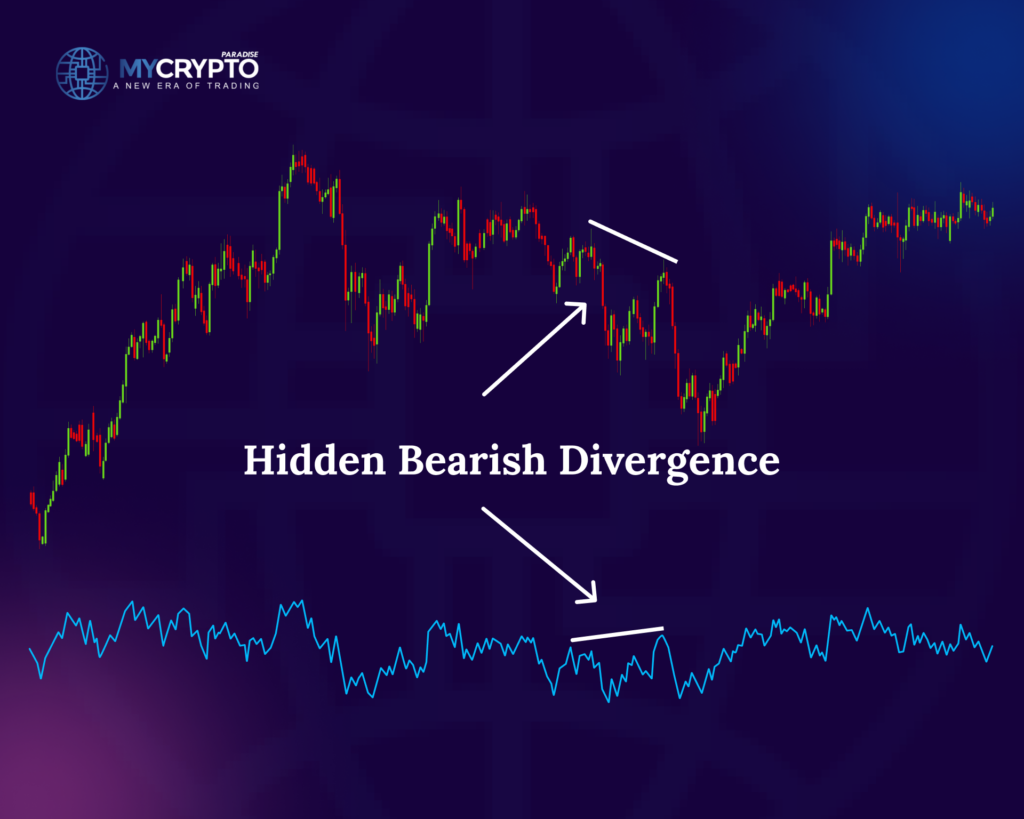
Hidden bearish divergence, on the other hand, is a variation of regular bearish divergence and often occurs within a larger downtrend. It is characterized by higher highs in price accompanied by lower highs in an oscillating indicator. This pattern indicates that despite the price making higher highs, the underlying momentum is weakening, and a bearish reversal is likely to follow.
Spotting Hidden Bearish Divergence
Identifying hidden bearish divergence requires a keen eye for detail and the use of technical indicators. Traders often rely on popular oscillators such as the Relative Strength Index (RSI), Moving Average Convergence Divergence (MACD), or Stochastic Oscillator to spot hidden bearish divergence.
These indicators help highlight divergences between price action and the indicator readings, providing valuable insights into potential trend reversals.
Trading Strategies Using Hidden Bearish Divergence
Hidden bearish divergence can be a valuable tool for traders, providing them with a clear indication of potential downside momentum. Here are a few trading strategies that incorporate hidden bearish divergence:
a. Trend Reversal Confirmation:
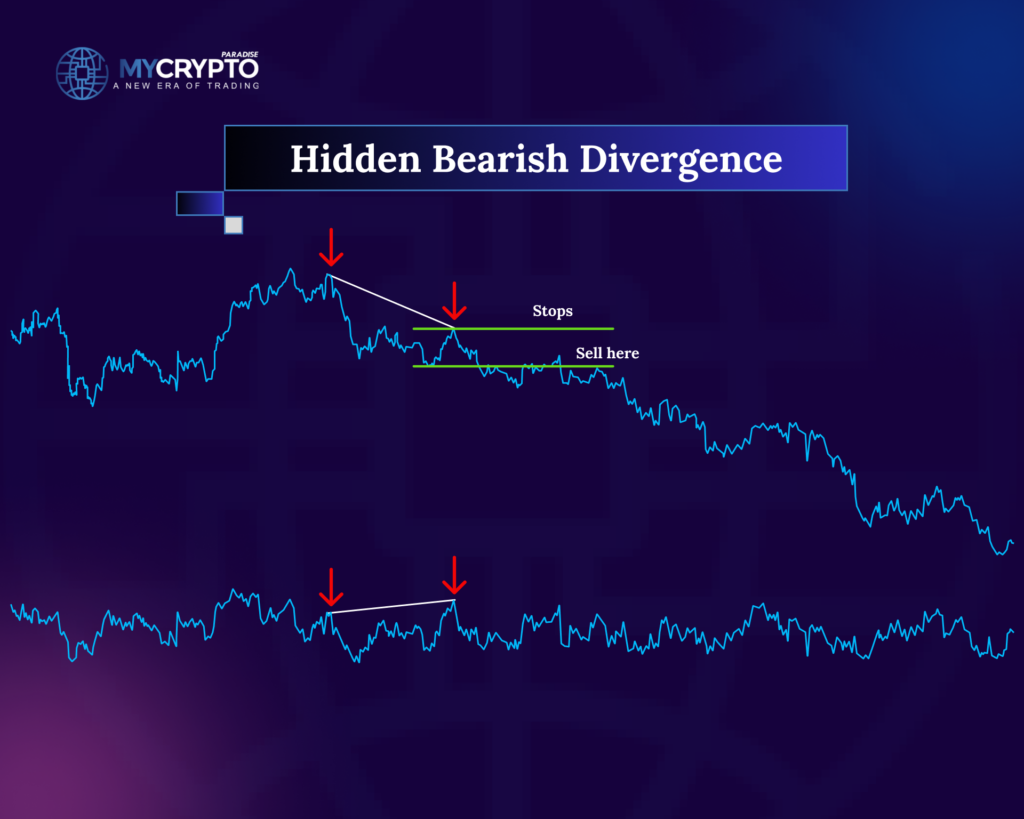
When hidden bearish divergence is detected within a larger downtrend, it can be used as confirmation that the bearish trend is likely to continue. Traders can initiate short positions or tighten their stop-loss levels to take advantage of the anticipated price decline.
b. Entry and Exit Points:
Hidden bearish divergence can also be used to identify potential entry and exit points. Traders can wait for the divergence pattern to form and then enter short positions as the price starts to decline. Additionally, traders can use divergence as an exit signal to close long positions or take profits.
c. Supplementary Indicators:
Traders often use divergence in conjunction with other technical indicators to increase the probability of successful trades. For example, they may look for bearish candlestick patterns, support and resistance levels, or trendline breaks to confirm the hidden bearish divergence signal.
d. Risk Management:
Proper risk management is crucial when incorporating hidden bearish divergence into trading strategies. Traders should set appropriate stop-loss orders to limit potential losses if the anticipated price decline does not occur. Additionally, position sizing based on risk tolerance and maintaining a disciplined approach to trading are essential.
What are the signs of potential profits in a hidden bearish divergence signal?
Here are some signs to consider when assessing potential profits in a divergence signal:
1. Confirmation of the Prevailing Downtrend:
Hidden bearish divergence is most effective when it occurs within a larger downtrend. If the divergence aligns with other bearish indicators, such as a break of key support levels or bearish candlestick patterns. It strengthens the signal and increases the likelihood of potential profits.
2. Oscillator Reaching Overbought Levels:
In a divergence, the price is making higher highs while the oscillator is making lower highs. It’s often advantageous if the oscillator reading coincides with or reaches overbought levels (e.g., above 70 on the Relative Strength Index) during the formation of hidden bearish divergence.
This indicates that the market is potentially overextended and due for a reversal, supporting the potential for profits on a downward move.
3. Price Breaks Key Support Levels:
Hidden bearish divergence can be more significant if the subsequent price action confirms the signal. If the price breaks below important support levels after the divergence formation, it suggests a stronger potential for profits as it validates the bearish bias.
4. Volume Confirmation:
Analyzing volume can provide additional confirmation of the hidden bearish divergence signal. If the volume increases during the formation of divergence and remains elevated as the price declines, it indicates stronger selling pressure. The potential for profits increases as more market participants participate in the downward move.
In ParadiseFamilyVIP🎖️, we send crypto signals that you get from our team of professional traders. Reach out to us here
How to set Trading Parameters for Hidden Bearish Divergence?
Setting entry, stop-loss, and take-profit levels for a hidden bearish divergence signal requires careful consideration of various factors, including the market conditions, risk tolerance, and the specific trading strategy employed. Here are some guidelines to help you establish these levels:
Entry Point
, Wait for the hidden bearish divergence pattern to fully develop. Also, confirm it by other technical indicators or price action signals.
– Consider entering a short position when the price starts to decline after the hidden bearish divergence formation.
– Look for additional confirmation signals such as bearish candlestick patterns, trendline breaks, or where price breaks key support/resistance levels to increase the validity of the entry point.
Stop Loss
– Place a stop-loss order above the recent swing high or the nearest significant resistance level to limit potential losses if the trade goes against you.
– Consider setting the stop-loss level at a point that invalidates the hidden bearish divergence signal, indicating a potential continuation of the bullish trend.
Take Profit
– Determine the take-profit level based on the potential downside target indicated by support levels, technical patterns, or other relevant indicators.
– Consider setting multiple take-profit levels to secure partial profits as the price moves in your favor.
– Use technical analysis tools like Fibonacci retracement levels or prior swing lows as potential profit targets.
– Adjust the take-profit levels based on the risk-reward ratio and your specific trading goals. Traders may choose to close the trade entirely or trail their stop-loss to capture further profits if the market sentiment remains bearish.
Conclusion
Hidden bearish divergence is a powerful signal that can provide traders with valuable insights into potential market reversals. By identifying underlying weakness in a rising price trend, traders can prepare themselves for potential downside moves and adjust their trading strategies accordingly. However, it is important to note that no trading signal is foolproof, and risk management should always be a priority.
The technical knowledge you’ve gained through this article is a solid foundation, but it’s not enough on its own to ensure long-term profitability. While the insights you’ve learned can give you a competitive edge, transforming that knowledge into consistent profits over the next 3+ years requires combining it with disciplined strategies and smart tactics.
At ParadiseFamilyVIP🎖️, we integrate our expertise in technical analysis, on-chain insights, accurate sentiment tracking, and deep whale psychology understanding with effective trading strategies to make only the best decisions for crypto signals and portfolio management. This powerful combination ensures we deliver consistent profits over the long run.
👉To check availability and secure your spot in ParadiseFamilyVIP🎖️ (Click it)
If you’re ready to take your trading to a professional level and want to see how we operate, joining our inner circle is the best way to do so.
Hidden Bearish Divergence FAQ
What is hidden bearish divergence?
It is a momentum pattern where price makes higher highs while an oscillator makes lower highs. This shows that upward momentum is weakening, suggesting the prevailing downtrend may continue once the corrective bounce fades.
How does it differ from regular bearish divergence?
Regular bearish divergence signals a possible reversal from an uptrend to a downtrend. Hidden bearish divergence instead appears within an existing downtrend and signals continuation of that downtrend rather than a fresh top.
Which indicators spot hidden bearish divergence?
Traders commonly use the Relative Strength Index, MACD, or the Stochastic Oscillator. The signal is stronger when the oscillator reaches overbought levels, such as above 70 on RSI, during the higher-high in price.
How do you confirm the signal before trading?
Look for added confirmation like a break of key support, bearish candlestick patterns, trendline breaks, or rising volume on the decline. Place a stop above the recent swing high so an invalidation closes the trade quickly.
Crypto trading involves substantial risk of loss. This article is educational and is not financial advice. Past performance does not guarantee future results. Always do your own research.
What is different here
Most guides stop at the theory. The MyCryptoParadise team shares the live trades, and the reasoning behind each one, inside ParadiseFamilyVIP. Everything here is education, not financial advice.
Crypto trading involves substantial risk and is not suitable for everyone. Nothing here is financial advice; it is education only. Never risk more than you can afford to lose.


Join the discussion
No comments yet. Pro Paradiser members, share how you are reading this.