


Technical Analysis Patterns
In short
The diamond pattern is a technical analysis reversal formation that resembles a rhombus on a price chart. It typically appears after a sustained uptrend, with price contracting between lower highs and higher lows before breaking out, often in the opposite direction.
In the exciting world of crypto trading, technical analysis offers crypto trading tips which play a vital role in understanding market trends and making informed decisions. Among the various patterns that traders employ, the diamond pattern holds particular significance.
This article aims to provide a comprehensive overview of the diamond pattern, its formation, interpretation, and potential implications within the realm of crypto trading.
Key Takeaways
1.The diamond pattern is a technical analysis formation that indicates a potential reversal in the prevailing market trend. It typically appears after a sustained uptrend.
2. To increase the probability of success, traders should look for confirmation signals and employ proper risk management techniques when trading the diamond pattern.
3. While the diamond pattern offers valuable insights, fundamental analysis. Technical indicators, market conditions, and external news events can influence the reliability of the pattern.
Understanding the Diamond Pattern
The diamond pattern is a technical analysis formation that appears on price charts, resembling a diamond or a rhombus. It is considered a reversal pattern, indicating a potential shift in the prevailing market trend. Traders often observe the diamond pattern as a consolidation phase before a significant breakout.
Formation of the Diamond Pattern
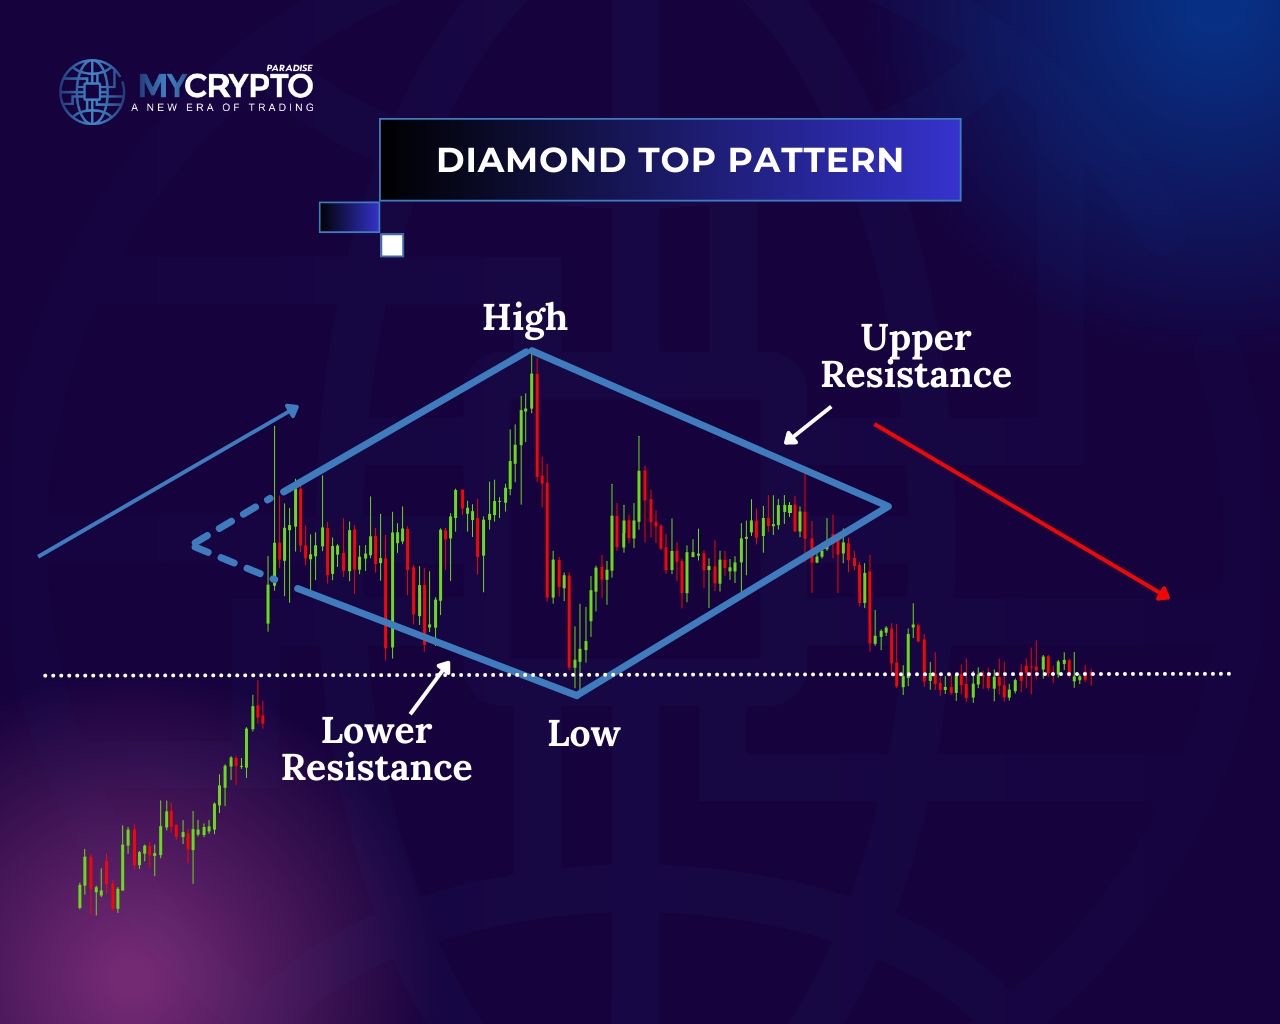
The diamond pattern is characterized by four main components: an initial uptrend, a contraction phase, a breakout, and a price target.
1. Initial Uptrend: The diamond pattern typically emerges after a sustained uptrend in the crypto market. During this phase, the price forms higher highs and higher lows, reflecting bullish momentum and positive investor sentiment.
2. Contraction Phase: Following the uptrend, the price enters a consolidation phase, marked by a narrowing range between lower highs and higher lows. This contraction creates the distinctive diamond shape on the price chart. As the pattern evolves, trading volume tends to decrease, indicating reduced market activity and indecision among market participants.
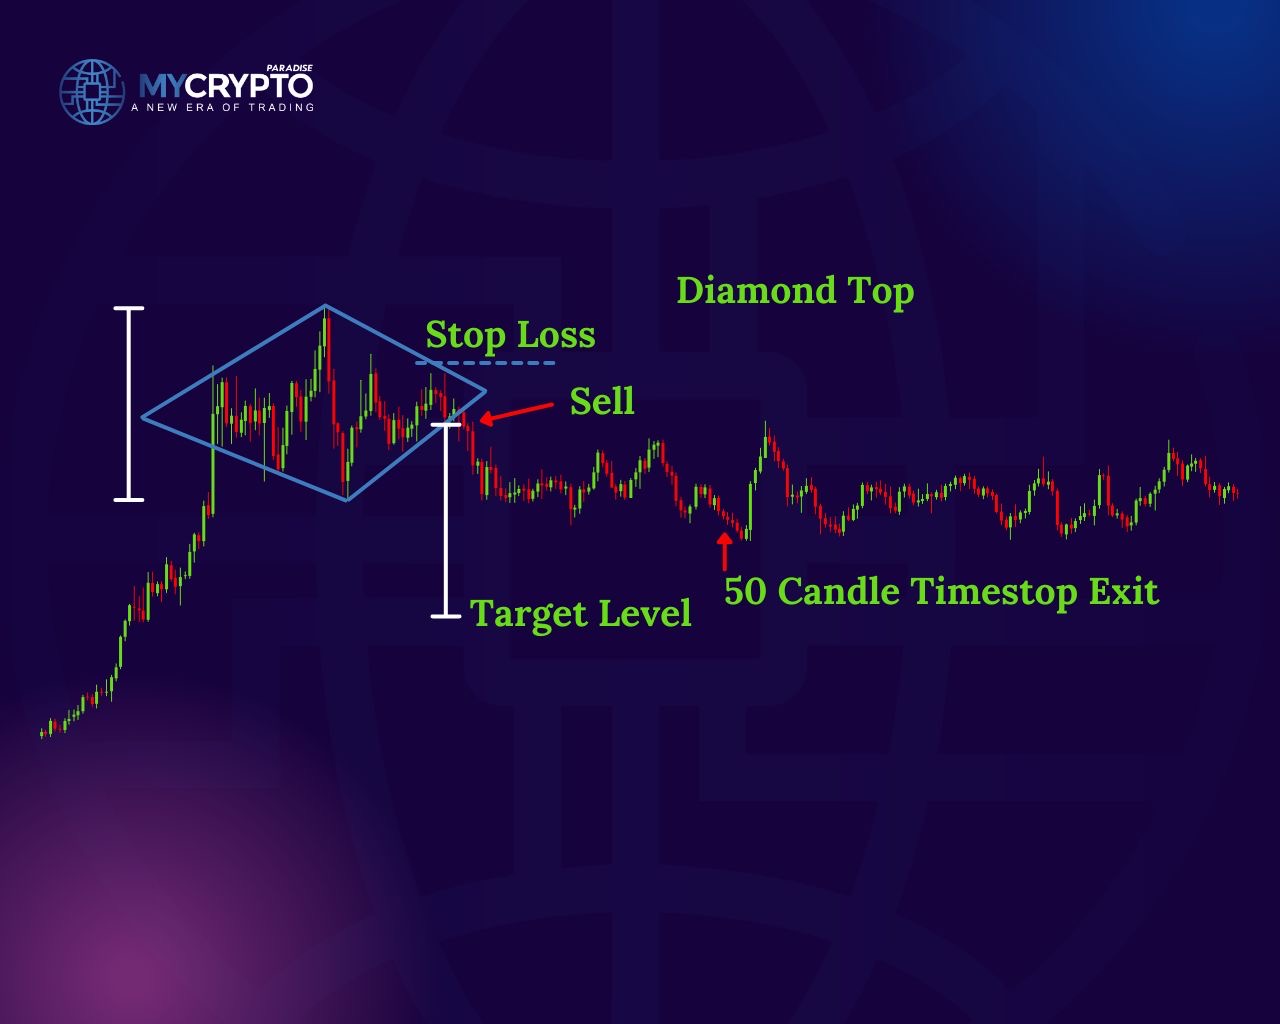
3. Breakout: Eventually, a breakout occurs from the diamond pattern. The breakout is usually in the direction opposite to the initial trend. For instance, if the diamond pattern forms after a prolonged uptrend, the breakout is more likely to be downwards, signaling a potential bearish reversal. However, it’s essential to wait for a confirmed close above or below the pattern’s support or resistance to validate the breakout and avoid false signals.
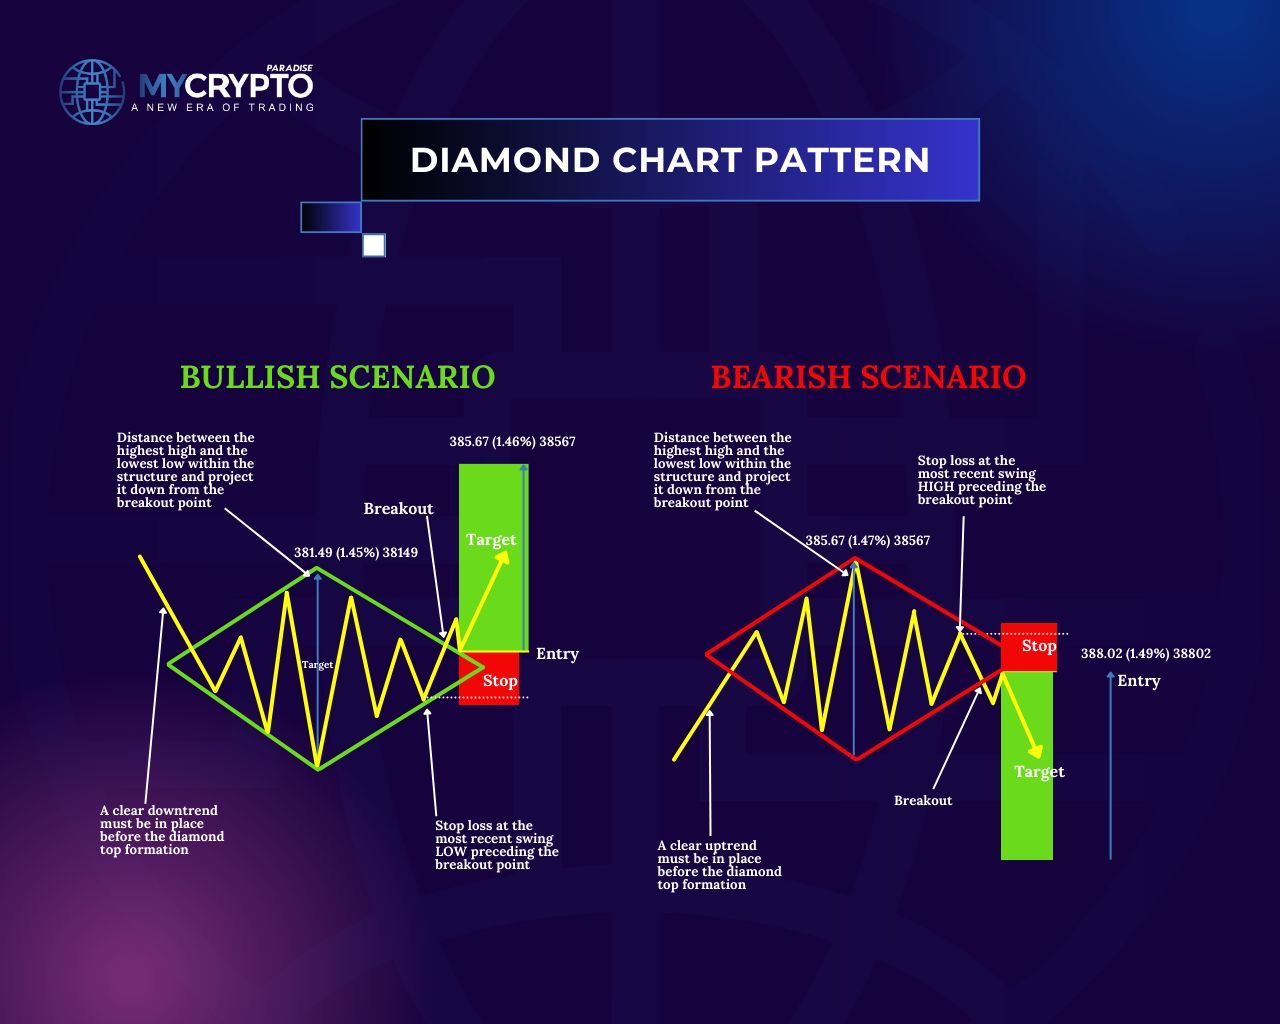
4. Price Target: Traders often employ two methods to estimate the price target after a breakout: the measuring principle and the width principle. The measuring principle involves measuring the widest part of the diamond pattern (from the highest to the lowest point) and projecting that distance in the direction of the breakout. On the other hand, the width principle suggests that the breakout move tends to be at least as long as the width of the pattern.
Confirming the Diamond Pattern
To enhance the reliability of the diamond pattern, traders consider additional confirmation signals and supportive indicators. Here are some commonly used techniques:
1. Volume Analysis: During the contraction phase of the diamond pattern, trading volume tends to decline as the price range narrows. However, when the breakout occurs, there is often a surge in trading volume, indicating increased market activity and potential confirmation of the pattern. Higher volume during the breakout strengthens the validity of the reversal signal.
2. Support and Resistance Levels: Traders examine support and resistance levels alongside the diamond pattern. These levels can act as barriers, reinforcing the potential significance of the pattern. A breakout that coincides with the breach of a significant support or resistance level adds weight to the pattern’s validity.
3. Oscillators and Indicators: Technical indicators such as oscillators (e.g., RSI or MACD) and moving averages can provide supplementary insights. For example, an overbought condition indicated by the RSI in conjunction with the diamond pattern may suggest an increased likelihood of a bearish reversal.
4. Candlestick Patterns: Combining the diamond pattern with candlestick analysis can provide further confirmation. Traders may look for bearish candlestick patterns, such as shooting stars or bearish engulfing patterns, near the diamond pattern’s upper trendline to strengthen the case for a bearish reversal.
Risk Management and Limitations
While the diamond pattern can be a valuable crypto trading tool, it is essential to approach it with caution and consider potential limitations. Here are some important points to keep in mind:
1. False Breakouts: False breakouts can occur in any technical analysis pattern, including the diamond pattern. A false breakout happens when the price briefly moves beyond the pattern but then reverses back into the pattern. To mitigate the risk of false signals, traders often wait for a confirmed close above or below the pattern’s trendlines before taking action.
2. Market Volatility and Fundamentals: Crypto markets are known for their inherent volatility, which can impact the reliability of technical patterns. Sudden market shifts, fundamental news, or external events may override the pattern’s implications. Traders should consider incorporating fundamental analysis and staying updated with market news to gain a comprehensive trading perspective.
3. Risk Management: As with any trading strategy, risk management is crucial. Traders should set appropriate stop-loss orders to protect against potential losses. Additionally, it is advisable to practice proper position sizing, diversification, and adhere to personal risk tolerance levels.
Determining the probabilities of a diamond pattern going in your favor in crypto trading is challenging as it depends on various factors and market conditions. It’s important to note that technical analysis patterns, including the diamond pattern, do not guarantee specific outcomes. They are probabilistic tools used to assess potential market movements.
Probabilities that the Diamond Pattern will Result in a Profitable Trade
This can vary based on the following factors:
Market Conditions: The overall market conditions and the prevailing trend play a significant role. In a strongly trending market, the probability of a diamond pattern leading to a reversal may be higher. Conversely, in a range-bound or choppy market, the pattern’s reliability may decrease.
Timeframe: The timeframe being analyzed can impact the success rate. The diamond pattern may be more reliable on longer timeframes, such as daily or weekly charts, compared to shorter timeframes, which could be more prone to noise and false breakouts.
Volume Confirmation: Higher trading volume during the breakout can provide confirmation and increase the likelihood of the pattern going in your favor. A breakout with significant volume indicates increased market participation and potentially stronger momentum.
Confirmation Signals: Utilizing additional confirmation signals, such as support and resistance levels, oscillators, or candlestick patterns, can enhance the probability of the pattern’s success. When multiple indicators align with the diamond pattern, it strengthens the case for a favorable outcome.
Risk Management: Proper risk management is crucial in managing trades. Setting appropriate stop-loss orders and adhering to risk management principles can help limit potential losses if the pattern fails to materialize as expected.
Market Volatility: Cryptocurrency markets are known for their volatility, which can impact the reliability of patterns. Higher volatility may result in more frequent breakouts and potential false signals. Traders should consider adjusting their strategies and risk parameters accordingly.
Determining the optimal entry point, take profit, and stop-loss levels when trading the diamond pattern
This can be subjective and dependent on various factors, including individual trading strategies, risk tolerance, and market conditions. However, here are some general guidelines that traders often consider:
Entry Point:
When considering an entry point, traders typically wait for confirmation of the diamond pattern. This confirmation typically occurs when the price breaks out of the pattern, either above or below the trendlines. To minimize the risk of false breakouts, some traders wait for a confirmed close above or below the trendlines before entering a trade. This helps ensure that the breakout is sustained and not a temporary price spike.
Take Profit:
Determining the take-profit level can be approached in a couple of ways. One common method is to measure the width of the diamond pattern (from the highest to the lowest point) and project that distance in the direction of the breakout.
This provides an estimate of the potential price target. Additionally, traders may consider key support or resistance levels as potential take-profit targets. Monitoring price action and adjusting the take-profit level as the trade progresses can also be a prudent approach.
Stop Loss:
Setting a stop-loss level is crucial to manage risk and protect against potential losses. The stop-loss level can be placed below the breakout point (for a long position) or above the breakout point (for a short position).
Traders often consider the recent price action, support and resistance levels, or the diamond pattern’s trendlines to determine an appropriate stop-loss level. It’s important to set the stop-loss level at a point that allows for some market fluctuations but avoids excessive losses if the trade goes against expectations.
It’s important to note that these suggested levels are not one-size-fits-all recommendations. Traders should adapt them based on their risk management strategies, trading style, and the specific characteristics of the diamond pattern they are analyzing. Additionally, it’s advisable to consider other technical indicators, market conditions, and potential news events that could impact the trade.
Lastly, seeking guidance from experienced traders or financial advisors and conducting thorough research can provide valuable insights and help refine your trading decisions related to the diamond pattern.
Which is why, in ParadiseFamilyVIP🎖️, we send crypto signals that you get from our team of professional traders. You can contact us here
Conclusion
The diamond pattern is a significant technical analysis formation in crypto trading, indicating a potential trend reversal. By understanding its formation, interpreting breakout signals, and considering confirmation indicators, traders can gain valuable insights into market dynamics.
However, it is essential to exercise caution, employ risk management strategies, and complement the analysis with other forms of analysis, such as fundamental analysis. The technical knowledge shared in this article is valuable, but not enough to make you a consistently profitable trader.
At ParadiseFamilyVIP🎖️, we use technical analysis, on-chain data, sentiment monitoring, and a deep understanding of whale behavior to deliver premium crypto signals and portfolio management that ensure long-term success.
👉To check membership availability in ParadiseFamilyVIP🎖️ (Click it)
If you’re ready to elevate your skills to the PRO level, joining our inner circle is the smartest step. Seats are limited, so join the waiting list if necessary.
Diamond Pattern FAQ
What does a diamond pattern signal?
It signals a potential reversal of the prevailing trend. When it forms after a prolonged uptrend, the breakout is more likely to be downward, pointing to a possible bearish reversal.
How do you set a price target for a diamond pattern?
Measure the widest part of the diamond from its highest to lowest point, then project that distance in the direction of the breakout. Nearby support or resistance levels can also serve as targets.
How can traders confirm a diamond pattern breakout?
Wait for a confirmed close above or below the trendlines, ideally on rising volume. Oscillators like RSI or MACD and candlestick signals near the trendline add further confirmation.
How do you manage risk when trading a diamond pattern?
Place a stop-loss below the breakout point for longs or above it for shorts to limit losses from false breakouts. Use proper position sizing and respect your own risk tolerance, since no pattern guarantees an outcome.
Crypto trading involves substantial risk of loss. This article is educational and is not financial advice. Past performance does not guarantee future results. Always do your own research.
What is different here
Most guides stop at the theory. The MyCryptoParadise team shares the live trades, and the reasoning behind each one, inside ParadiseFamilyVIP. Everything here is education, not financial advice.
Crypto trading involves substantial risk and is not suitable for everyone. Nothing here is financial advice; it is education only. Never risk more than you can afford to lose.


Join the discussion
No comments yet. Pro Paradiser members, share how you are reading this.