


Technical Analysis Patterns
In short
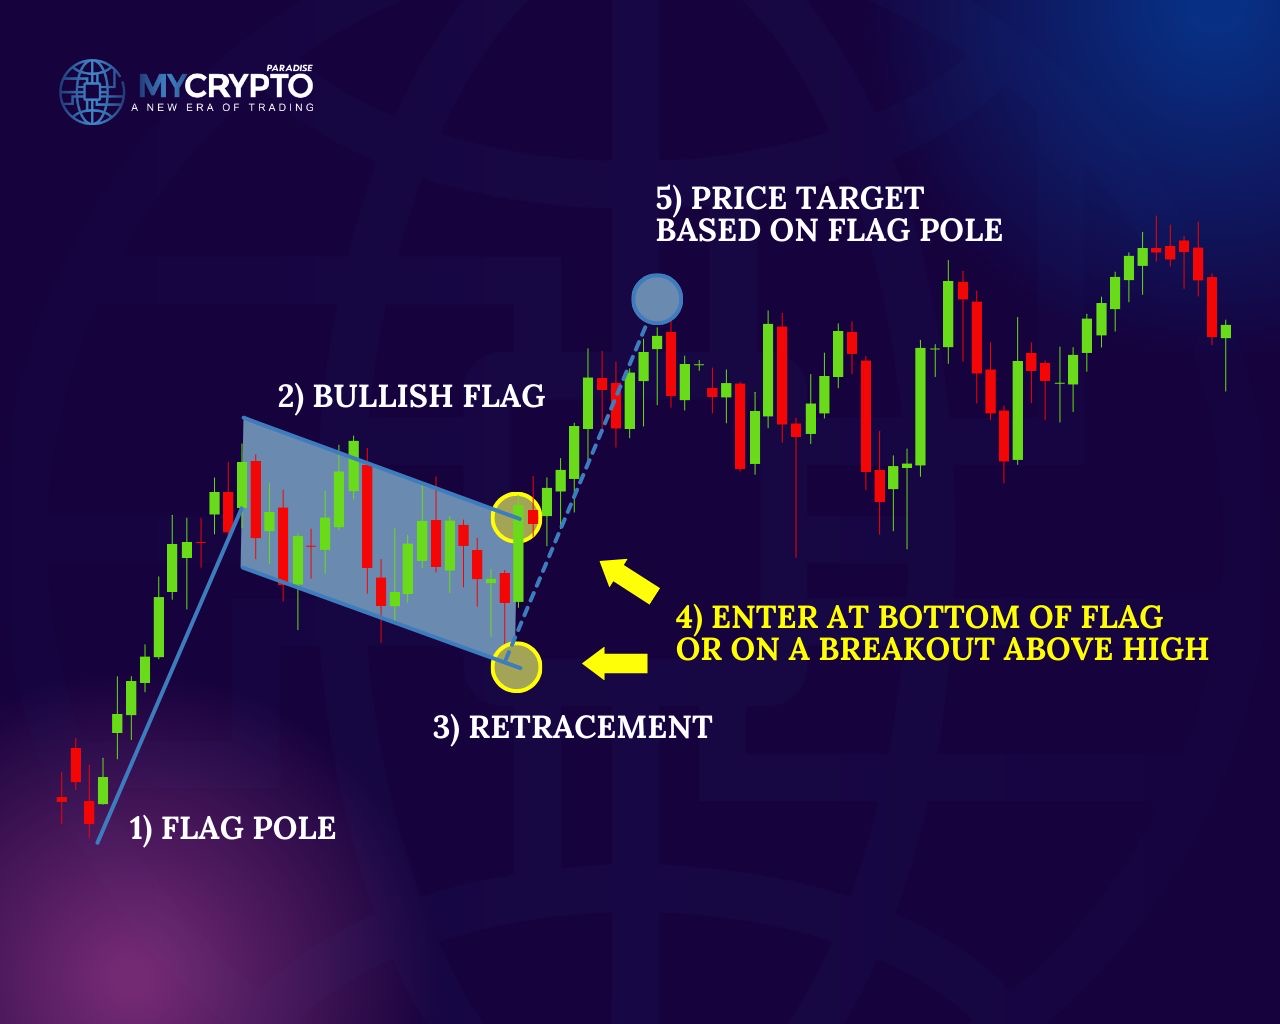
A flag pattern is a continuation pattern in technical analysis, forming after a sharp price move (the flagpole) followed by a brief, narrow, sloping consolidation channel. Bullish flags slope downward and break upward, while bearish flags slope upward and break downward. Traders typically look for entry upon a volume-backed breakout in the direction of the prior trend.
Crypto trading has gained immense popularity in recent years, attracting traders and investors from around the world. To succeed in this dynamic market, it is crucial to understand various technical analysis tools and patterns that can provide valuable insights into price movements. One such pattern is the flag pattern, which is widely used by traders to identify potential opportunities for profitable trades. In this article, we will explore the flag pattern in crypto trading, its characteristics, and how to effectively incorporate it into your trading strategy.
How to Trade Crypto Signals: What is the Flag Pattern?
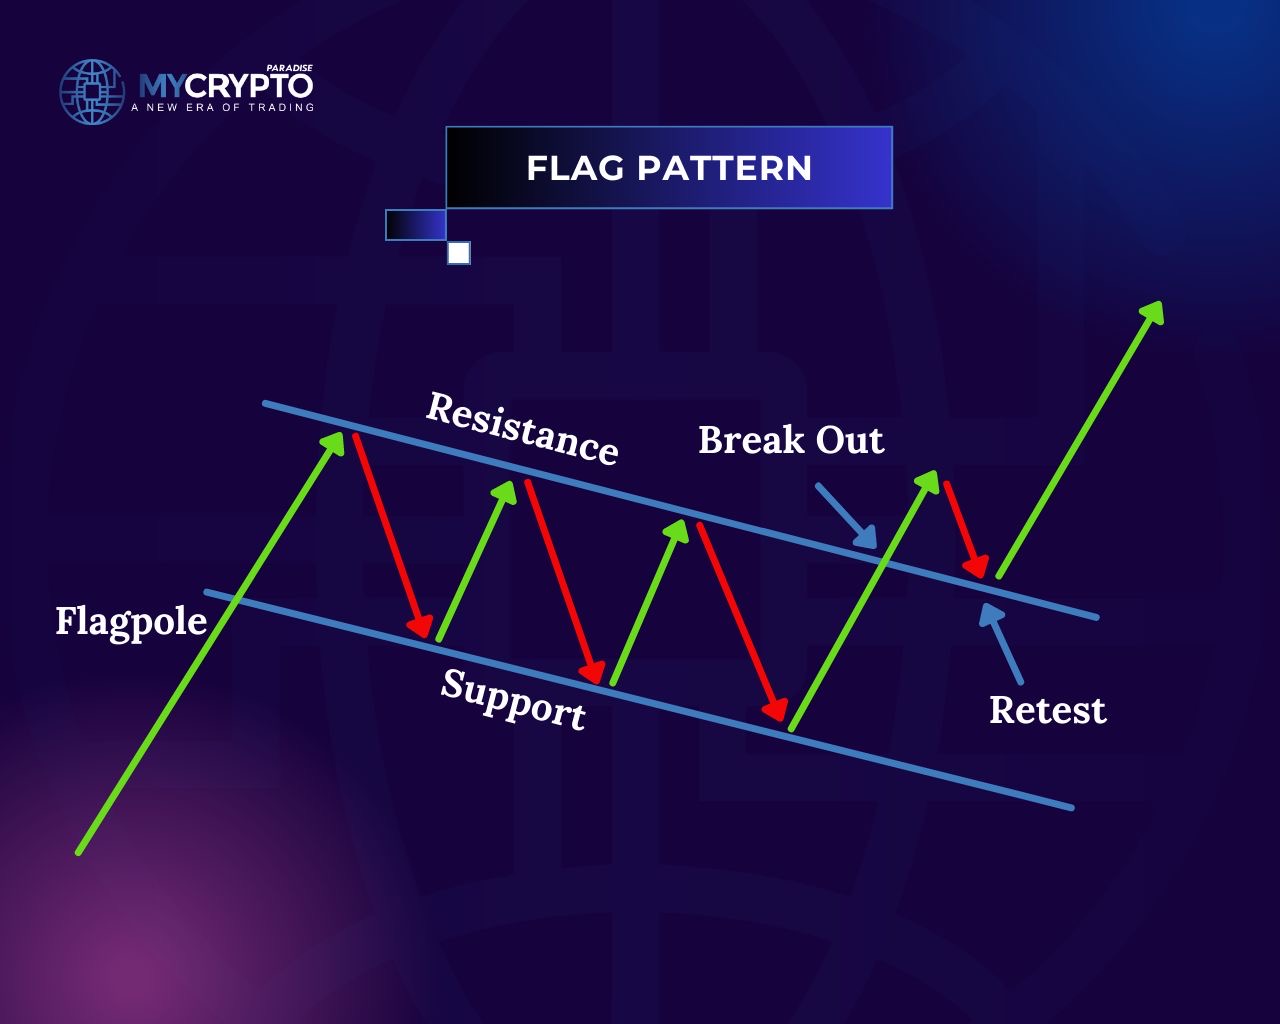
The flag pattern is a continuation pattern that occurs after a significant price movement in a particular direction. It is characterized by a period of consolidation, where the price enters a narrow range and forms a rectangular pattern resembling a flag. This consolidation phase is typically accompanied by lower trading volumes, indicating a temporary pause in the market’s momentum.
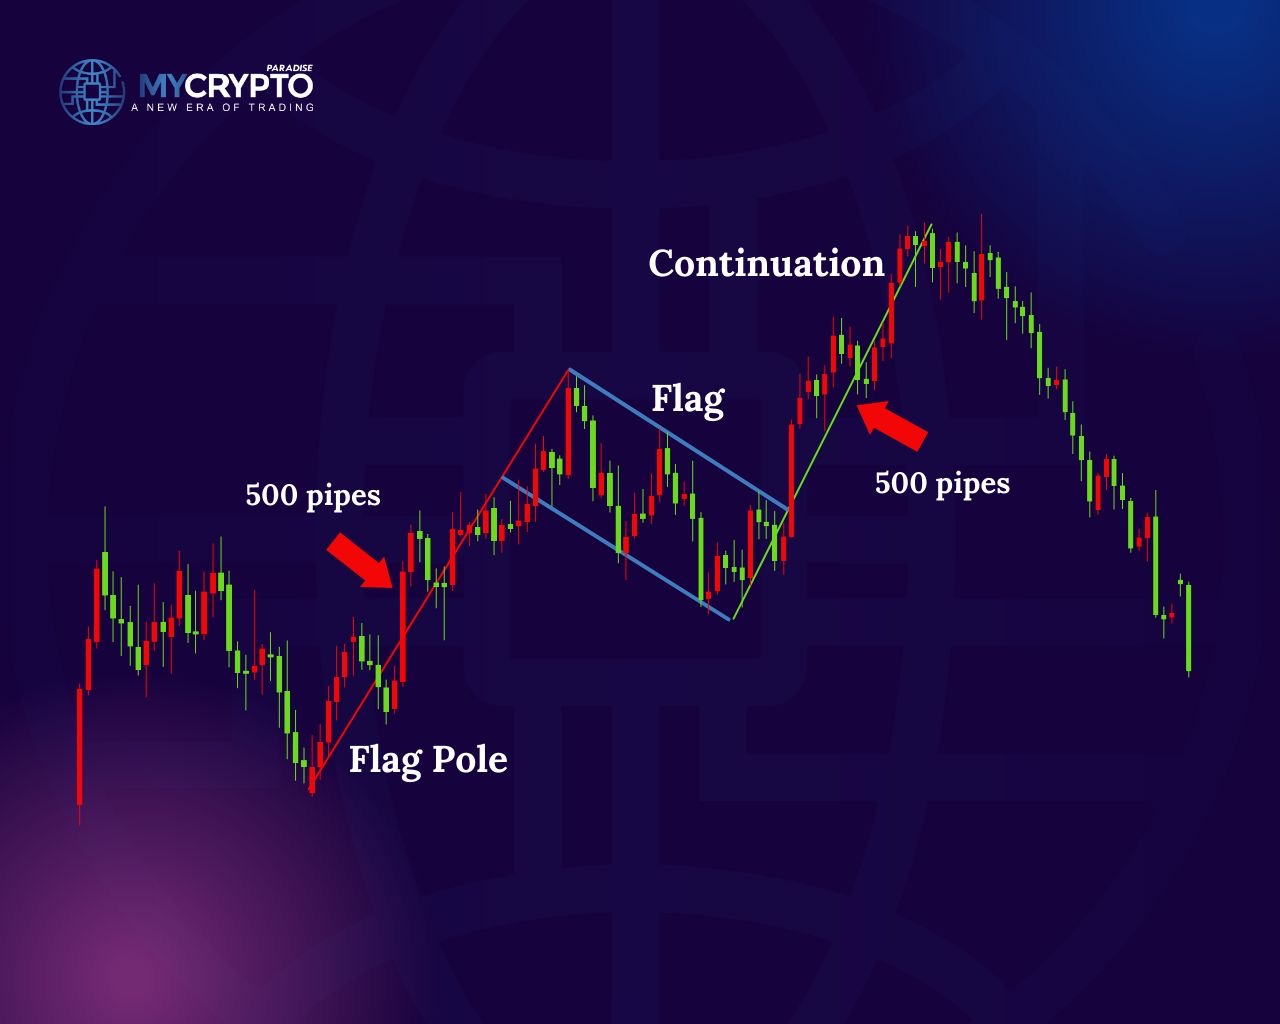
The flag pattern is usually preceded by a strong upward or downward price movement known as the “flagpole.” The flagpole represents the initial phase of the pattern and sets the stage for the subsequent consolidation. The flag formation itself consists of two parallel trendlines, with the upper trendline acting as resistance and the lower trendline as support.
Bullish and Bearish Flag Patterns
There are two variations of the flag pattern based on the direction of the preceding price movement: the bullish flag and the bearish flag.
1. Bullish Flag: The bullish flag pattern occurs after a strong upward movement, indicating a period of consolidation before a potential continuation of the upward trend. During this phase, the price forms a downward-sloping flagpole, followed by a parallel channel that consolidates the gains. Crypto traders often interpret this pattern as a temporary pause in the bullish trend, suggesting that there may be further upside potential once the consolidation is complete.
2. Bearish Flag: Conversely, the bearish flag pattern occurs after a significant downward movement, suggesting a temporary pause before a potential continuation of the bearish trend. In this case, the flagpole forms an upward-sloping line, and the subsequent consolidation takes the shape of a parallel channel. Traders view this pattern as a momentary consolidation before the bears regain control and push the price lower.
Crypto Signals: Identifying and Trading the Flag Pattern
To effectively trade the flag pattern, it is essential to identify it correctly and wait for confirmation before entering a trade. Here are the key steps involved:
1. Flagpole Identification: Begin by identifying a significant price movement that precedes the flag pattern. The flagpole should exhibit a strong and swift move in one direction, indicating a surge in buying or selling pressure.
2. Flag Formation: Once the flagpole is established, look for the subsequent consolidation phase. This phase will be characterized by lower volatility, decreasing trading volumes, and the formation of two parallel trendlines that represent the flag.
3. Confirmation: Wait for a breakout from the flag pattern to confirm its validity. A bullish breakout occurs when the price breaks above the upper trendline, while a bearish breakout happens when the price breaches the lower trendline. These breakouts are often accompanied by an increase in trading volume, signifying the resumption of the prior trend.
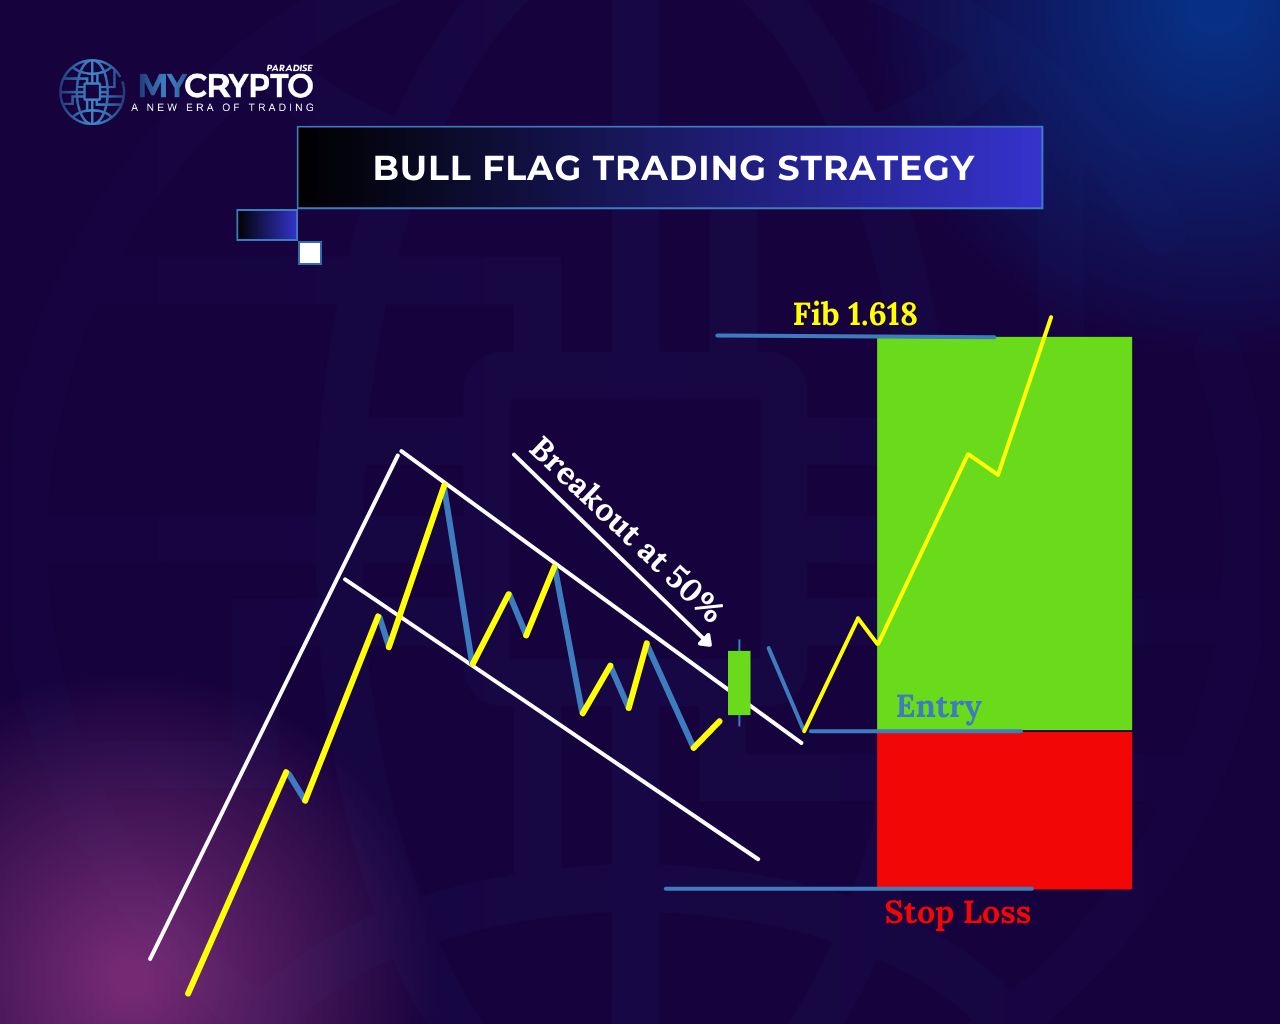
4. Entry and Stop-Loss Levels: Once the breakout is confirmed, consider entering a trade in the direction of the preceding trend. For bullish flags, a long position can be initiated above the breakout level, with a stop-loss order placed below the lower trendline. Conversely, for bearish flags, a short position can be initiated below the breakout level, with a stop-loss order above the upper trendline.
5. Target Levels: Determine potential target levels by measuring the length of the flagpole and projecting it from the breakout point. This projection can provide an approximate target for the price movement following the breakout. However, it is important to monitor the market conditions and adjust the target levels accordingly.
Common Limitations When Trading Flag Pattern
While the flag pattern can be a reliable tool in identifying potential trading opportunities, it is essential to consider certain limitations and factors that could affect its effectiveness:
1. False Breakouts: False breakouts can occur, where the price briefly breaks out of the flag pattern but fails to sustain the momentum. To mitigate this risk, it is advisable to wait for confirmation and observe the trading volume during the breakout.
2. Market Conditions: The flag pattern works best in trending markets, where there is a clear and sustained direction. In choppy or sideways markets, the pattern may produce false signals or fail to generate substantial price movements.
3. Risk Management: As with any trading strategy, risk management is crucial. Set appropriate stop-loss levels to limit potential losses and consider employing proper position sizing techniques to manage risk effectively.
What’s a Good Entry point, Take Profit, and Stop Loss While Trading with Flag Pattern

Calculating the entry, take profit, and stop loss levels for trading a flag pattern involves utilizing technical analysis tools and considering key price points within the pattern. Here’s a step-by-step guide on how to calculate these levels:
1. Identify the Flag Pattern: First, accurately identify the flag pattern on the price chart. Look for a strong price movement (flagpole) followed by a period of consolidation (the flag) characterized by parallel trendlines.
2. Determine the Breakout Level: The breakout level is the point at which the price breaks out of the flag pattern, indicating the potential resumption of the prior trend. For a bullish flag, the breakout level is above the upper trendline, while for a bearish flag, it is below the lower trendline.
3. Calculate the Entry Level: Once the breakout level is determined, the entry level can be calculated. For a bullish flag, the entry level is typically above the breakout level, indicating a long position entry. Conversely, for a bearish flag, the entry level is usually below the breakout level, suggesting a short position entry.
4. Set the Stop Loss: The stop loss level is a crucial component of risk management, helping to limit potential losses if the trade goes against you. For a bullish flag, place the stop loss below the lower trendline of the flag pattern. In the case of a bearish flag, position the stop loss above the upper trendline. This placement helps to protect the trade if the price reverses and moves in the opposite direction.
5. Determine the Take Profit Level: The take profit level represents the target price at which you aim to exit the trade and secure your profits. One common approach is to measure the length of the flagpole, the initial price movement that preceded the flag, and project it from the breakout level. This projection can provide an approximate target for the price movement following the breakout. However, it’s important to consider other factors, such as support and resistance levels or key Fibonacci retracement levels, which can act as additional profit targets or points to reassess the trade.
The Probabilities that Flag Pattern will Result in Profits
For maximum profitability, ensure that the pattern meets the criteria for a flag pattern. The odds of making profits increases when there’s a strong preceding price movement (flagpole) followed by a consolidation phase with two parallel trendlines.
You are more likely to be in profits when there’s increasing volumes during the breakout. This indicates a greater potential for continued price movement in the direction of the prior trend. If the flag pattern aligns with a strong and established trend, the probability of a profitable trade may be higher.
Furthermore, higher timeframes, such as daily or weekly charts, tend to provide more reliable and significant price movements, potentially increasing the profitability of trades based on flag patterns observed on these longer timeframes.
Lastly, identify key support and resistance levels in the vicinity of the flag pattern. If the breakout occurs above a significant resistance level (in the case of a bullish flag) or below a significant support level (in the case of a bearish flag), it can enhance the probability of a profitable trade.
Conclusion
The flag pattern is a valuable technical analysis tool for crypto traders, allowing them to identify potential continuation opportunities after significant price movements. By understanding the flag pattern’s characteristics and incorporating it into a comprehensive trading strategy, traders can enhance their decision-making process and improve their chances of profiting from the dynamic cryptocurrency market.
The technical knowledge you’ve gained from this article is valuable but insufficient for consistent, long-term profitability. While it gives you an edge, sustained success over the next 3+ years requires combining this knowledge with effective trading strategies and tactics.
At ParadiseFamilyVIP, we blend technical analysis, on-chain metrics, sentiment tracking, and whale psychology to provide top-tier crypto signals and portfolio management, ensuring consistent results.
The ParadiseTeam is transparent, sharing every trade we make, including planned exits and portfolio allocation percentages, so you can match our ROI.
We trade with our own capital and openly share our daily activities to help you grow as a trader. If you’re ready to take your trading to the next level, joining our inner circle is the right move. Seats are limited, so join the waiting list if needed.
Our service is premium, designed for traders with sufficient capital. If you’re just starting, we recommend using our FREE Telegram channels to build your foundation.
To check ParadiseFamilyVIP membership availability, click here: https://mycryptoparadise.com/paradisefamilyvip/
We trade exclusively on trusted exchanges, offering up to 35% fee discounts and deposit bonuses for members. These platforms are fully vetted by the ParadiseTeam, ensuring secure and legitimate trading 💙🌴
MEXC: https://www.mexc.com/landings/MyCryptoParadise?handleDefaultLocale=keep&inviteCode=1nqGL
BINGX: https://bingx.com/en/act/chanelActivityStyle3/PCF833J1/
KCEX: https://www.kcex.com/register?inviteCode=MYCRYPTOPARADISE
BITUNIX: https://www.bitunix.com/register?vipCode=3q22
Both BITUNIX and KCEX are licensed and fully legal in the USA ✅💰
Flag Patterns FAQ
What is a flag pattern in crypto trading?
It is a continuation pattern that appears after a strong directional move called the flagpole, followed by a short consolidation phase that forms a small rectangular channel resembling a flag. It signals a likely pause before the prior trend resumes.
What is the difference between a bullish and bearish flag?
A bullish flag forms after a strong upward move and slopes slightly downward before breaking above the upper trendline. A bearish flag forms after a strong downward move and slopes slightly upward before breaking below the lower trendline.
How do you set the take profit for a flag pattern?
A common method is to measure the length of the flagpole and project that distance from the breakout point to estimate a target. Nearby support, resistance, and Fibonacci levels can also serve as additional targets or points to reassess the trade.
What are the main limitations of trading flag patterns?
False breakouts can trap traders when the price exits the flag but fails to follow through, so waiting for confirmation and rising volume helps. Flags also work best in clear trending markets and tend to give poor signals in choppy or sideways conditions.
Crypto trading involves substantial risk of loss. This article is educational and is not financial advice. Past performance does not guarantee future results. Always do your own research.
What is different here
Most guides stop at the theory. The MyCryptoParadise team shares the live trades, and the reasoning behind each one, inside ParadiseFamilyVIP. Everything here is education, not financial advice.
Crypto trading involves substantial risk and is not suitable for everyone. Nothing here is financial advice; it is education only. Never risk more than you can afford to lose.


Join the discussion
No comments yet. Pro Paradiser members, share how you are reading this.