MCP Insights
 PRO Paradiser
 MCP MasterClass
  ParadiseFamilyVIP Crypto Signals💰
Introduction
In the volatile world of cryptocurrency trading, technical indicators play a crucial role in helping traders make informed decisions. One popular indicator is the Relative Strength Index (RSI), which measures the momentum of price movements. While the RSI can be valuable on its own, combining it with other technical indicators can enhance its effectiveness and provide deeper insights into market conditions.
In this article, we will explore various ways to combine the RSI with other indicators in crypto trading, highlighting their benefits and potential applications.
Understanding the Relative Strength Index (RSI)

Before delving into combining the RSI with other indicators, let’s briefly review the RSI itself. The RSI is a momentum oscillator that oscillates between 0 and 100. It compares the magnitude of recent gains and losses over a specified period, typically 14 days, to determine overbought and oversold conditions.
When the RSI crosses above the 70 level, it suggests overbought conditions and a potential reversal may be imminent. Conversely, when the RSI falls below the 30 level, it indicates oversold conditions and a potential upward reversal.
Combining RSI with Moving Averages
Combining the RSI with moving averages can provide valuable confirmation signals in crypto trading. Moving averages smooth out price fluctuations over a specific period, helping traders identify trends. By using a longer-term moving average, such as the 200-day moving average, in conjunction with the RSI, traders can gain a comprehensive understanding of the overall trend and potential reversal points.
For instance, if the price is above the 200-day moving average, it suggests an uptrend. In this scenario, traders can look for opportunities to buy when the RSI reaches oversold levels (below 30) and subsequently moves back above that level. This combination of a bullish RSI signal and the presence of an uptrend increases the probability of a successful trade.
Conversely, in a downtrend scenario where the price is below the 200-day moving average, traders can seek short-selling opportunities when the RSI reaches overbought levels (above 70) and subsequently falls back below that threshold. The bearish RSI signal combined with the downtrend reinforces the potential for a profitable trade.
Combining RSI with Support and Resistance Levels
Support and resistance levels are important areas where price tends to stall or reverse. Combining the RSI with support and resistance analysis can provide additional confirmation signals for potential trend reversals or continuations.
When the RSI reaches extreme levels (e.g., above 70 or below 30) near a significant support level, it suggests a potential buying opportunity. The oversold RSI reading near a support level indicates that selling pressure may have exhausted, increasing the probability of a price bounce. Traders can look for bullish price patterns or other indicators to further validate the potential trade opportunity.
Conversely, when the RSI reaches extreme levels near a resistance level, it can signal a potential selling opportunity. The overbought RSI reading near a resistance level indicates that buying pressure may have reached a saturation point, increasing the likelihood of a price pullback. Traders can consider bearish price patterns or other indicators to confirm the potential trade opportunity.
RSI in Combination with Divergence
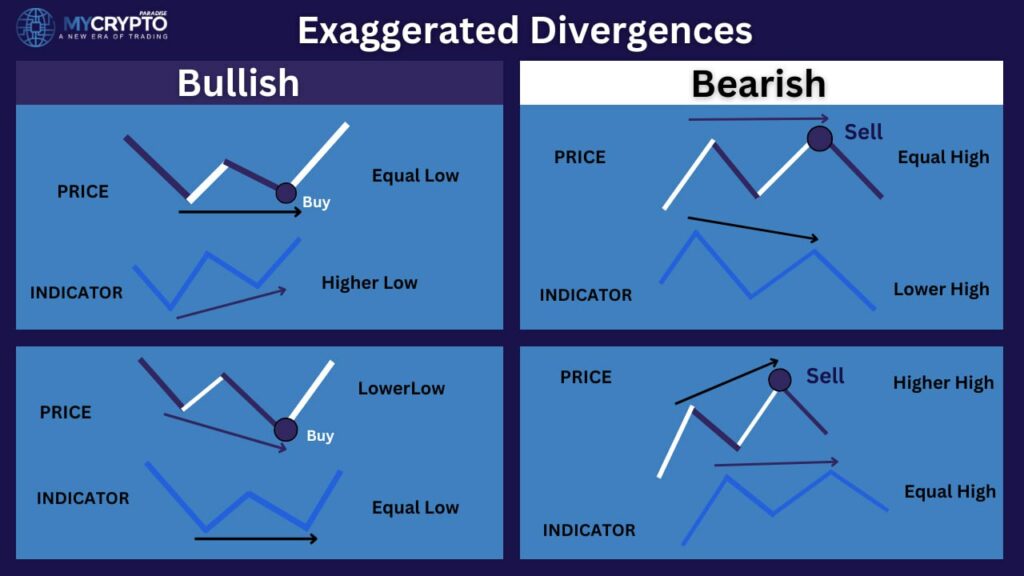
Divergence occurs when the price makes a higher high or lower low, but the RSI fails to confirm the same pattern. This phenomenon can provide valuable insights into potential trend reversals.
Bullish Divergence: Bullish divergence occurs when the price forms a lower low, but the RSI forms a higher low. This suggests that the downward momentum is weakening, and a potential trend reversal to the upside may be on the horizon. Traders can use this signal to anticipate buying opportunities.
Bearish Divergence: Bearish divergence occurs when the price forms a higher high, but the RSI forms a lower high. This indicates that the upward momentum is waning, and a potential trend reversal to the downside may occur. Traders can use this signal to anticipate selling opportunities.
It’s important to note that while divergence can be a powerful tool, it should not be relied upon in isolation. Traders should consider other technical indicators, price patterns, and market conditions to validate the potential trade setups.
Other Important Indicators to Use with RSI
Apart from moving averages, support and resistance levels, and divergence, there are several other technical indicators that can be combined with the Relative Strength Index (RSI) in crypto trading. Here are a few popular ones:
1. Bollinger Bands:
Bollinger Bands consist of a middle band (usually a simple moving average) and an upper and lower band that represent volatility levels. When the price moves outside the bands, it suggests a potential trend reversal or continuation. Combining the RSI with Bollinger Bands can provide confirmation signals. For example, when the price touches the lower band and the RSI is in oversold territory, it may indicate a buying opportunity.
2. Moving Average Convergence Divergence (MACD):
MACD is a trend-following momentum indicator that consists of two lines, the MACD line and the signal line. When the MACD line crosses above the signal line, it generates a bullish signal, and when it crosses below the signal line, it generates a bearish signal.
Combining the RSI with MACD can help traders confirm potential trend reversals or continuations. For instance, if the RSI is in oversold territory and the MACD generates a bullish crossover, it reinforces the potential for a price reversal.
3. Fibonacci Retracement:
Fibonacci retracement levels are horizontal lines that indicate potential support or resistance levels based on the Fibonacci sequence. Combining the RSI with Fibonacci retracement levels can help traders identify key levels where the price may reverse or continue its trend. For example, if the RSI is in oversold territory and coincides with a Fibonacci retracement level, it may suggest a higher probability of a price bounce.
4. Volume Indicators:
Volume indicators, such as the On-Balance Volume (OBV) or the Volume Weighted Average Price (VWAP), provide insights into the buying and selling pressure in the market. Combining the RSI with volume indicators can help confirm the strength of price movements. For instance, if the RSI indicates oversold conditions, but the volume is low, it may suggest that the price reversal could be weak.
5. Ichimoku Cloud:
The Ichimoku Cloud is a versatile indicator that provides multiple pieces of information, including support and resistance levels, trend direction, and momentum. Combining the RSI with the Ichimoku Cloud can provide comprehensive insights into market conditions. For example, if the RSI is in oversold territory and the price is above the cloud, it may suggest a stronger bullish signal.
In ParadiseFamilyVIP🎖️, we send crypto signals that you get from our team of professional traders. Contact us here.
Conclusion
Combining the Relative Strength Index (RSI) with other technical indicators can enhance the effectiveness of crypto trading strategies. By incorporating moving averages, support and resistance levels, and divergence analysis, traders can gain deeper insights into market conditions and potential trade opportunities.
While the technical insights you’ve gained here lay a strong foundation, they’re not enough to ensure long-term success by themselves. Knowledge is power, but when coupled with the right strategies and tactics, it’s what transforms your edge into consistent profitability over the next few years.
At ParadiseFamilyVIP🎖️, we integrate technical analysis, on-chain insights, real-time sentiment monitoring, and a deep understanding of whale psychology with trading strategies that have been tested and proven. This combination allows us to make high-quality trading decisions and manage our portfolios for steady profitability.
👉To see membership availability in ParadiseFamilyVIP🎖️(Click it)
Transparency is key in everything we do. We share all of our trades, including entry points, exit points, and portfolio allocations, so you can follow our lead and achieve similar returns.