


Bitcoin Valuation Metric
In short
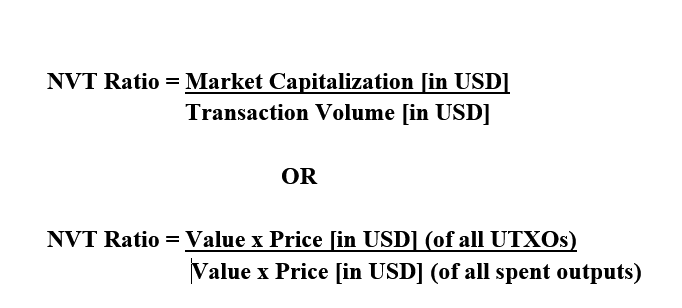
The Bitcoin NVT (Network Value to Transaction) Ratio is an on-chain indicator that assesses whether Bitcoin's price reflects legitimate growth or if it is over/underpriced. It is calculated by dividing Bitcoin's current network value (market capitalization) by the volume of Bitcoin transacted on its blockchain over the past 24 hours. This ratio helps investors understand the relationship between Bitcoin's market cap and its transaction volume.
While trying to make good investment decisions, traders and analysts across different financial markets have one or more strategies put in place. Some resort to the use of various indicators and ratios for determining the value of stocks, commodities, currencies, and other assets they interact with.
Stock traders usually adopt the price-to-earnings ratios (P/E) to make an informed decision. However, in crypto trading, a similar approach called Network value to transaction ratio (NVT) is applied. So, what is Bitcoin NVT Ratio?
Bitcoin NVT Ratio Explained
Bitcoin NVT Ratio is a useful on-chain indicator that helps investors to determine whether an increase in the price of Bitcoin at the time of analysis represents a legitimate growth or not. More explicitly, the NVT ratio indicates whether Bitcoin is overpriced or underpriced.
Moreover, the NVT ratio is the ratio of the current bitcoin’s network value or its market capitalization and the volume of bitcoin transacted through its blockchain in the last 24 hours. The idea of the Bitcoin NVT ratio was brought to life by a renowned crypto researcher and analyst known as Willy Woo.
How To calculate Bitcoin NVT Ratio
The two data required to calculate this ratio are; the current bitcoin network value (or its current market capitalization) & the volume of bitcoin transactions in USD over the past 24 hours. It can therefore be calculated as follows:
The calculated value might vary depending on where you obtain these data. Data on market capitalization is easily accessible on websites like Coinmarketcap, Coingecko, or any other price-tracking website. However, data on the transaction volume can be obtained from sites like bitcoin.com.
Interpreting Bitcoin NVT Ratio
To make a good investment decision, the correct interpretation of the Bitcoin NVT ratio becomes important. The value obtained can either be high or low. A high NVT value implies that the network valuation is improving faster than the transaction volume and is especially evident during the price bubble. Such high value could also represent real network growth.
A low NVT value, on the other hand, is accompanied by a higher number of transactions and a declining network value even though investors’ interest is growing.
Despite how useful the Bitcoin NVT value is, it cannot indicate or detect imminent crashes in the market. However, it becomes useful when differentiating between a trend reversal and a mere dip.
Let’s take a look at the general framework below as it provides more insight for the interpretation of results.
High NVT Ratios (Uptrends)
High NVT ratios are common during market uptrends or when bitcoin rallies and are considered bearish. During such periods, market capitalization growth outpaces on-chain transaction volume and this has been associated with local tops. Bitcoin is said to be overvalued when this happens.
Low NVT Ratios (Downtrends)
In contrast to high NVT ratios, low NVT ratios are evident during market downtrends and are considered bullish. It indicates that market cap growth is declining compared to transaction volume. However, this behavior has been associated with local bottoms and it is the best period to accumulate a crypto asset. Bitcoin is said to be undervalued when this happens.
Constant NVT Ratios (Sideways Trading)
Constant NVT Ratios show the existence of an equilibrium between the growth of market capitalization and transaction volume. Moreover, it suggests a sustainable market trend which is commonly seen at the start to the mid-stages of a trend, whether bullish or bearish. When this happens, it clearly shows the current market direction has been defined.
Historical Review Of Bitcoin NVT Ratio
Until the 2017 all-time high, the NVT ratio for bitcoin has been in the range of 2 and 30. Before this, however, there was a price bubble in 2013 when the NVT value of Bitcoin rose to 40.
Since a high NVT value for bitcoin is considered bearish, a price correction for a significant period played out. Also in 2017, the NVT value of the bitcoin network rose to about 33 following a local top while the indicator reset.
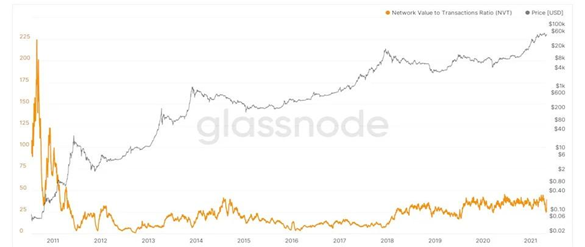
Quite for some time, bitcoin NVT value has been moving consistently between the value of 24 and 43. With such consistency, we could infer that there is a valid growth in the bitcoin network.
In March 2020, the chart indicated a plunge in NVT value to 24 which represented a long-term bottom. Of course, the same event also happened in late April 2020.
What is different here
Most guides stop at the theory. The MyCryptoParadise team shares the live trades, and the reasoning behind each one, inside ParadiseFamilyVIP. Everything here is education, not financial advice.
Crypto trading involves substantial risk and is not suitable for everyone. Nothing here is financial advice; it is education only. Never risk more than you can afford to lose.


Join the discussion
No comments yet. Pro Paradiser members, share how you are reading this.