





Technical Analysis Patterns
In short
The Head and Shoulders pattern in crypto trading is a bearish reversal pattern formed by three peaks: a highest middle peak (head) and two lower peaks (shoulders). It is used when a strong uptrend is present, a clear support level is defined, and higher volume is observed on the left shoulder and head compared to the right shoulder. Confirmation occurs when the price breaks below the support level, signaling a potential downtrend.
The head and shoulders pattern is formed by three distinct peaks, with the middle peak being the highest. The other two peaks are slightly lower, known as the left shoulder, head, and right shoulder. The pattern is confirmed when the price breaks below the support level, and traders often take a short position at this point.
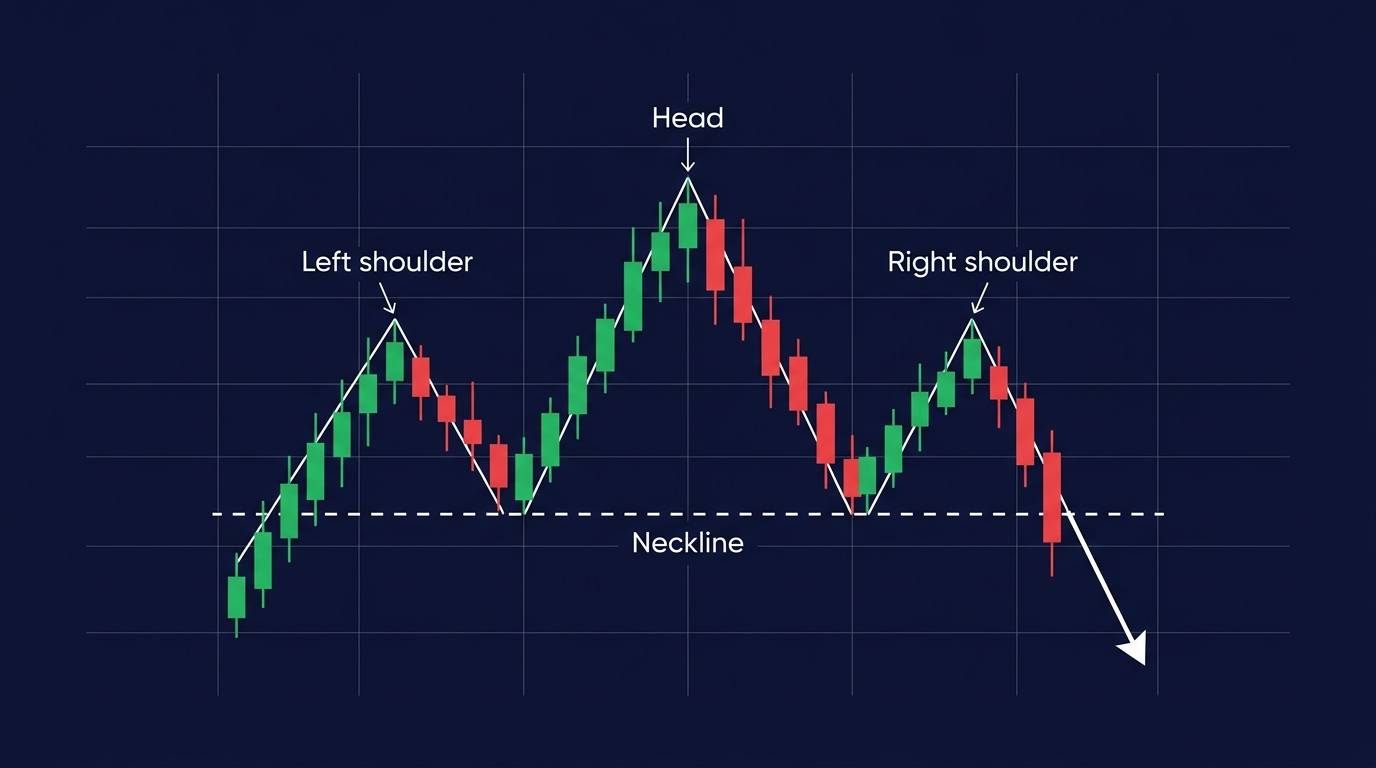
To effectively apply this pattern, traders should look for a strong uptrend. In addition, they look for a clearly defined support level, and higher volume on the left shoulder and head. The volume described is usually higher than that of the right shoulder. Traders may also use technical indicators, such as moving averages and the relative strength index, to help confirm the pattern and identify potential entry and exit points.
Variations: Head and Shoulders Pattern, Inverse Head and Shoulders Pattern
When to Trade the Regular Head and Shoulders Pattern
Traders who take a short position after confirming the pattern may set a stop-loss order above the right shoulder to limit their losses if the price moves against them. Overall, understanding the technical details of the head and shoulders pattern can help traders make informed trading decisions in the dynamic world of crypto trading.
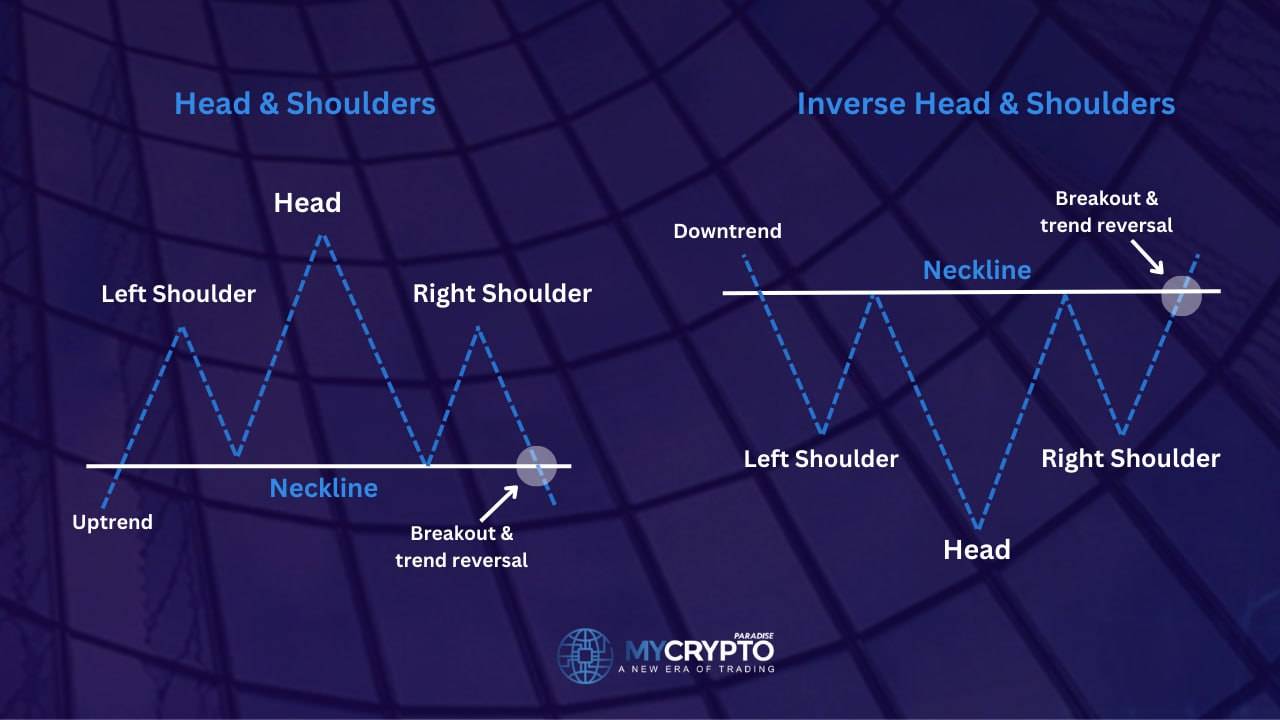
Traders typically look for the head and shoulders pattern in crypto trading when they are trying to identify a potential reversal in an uptrend. The pattern has three distinct peaks, with the middle peak being the highest and the other two peaks slightly lower, known as the left shoulder, head, and right shoulder.
Traders usually begin by looking for a strong uptrend in the market and then identifying a clearly defined support level. If the price reaches this support level and bounces back up, forming the left shoulder, traders will then look for the price to rise again, forming the head, which should be higher than the left shoulder.
After the head of the pattern forms, the price will typically drop back down to the support level again, forming the right shoulder, which should be roughly the same height as the left shoulder. Once the right shoulder is forms, traders looks for the price to break below the support level, which confirms the pattern and signals a potential trend reversal.
When traders identify a confirmed head and shoulders pattern, they may take a short position, with a stop-loss order placed above the right shoulder to limit potential losses. Overall, traders use the head and shoulders pattern as a reliable and popular pattern to identify potential reversals in an uptrend and make informed trading decisions in the dynamic world of crypto trading
When Traders Use the Inverse Head and Shoulders Pattern
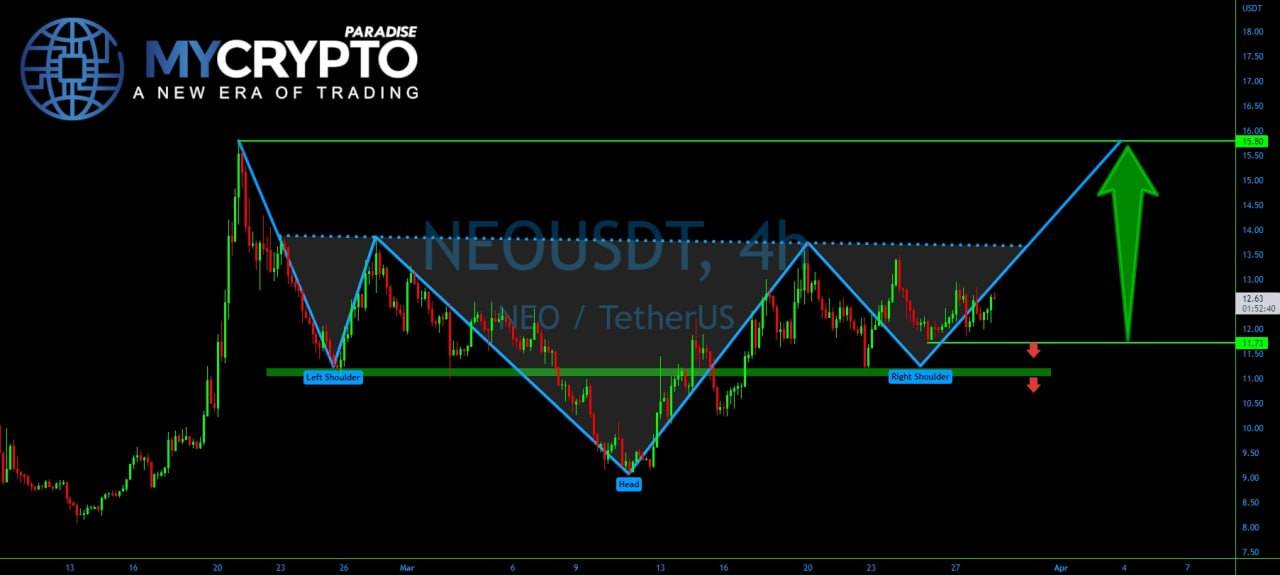
Traders use the inverse head and shoulders pattern in crypto trading to identify potential reversals in a downtrend. The inverse head and shoulders pattern is essentially the mirror image of the regular head and shoulders pattern. Instead of three peaks, the pattern consists of three distinct troughs, with the middle trough being the lowest and the other two troughs slightly higher, known as the left shoulder, head, and right shoulder.
To effectively apply the inverse head and shoulders pattern, traders should look for a strong downtrend and a clearly defined resistance level. If the price reaches this resistance level and bounces back down, forming the left shoulder, traders will then look for the price to drop again, forming the head, which should be lower than the left shoulder.
After the head forms, the price typically rises back up to the resistance level again, forming the right shoulder, which should be roughly the same height as the left shoulder. Once the right shoulder forms, traders watch for the price to break above the resistance level, which confirms the pattern and signals a potential trend reversal.
When traders identify a confirmed inverse head and shoulders pattern, they may take a long position, with a stop-loss order placed below the right shoulder to limit potential losses. Traders may also use technical indicators, such as moving averages and the relative strength index, to help confirm the pattern and identify potential entry and exit points.
Crypto trading involves substantial risk and is not suitable for everyone. Nothing here is financial advice; it is education only. Never risk more than you can afford to lose.










Join the discussion
No comments yet. Pro Paradiser members, share how you are reading this.