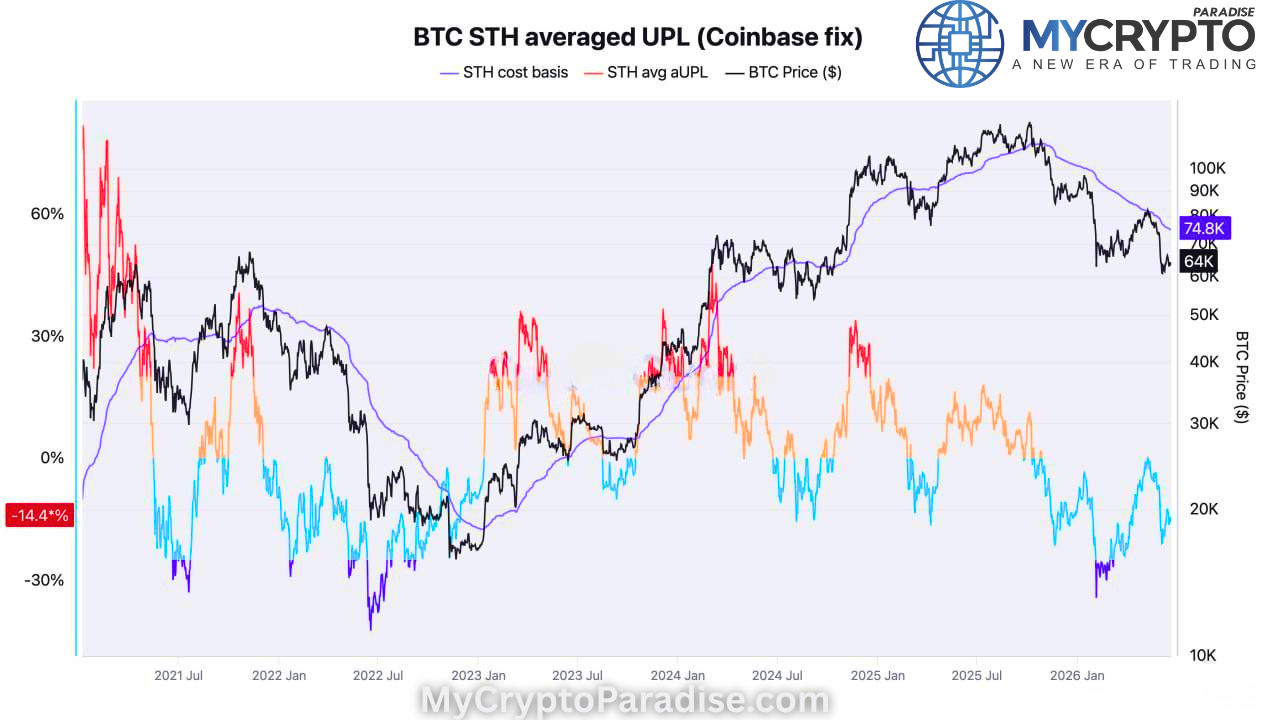
A broadening triangle, also called an expanding triangle or megaphone pattern, is a chart formation where two trendlines diverge in opposite directions, creating a widening price range. Higher highs and lower lows reflect rising volatility and indecision. Traders typically treat it as a continuation pattern and trade a confirmed, volume-backed breakout above or below its boundary.
The broadening triangle is a technical analysis chart pattern that provides valuable insights into market dynamics and potential price movements. In this article, we will explore the concept of a broadening triangle, its characteristics, and how traders can effectively utilize it in their crypto trading strategies.
Understanding the Broadening Triangle
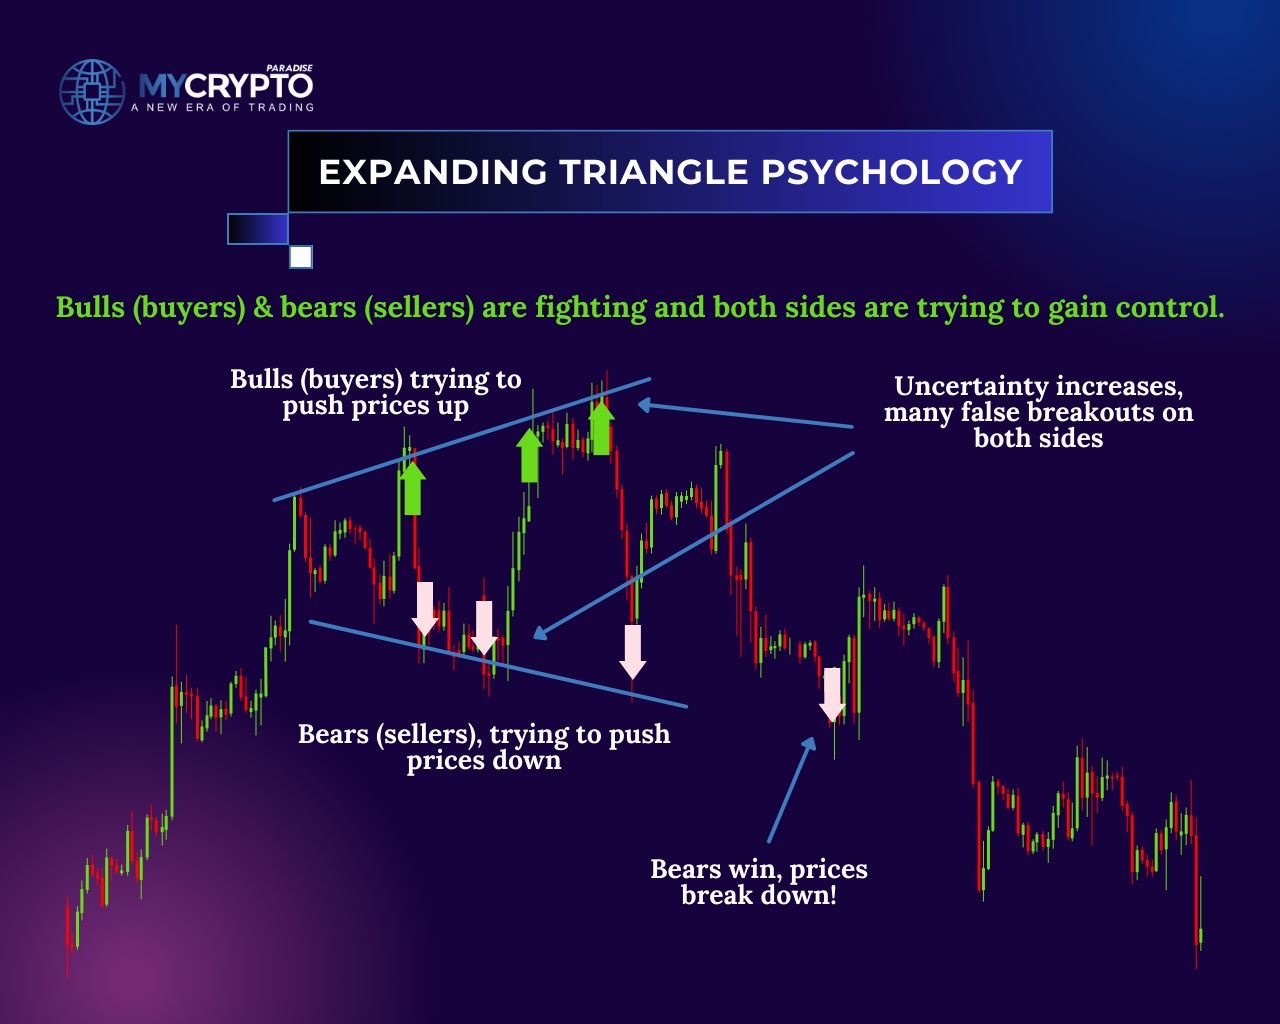
The broadening triangle, also known as the expanding triangle or megaphone pattern, is a relatively rare but significant pattern that occurs during volatile market conditions. It is formed by two converging trendlines that expand in opposite directions, creating a widening price range. The upper trendline connects a series of higher highs, while the lower trendline connects a sequence of lower lows. This pattern signifies increasing volatility and uncertainty in the market.
Top Trading Signals to Look Out for in a Broadening Triangle Pattern
Volatility Expansion: The most prominent feature of a broadening triangle is the expanding price range. As the pattern progresses, the difference between the higher highs and lower lows becomes wider, indicating an increase in volatility. The expanding nature of the pattern often reflects a battle between buyers and sellers, resulting in larger price swings.
Diverging Trendlines: The two trendlines that form the broadening triangle move in opposite directions. The upper trendline connects the swing highs, while the lower trendline connects the swing lows. This divergence indicates a lack of consensus among market participants, leading to a wider price range.
Increasing Volume: Broadening triangles are often accompanied by an increase in crypto trading volume. As the pattern develops, more traders become aware of the market uncertainty, leading to heightened activity and larger volume. The surge in volume confirms the significance of the pattern and suggests the potential for a strong breakout.
Timeframe: Broadening triangles are characterized by a longer duration compared to other chart patterns. It may take several weeks or even months for the pattern to fully develop. Traders need to exercise patience and closely monitor price movements to identify precise entry and exit points.
Trading Strategies Using Broadening Triangles
Breakout Strategy: Broadening triangles are typically continuation patterns, meaning that they suggest a continuation of the previous trend. Traders can employ a breakout strategy by waiting for a decisive breakout above the upper trendline (bullish breakout) or below the lower trendline (bearish breakout). Ideally, a breakout should be accompanied by a surge in trading volume to validate the move.
Confirmation Indicators: To enhance the reliability of broadening triangles, traders can use additional technical indicators. For instance, the Relative Strength Index (RSI) can help identify overbought or oversold conditions, providing confirmation for potential breakouts. Similarly, moving averages or trend-following indicators can help filter out false signals.
Pattern Failure: While broadening triangles are considered reliable patterns, they can occasionally fail. Traders should be aware of the possibility of pattern failure and have a contingency plan in such situations. Be prepared to exit the trade or adjust your strategy if the price fails to follow the expected breakout direction.
How to Properly Set up the Entry Level, Stop Loss, and Take Profit Levels When Trading Broadening Triangle
Setting the entry, take-profit, and stop-loss levels in broadening triangle trading requires careful consideration of the pattern’s characteristics and the trader’s risk tolerance. Here are some guidelines to help you set these levels effectively:
Entry Level
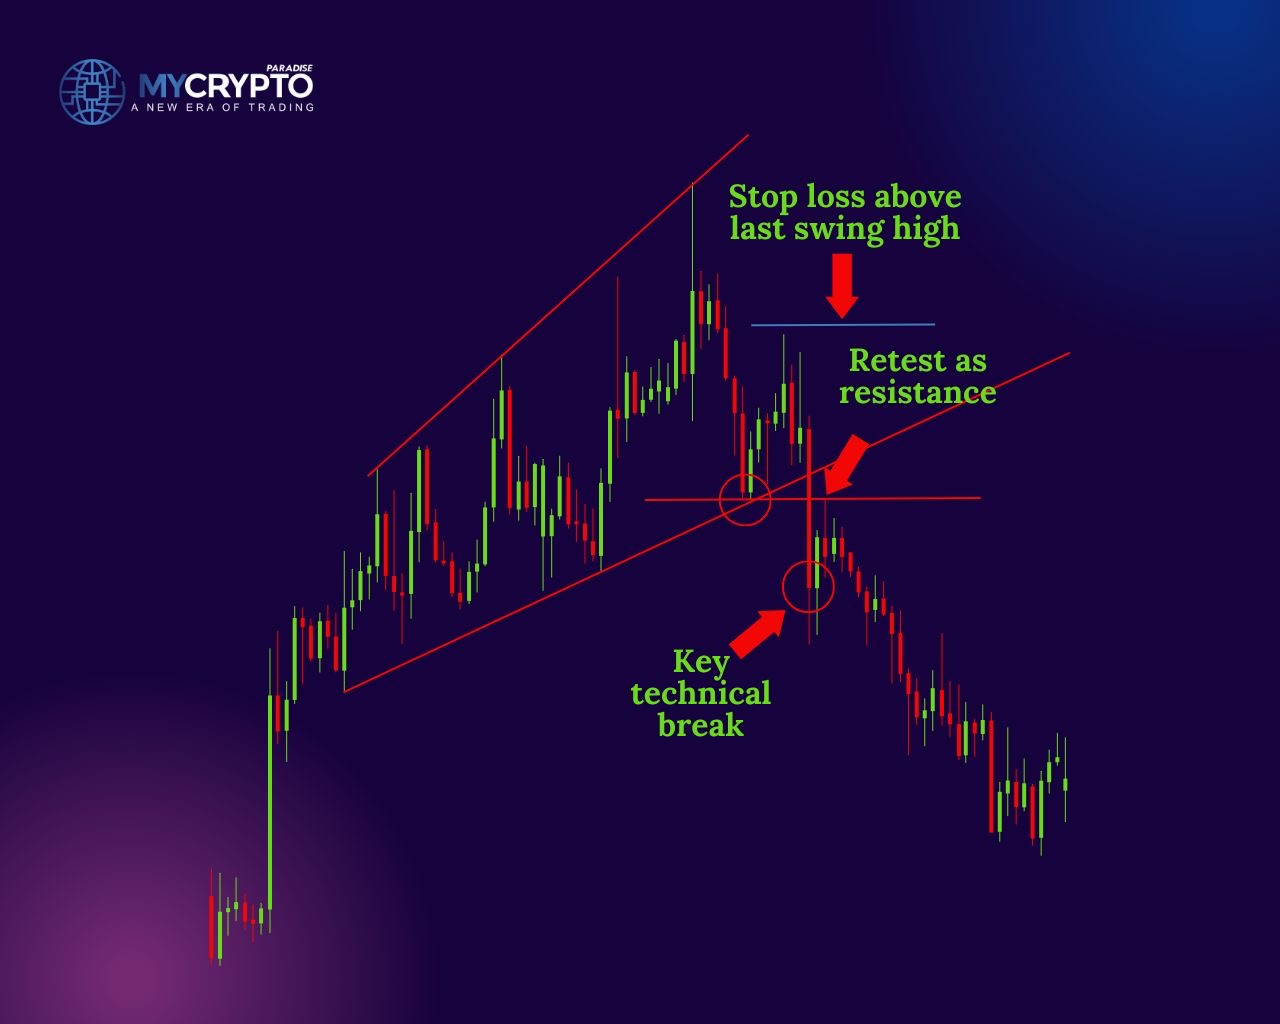
– Wait for Confirmation: It is generally advisable to wait for a confirmation signal before entering a trade based on a broadening triangle. This confirmation can be in the form of a breakout above the upper trendline for a bullish trade or a breakout below the lower trendline for a bearish trade.
– Consider Volume: Look for a breakout with a significant increase in trading volume. Higher volume during the breakout strengthens the validity of the pattern and suggests stronger market participation.
– Price Confirmation: Wait for a candlestick close above the upper trendline (for a bullish trade) or below the lower trendline (for a bearish trade) to confirm the breakout.
Take-Profit Level
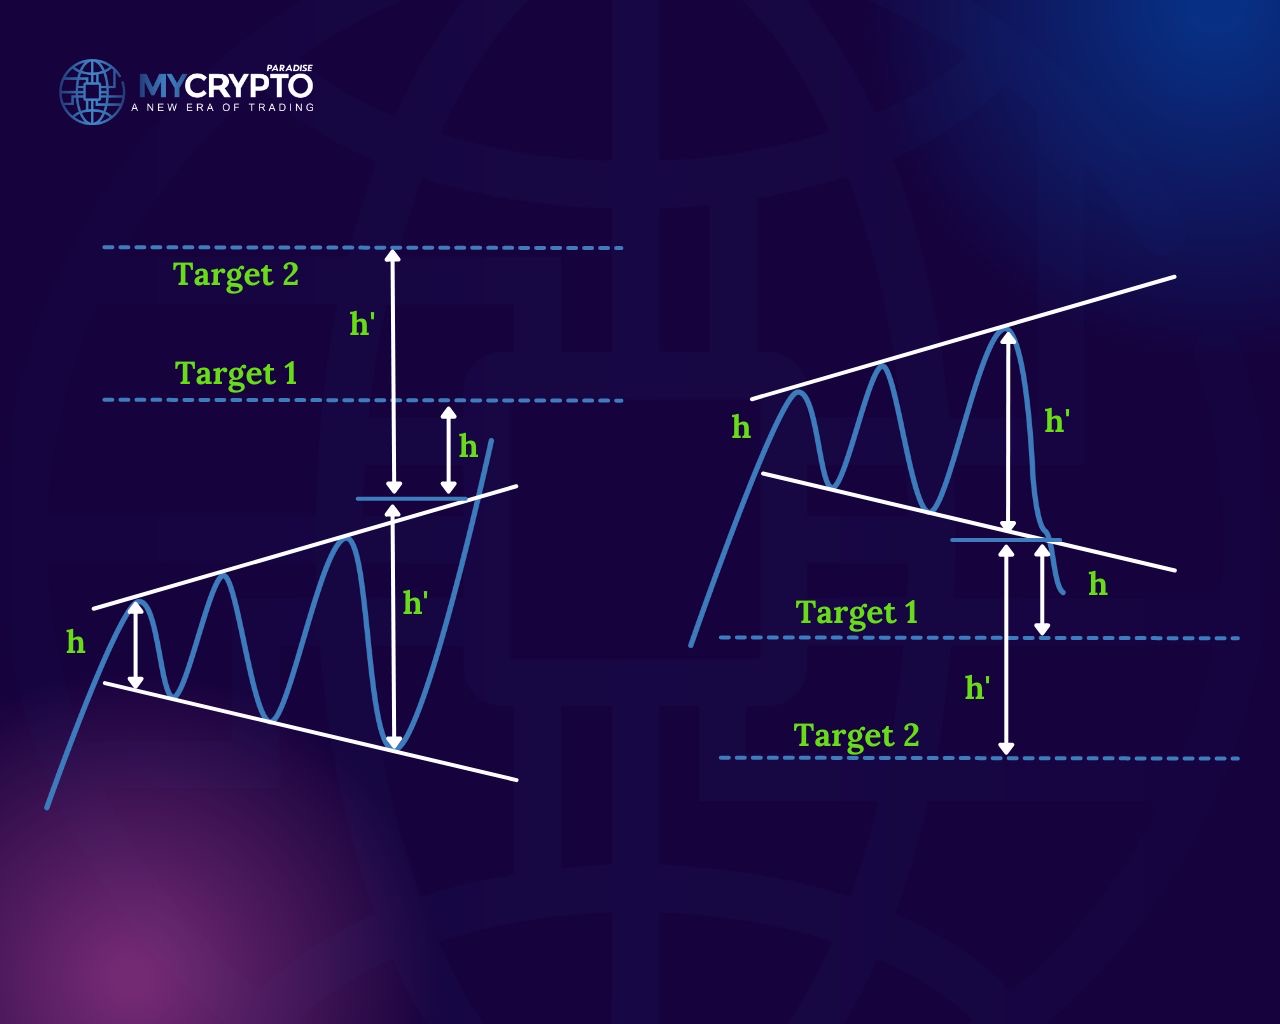
– Measuring the Pattern: Measure the height of the broadening triangle from the highest high to the lowest low. Once a breakout occurs, project this distance in the direction of the breakout. This projected distance can give you an estimate of the potential price target.
– Multiple Targets: Consider setting multiple take-profit levels at different points along the projected distance. This allows you to secure profits incrementally as the price moves in your favor. Traders often use Fibonacci retracement levels or previous support/resistance levels as additional take-profit targets.
Stop-Loss Level:
– Outside the Pattern: Place your stop-loss order slightly outside the broadening triangle to account for potential false breakouts or price retracements. The distance from the pattern’s boundaries depends on your risk tolerance and the market’s volatility. Placing the stop-loss too close to the pattern may result in premature stop-outs, while setting it too far away increases the risk.
– Support/Resistance Levels: Identify key support or resistance levels outside the pattern that align with your risk management strategy. Placing the stop-loss just below (for a bullish trade) or above (for a bearish trade) these levels can help protect your capital in case the breakout fails and the price reverses.
Adjustments and Trailing Stops:
– Pattern Failure: Be aware that broadening triangles can occasionally fail, resulting in false breakouts or erratic price movements. If the price fails to follow the expected breakout direction or the pattern becomes invalidated, consider exiting the trade or adjusting your strategy accordingly.
– Trailing Stop: As the trade progresses and the price moves in your favor, consider implementing a trailing stop-loss strategy. This involves adjusting the stop-loss level to lock in profits and protect against potential reversals. Trailing stops can be placed below swing lows (for a bullish trade) or above swing highs (for a bearish trade).
Probabilities that a Broadening Triangle Trading Signal will Result in Profits
It’s important to note that no top trading signal guarantees a specific outcome, and trading involves inherent risks. However, understanding the probabilities and employing proper risk management techniques can help improve your chances of success. Here are some considerations:
Volume Confirmation: Volume plays a vital role in confirming the validity of the breakout in a broadening triangle pattern. Higher trading volume accompanying a breakout suggests increased market participation and strengthens the probability of a favorable trade. Traders should look for volume confirmation to support their decision-making process.
Timeframe Considerations: When broadening triangle forms on longer timeframes, such as daily or weekly charts, there is potentially higher probability of a profitable outcome compared to patterns on shorter timeframes, such as intraday charts. It’s important to align your trading strategy with the timeframe that suits your trading style and objectives.
Confirmation Indicators: Indicators such as the Relative Strength Index (RSI), moving averages, or other trend-following indicators can provide supplementary signals. These indicators can help traders assess overbought or oversold conditions, trend strength, or potential price reversals, enhancing the overall probability of a successful trade.
It’s important to note that probabilities are not fixed and can vary from trade to trade. Each trade should be evaluated individually based on the specific market conditions and factors at the time. Successful trading requires consistent analysis, continuous learning, and adaptability to changing market dynamics.
Speaking of successful trading, you can get free updates and analyses from MyCryptoParadise, stay on top of the crypto markets on trending cryptocurrencies like BTC and ETH. We also offer secret insights and market updates for free on our Telegram channels. Join them below:
Conclusion
The broadening triangle is a unique chart pattern that crypto traders can utilize to identify potential trading opportunities. Its expanding price range and increasing volatility provide valuable insights into market dynamics.
The technical knowledge you’ve gained from this educational article is valuable, but on its own, it won’t make you consistently profitable in the long term. While this knowledge can provide you with an edge when applied effectively, transforming it into consistent profitability over the next 3+ years requires integrating it with the right trading strategies and tactics.
At ParadiseFamilyVIP🎖️, we combine technical analysis, on-chain insights, sentiment monitoring, and a deep understanding of whale psychology with tested trading strategies to make informed trading decisions. This approach enables us to provide the best crypto signals and portfolio management for long-term success.
👉To check the availability in ParadiseFamilyVIP🎖️ (Click it)
Since our services are premium, they may not be suitable for those without sufficient trading capital. If that’s the case, we recommend starting with our FREE Telegram channels to build your skills and trading capital.
Broadening Triangle FAQ
What is a broadening triangle pattern?
It is a chart pattern formed by two diverging trendlines that expand in opposite directions, producing a widening price range. The upper line connects higher highs and the lower line connects lower lows, signaling increasing volatility and market uncertainty.
Is a broadening triangle bullish or bearish?
It is usually treated as a continuation pattern, so it tends to favor the prior trend. Direction is confirmed by the breakout: a close above the upper trendline points bullish, while a close below the lower trendline points bearish.
How do you set a profit target on a broadening triangle?
Measure the height of the pattern from its highest high to its lowest low, then project that distance from the breakout point in the breakout direction. Many traders also set multiple targets using Fibonacci levels or prior support and resistance.
Where should the stop-loss go when trading this pattern?
Place the stop-loss slightly outside the pattern boundary to allow for false breakouts and retracements, ideally beyond a nearby support or resistance level. As price moves in your favor, a trailing stop below swing lows (long) or above swing highs (short) helps protect gains.
Crypto trading involves substantial risk of loss. This article is educational and is not financial advice. Past performance does not guarantee future results. Always do your own research.