
- The Gartley Harmonic Pattern is a structured four-leg formation that signals a temporary correction within a dominant trend.
- Each leg must align with specific Fibonacci ratios, most notably a 61.8% retracement for AB and a 78.6% retracement for XA at point D, to confirm a valid Gartley setup.
- When timed correctly, the pattern offers defined entry, stop-loss, and take-profit levels, giving traders a disciplined framework for executing high-probability trades.
The Gartley Harmonic Pattern is one of the most reliable setups in crypto technical analysis. Built around precise Fibonacci ratios, it offers traders a disciplined way to spot potential reversals within ongoing trends, without chasing the market. This structured pattern combines geometry, timing, and market psychology into a repeatable four-leg formation that helps traders enter high-probability trades with clear rules.
In this guide, you’ll learn how to identify a valid Gartley pattern, confirm its structure using Fibonacci levels, and trade it with defined entry, stop-loss, and take-profit strategies. Whether you’re navigating a bullish pullback or a bearish pause, the Gartley offers a proven roadmap for trend continuation setups in crypto.
What is the Gartley Harmonics pattern?
The Gartley harmonics pattern is a four-leg harmonic formation marked by five points: X, A, B, C, and D. It’s a variation of the classic ABCD pattern, with the key difference being that the first leg (X to A) sets the overall market trend. The pattern helps traders spot a temporary pullback before the trend continues.
This setup was first introduced by H.M. Gartley in the 1930s, who noticed that market movements often repeat in waves and follow predictable Fibonacci ratios. By identifying these patterns, traders could better anticipate when a trend is likely to pause and resume.
Each leg of the pattern follows specific Fibonacci levels, with the final CD leg typically ending near the 78.6% retracement of the XA move. Whether bullish or bearish, the Gartley helps highlight where momentum may be slowing, offering a structured opportunity to rejoin the trend with defined entry, stop, and target zones.
Structure of the Gartley Pattern
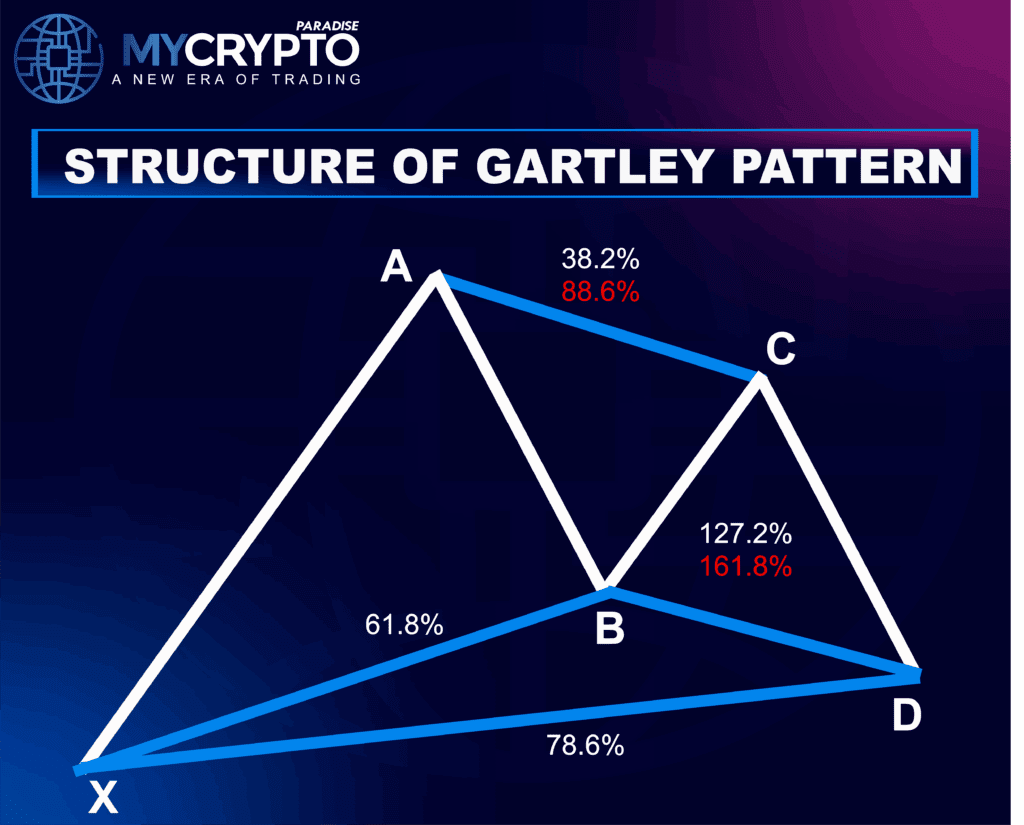
The Gartley pattern is built from four price legs: X-A, A-B, B-C, and C-D. Each leg follows a specific Fibonacci relationship, forming a symmetrical setup that signals the market may be gearing up to continue its original trend.
Wave Breakdown
- X-A: The impulse leg that sets the dominant direction, either up or down.
- A-B: A retracement of the XA move, typically pulling back to around 61.8%.
- B-C: A counter move, retracing 38.2% to 88.6% of AB.
- C-D: The final leg, which completes near the 78.6% retracement of XA and marks the potential entry zone.
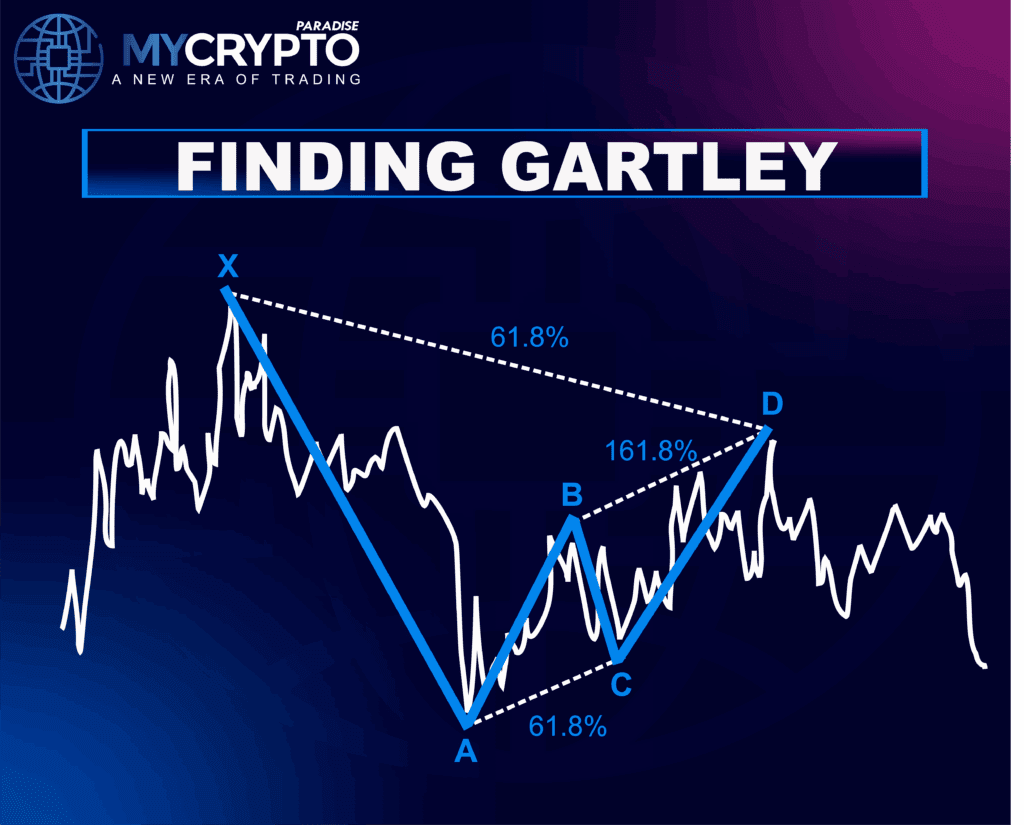
How to Spot a Gartley Pattern
To identify a Gartley, start by looking for a clear initial trend followed by a structured ABCD correction within it.
The pattern forms in two main variations: bullish (trend resumes upward) and bearish (trend resumes downward).
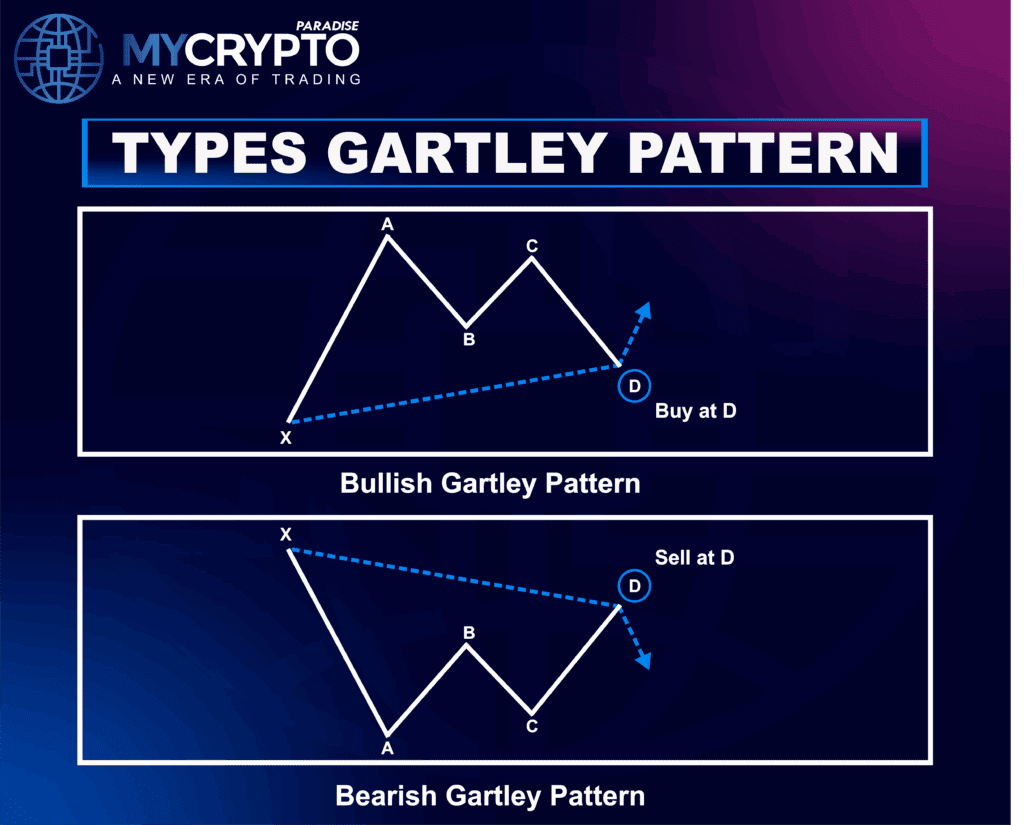
Bullish Gartley
- The move begins with the price rising from X to A.
- Price retraces downward to form AB.
- The trend temporarily resumes upward for BC.
- Then one final retracement finishes the pattern at CD.
Bearish Gartley
- The move begins with the price falling from X to A.
- Price bounces upward at AB.
- The downtrend resumes with BC.
- One final push upward completes the pattern at CD.
Confirming a Valid Gartley Pattern
Not every pattern that looks like a Gartley is worth trading. To separate high-probability setups from weak ones, traders rely on two key factors: Fibonacci alignment and time symmetry.

Aligning with Key Fibonacci Levels
For a Gartley harmonics pattern to be valid, its legs must align with key Fibonacci levels that define the structure.
The full move from X to D should retrace around 61.8% or 78.6% of the XA leg. This is the primary completion zone where the pattern is expected to trigger.
Within the pattern, the BC leg should pull back 61.8% or 78.6% of AB, maintaining harmonic balance. The final leg, CD, typically extends to 127.2% or 161.8% of the AB move, providing the ideal area to anticipate a reversal or continuation.
These precise measurements give traders confidence in identifying real Gartleys and filtering out patterns that don’t meet structural criteria.
Respecting Time Symmetry
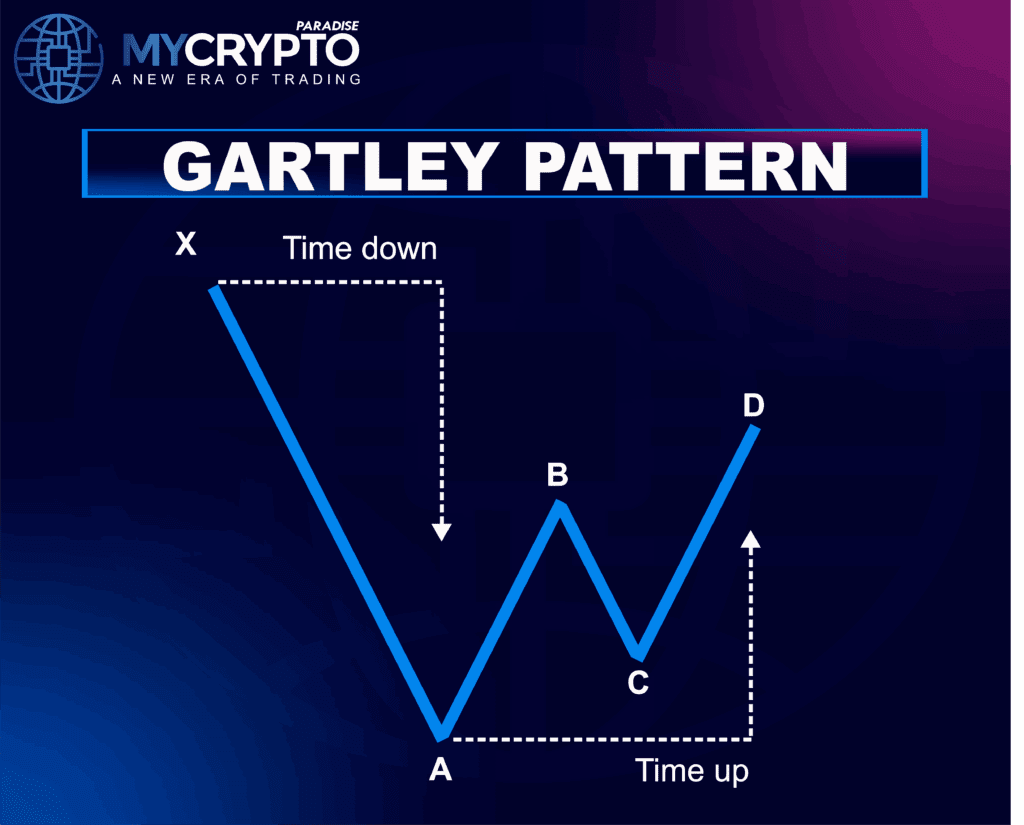
A clean Gartley doesn’t just rely on price; it respects time as well. The time it takes for the XA leg to form should be roughly equal to the time between A and D. This symmetry reflects a balanced correction.
Alternatively, the ABCD portion of the pattern may follow a Fibonacci-based time ratio relative to XA, commonly 61.8%, 100%, or 161.8%.
Maintaining this timing rhythm helps validate the pattern and avoid chasing incomplete or forced setups.
Why is the Gartley Pattern Important?
The Gartley Pattern is important because it captures a moment when the market takes a structured breather, without losing trend control. It shows that the price isn’t reversing, just resetting through a precise correction.
Rather than chasing breakouts or reacting to noise, traders use the Gartley to spot high-probability entry zones backed by Fibonacci logic. It brings structure to volatility and helps filter out weak setups. When a Gartley completes, it often leads to a sharp move in the direction of the original trend, giving crypto traders a technical edge with timing and risk control.
How to Trade the Gartley Pattern Step by Step
Once a Gartley pattern checks out with the right Fibonacci levels and timing, it’s time to turn the setup into a trade. Here’s how to handle both the entry and the exit.
Entry Strategy
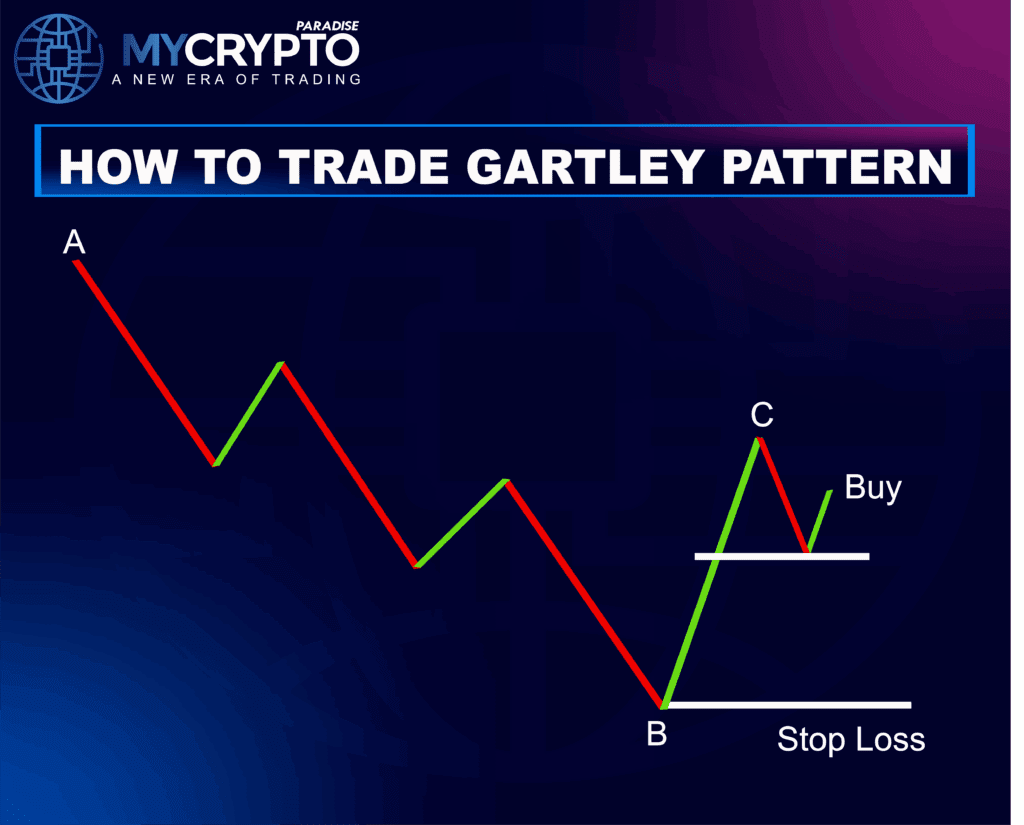
In a bullish Gartley, the market usually drops sharply in the AB leg, then starts to slow down as selling pressure fades and volume dries up. That’s when buyers begin stepping in, creating the BC bounce, often with stronger volume.
The ideal buy entry happens during the CD leg, when the price pulls back about 33% to 50% of the BC leg. This area often acts as support, especially if the volume is lower again, signaling reduced selling strength.
Another chance to enter is when the price breaks above point C, which may complete a classic pattern like an Inverse Head & Shoulders or Double Bottom, both of which are known for signaling a strong trend reversal.
Exit Strategy
Every trade needs protection, and for Gartley, the stop-loss goes just below point B. If the price breaks this level, it usually means the pattern has failed.
To take profit, measure the height of the BC leg and project it upward from point C. That gives you a realistic target based on the pattern structure. For extra safety, you can use a trailing stop.
When executed well, the Gartley pattern offers structure, timing, and precision; missteps usually come not from the setup, but from how it’s traded. At ParadiseFamilyVIP 🎖️, we take Gartley setups further, combining them with real-time signals, portfolio support, and on-chain insights to help you trade with clarity and discipline. 👉 Check availability here (Click it).
Common Mistakes to Avoid When Trading the Gartley Harmonics Pattern
Even the cleanest Gartley setups can fail if executed poorly. These are the most common traps traders fall into, and how to sidestep them effectively.
Misidentifying the Pattern: Traders often confuse Gartleys with similar patterns like the Bat or Butterfly. To avoid this, confirm that AB retraces around 61.8% of XA, and that CD ends near the 78.6% mark of the XA leg. Without these levels, the structure isn’t valid.
Entering Too Early: Many jump in the moment the price reaches point D, but that’s risky. Wait for added confirmation like a bullish candlestick, RSI divergence, or MACD cross. These signals increase the odds that a real reversal is beginning, not just a bounce.
Incorrect Stop-Loss Placement: Stops placed just beyond point D often get hit by normal market noise. A safer approach is setting the stop beyond point X, ideally using the ATR to give the trade breathing room. This avoids premature exits on otherwise solid setups.
Ignoring Market Context: A technically perfect Gartley can still fail in the wrong conditions. Don’t trade into a major news event or against a strong trend. Always consider the broader context on higher timeframes before executing the setup.
Poor Risk Management: Overleveraging or taking too much risk on a single pattern can quickly wipe out gains. Stick to risking 1–2% of your capital per trade and aim for a risk-to-reward ratio of at least 1:2. It’s the only way to stay consistent over time.
Unrealistic Profit Targets: Trying to ride the full move often backfires. Instead, take partial profits at the 38.2% or 61.8% retracement of the CD leg. Then use a trailing stop to lock in gains as the price continues higher, if momentum holds.
FAQs
What is the Gartley Harmonic Pattern in crypto trading
The Gartley Harmonic Pattern is a four-leg structure based on Fibonacci ratios that signals a temporary correction within a dominant trend. It helps traders identify high-probability reversal zones with well-defined entry and exit levels.
Why is the Gartley pattern important for PRO crypto traders?
It provides a structured way to trade pullbacks without chasing breakouts. By relying on Fibonacci precision and geometric balance, the Gartley helps traders spot low-risk entries just before momentum returns to the trend.
How do I know if a Gartley setup is valid?
A valid Gartley pattern must meet key Fibonacci rules: AB should retrace about 61.8% of XA, and CD should end near the 78.6% retracement of XA. The CD leg should also align with a 127.2%–161.8% extension of BC, confirming harmonic balance.
When is the best time to enter a Gartley trade?
The ideal entry comes at point D, after the CD leg completes and volume drops. For added confirmation, traders often look for a reversal candlestick pattern or a signal from RSI or MACD before entering the trade.
What’s the most common mistake traders make with the Gartley pattern?
The biggest mistake is entering too early or mislabeling the structure. Without proper Fibonacci alignment and time symmetry, what looks like a Gartley might be a weaker setup, or not a harmonic pattern at all.
Conclusion
The Gartley Harmonic Pattern gives crypto traders a structured, reliable method for identifying reversals within active trends. With its strict Fibonacci ratios and visual clarity, the pattern removes guesswork and brings discipline to volatile markets.
But knowing the Gartley pattern is just one piece of the puzzle. Trading crypto like a professional means having a complete system, one that combines technical structure with risk management, emotional discipline, and a clear strategy.
That’s exactly what we deliver inside ParadiseFamilyVIP 🎖️. Our team uses proven setups like the Gartley pattern, backed by on-chain data, sentiment analysis, and whale tracking, to provide elite crypto signals with real-time entry, exit, and portfolio management support.
Ready to trade with more structure and confidence?
👉 Check availability for ParadiseFamilyVIP 🎖️(Click it)
If spots are full, join the waiting list to reserve your place in the next opening.
New to structured trading? Our free Telegram channels are the perfect place to learn, grow, and connect with a serious community of traders.


