In the dynamic world of crypto trading, staying ahead of the curve requires more than just luck; it demands a deep understanding of market signals and patterns. One such powerful tool that can give you a significant edge is Exaggerated Divergences. Often overlooked, these divergences offer clear indications of potential market reversals and help you make informed decisions.
In this comprehensive guide, we will explore the nuances of Exaggerated Divergences, differentiate them from other types of divergences, and provide actionable strategies to trade them effectively. Whether you’re a novice or a seasoned trader, learning Exaggerated Divergences can enhance your crypto trading success in the volatile market.
What Are Exaggerated Divergences?
Exaggerated Divergences, also known as Class B divergences, are a specific type of divergence used in technical analysis to predict potential market reversals. These divergences occur when the price forms equal highs or lows, while the corresponding technical indicator forms higher lows or lower highs, respectively.
Unlike regular or hidden divergences, exaggerated divergences highlight a weakening trend with a strong hint of an impending reversal.
To put it simply, exaggerated divergences signal that the current market momentum is losing steam. For instance, in a bullish exaggerated divergence, the price might form a double bottom, indicating a potential bullish reversal as the selling pressure diminishes.
Conversely, a bearish exaggerated divergence appears when the price forms a double top and suggests a potential bearish reversal due to weakening buying pressure.
We will break down the exaggerated divergences further so you can spot them and make better trading decisions. But first, let’s understand the difference between classic divergences and exaggerated divergences.
What’s the Difference Between Classic and Exaggerated Divergences?
Divergences play a vital role in technical analysis and act as reliable indicators for potential market shifts. However, understanding the nuances between different types of divergences is crucial for effective trading. Classic divergences and exaggerated divergences, though similar in function, offer distinct signals that traders need to interpret accurately.
Classic Divergences:
Occur when the price movement of an asset diverges from an oscillator or indicator, such as the Relative Strength Index (RSI) or Moving Average Convergence Divergence (MACD). They signal potential reversals in the current trend:
- Bullish Classic Divergence: This happens when the price forms lower lows while the indicator forms higher lows. This suggests that bearish momentum is weakening and points towards a possible bullish reversal.
- Bearish Classic Divergence: It occurs when the price forms higher highs while the indicator forms lower highs. This indicates bullish momentum is fading and hints at a potential bearish reversal.
The primary difference lies in the formation of price levels. Classic divergences involve distinct higher highs or lower lows in price whereas exaggerated divergences are marked by equal highs or lows in the price chart.
This subtle distinction is critical as exaggerated divergences often provide clearer and more straightforward signals for crypto trading. You can easily identify and trade exaggerated divergences.
By mastering classic and exaggerated divergences, you can develop a more robust analytical framework and enhance your ability to predict market movements.
What are the Types of Exaggerated Divergences?
Exaggerated Divergences are invaluable tools in a trader’s arsenal because they provide insights into potential market reversals. These divergences come in two primary forms: Exaggerated Bullish Divergence and Exaggerated Bearish Divergence. Once you understand these types and their implications, it can significantly enhance your trading strategy.
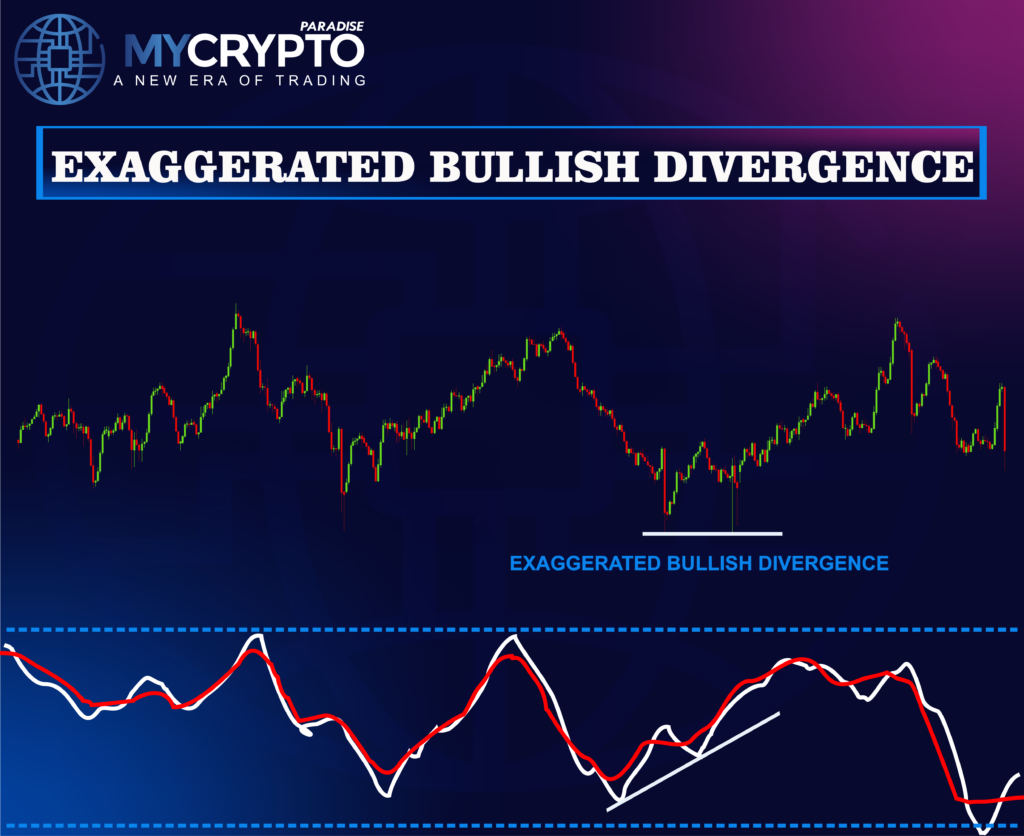
Exaggerated Bullish Divergence
Exaggerated Bullish Divergence occurs when the price of an asset forms equal lows, creating a double bottom pattern while the corresponding technical indicator, such as the RSI or MACD, forms higher lows.
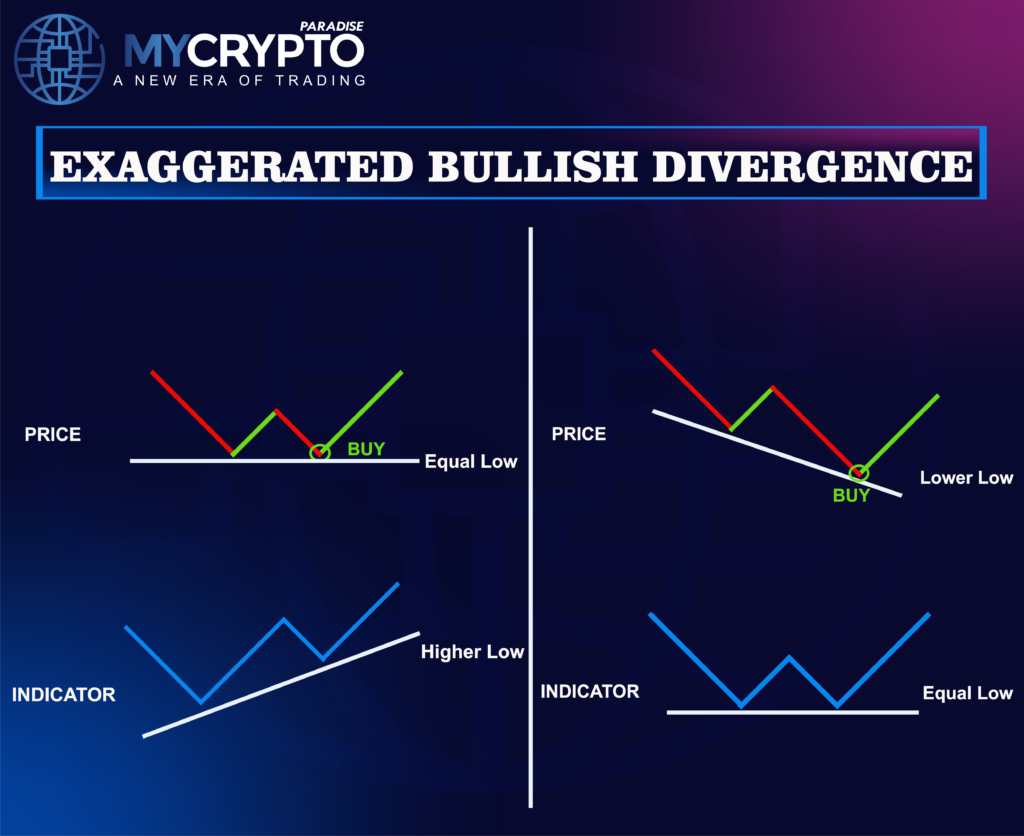
This divergence suggests that although the price is testing previous support levels, the underlying bearish momentum is weakening. The higher lows in the indicator reflect a diminishing selling pressure and signal a potential bullish reversal.
For example, if Bitcoin’s price hits $30,000 twice, creating a double bottom, but the RSI shows higher lows during these tests, it indicates that sellers are losing strength. Traders interpret this as a signal to prepare for a possible upward move and make it a perfect opportunity to enter a long position.
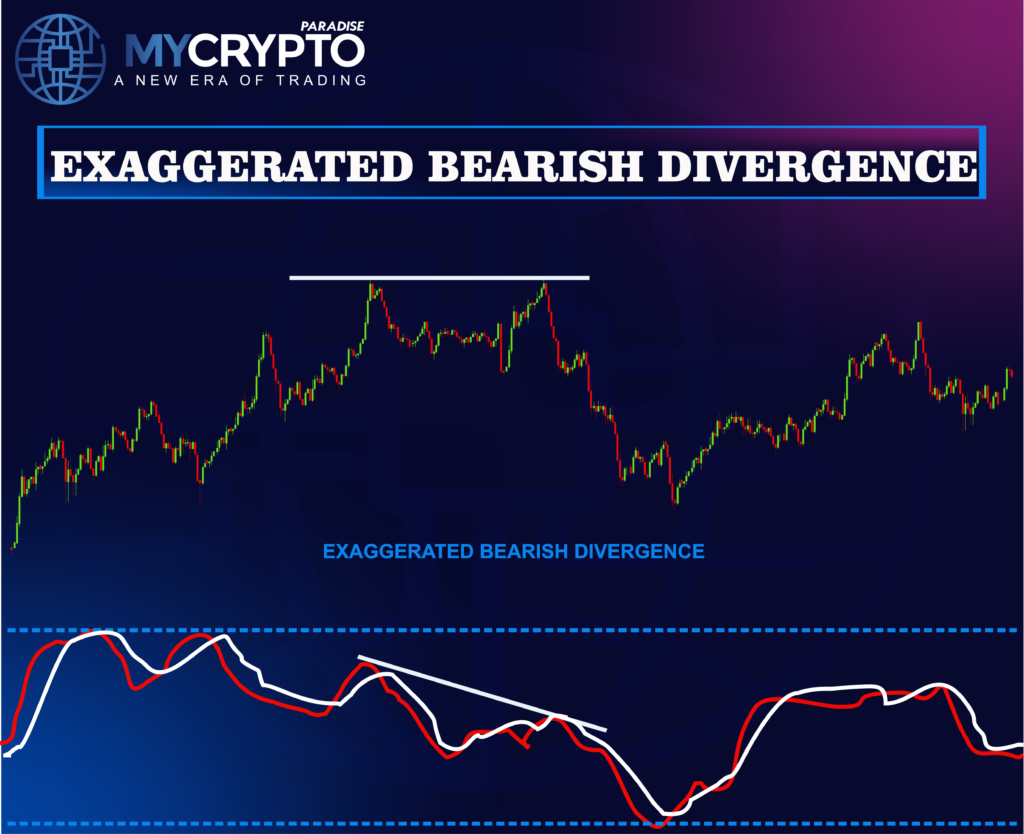
Exaggerated Bearish Divergence
Exaggerated Bearish Divergence, on the other hand, occurs when the price forms equal highs, resulting in a double top pattern while the technical indicator forms lower highs.
This pattern indicates that the underlying bullish momentum is fading despite the price reaching the same resistance level twice. The lower highs in the indicator reflect a reduction in buying pressure and suggest a potential bearish reversal.
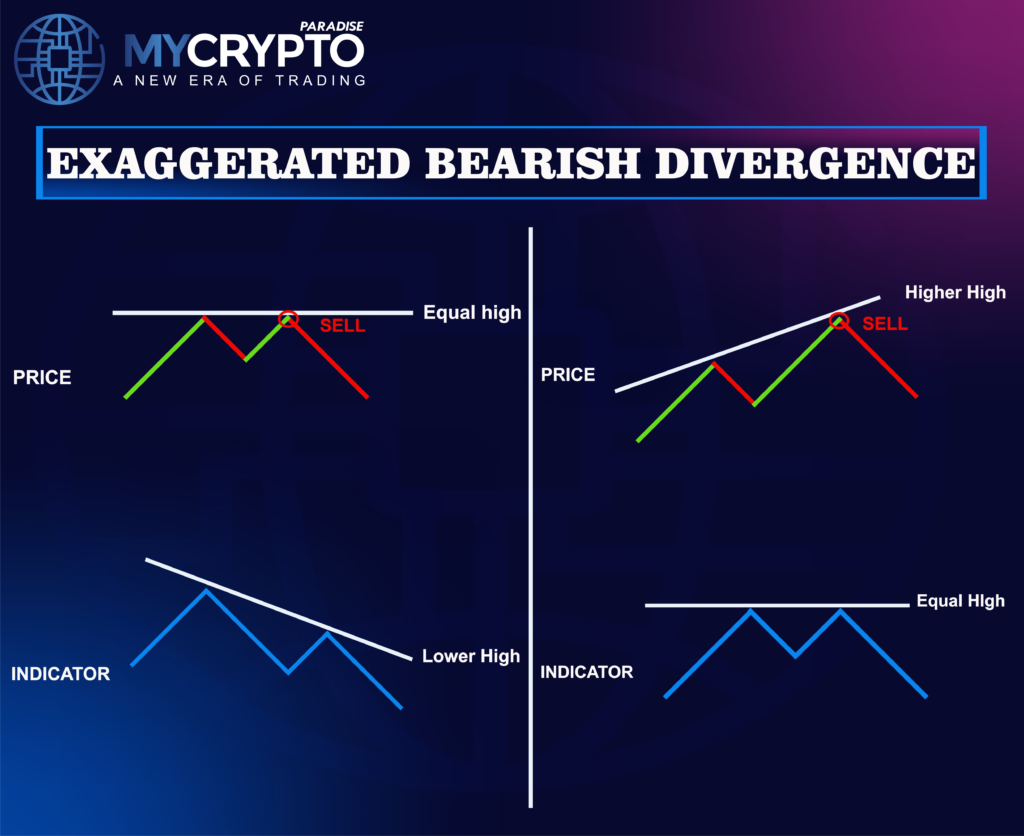
For instance, if Ethereum’s price hits $2,000 twice, creating a double top, but the MACD shows lower highs during these peaks, it signals that buyers are losing strength. You can view this as a cue to anticipate a downward move and consider opening short positions.
How to Trade Exaggerated Divergences?
Trading exaggerated divergences can be highly rewarding if approached with a well-structured strategy. These divergences offer clear signals for potential market reversals and allow traders to enter and exit positions with greater accuracy. Here’s a step-by-step guide on how to trade exaggerated divergences effectively.
Trading Exaggerated Bullish Divergence
Following is the step-by-step guide to trade exaggerated bullish divergence:
- Identify the Pattern: You need to look for situations where the price forms equal lows, creating a double bottom pattern, while the chosen technical indicator (like RSI, MACD, or Stochastic) forms higher lows. This setup indicates a potential bullish reversal.
- Confirm with Volume: After that you need to check the trading volume to confirm the divergence. A bullish exaggerated divergence is more reliable if the volume decreases as the price forms a double bottom. This signals that the selling pressure is weakening.
- Entry Point: You can enter the trade when the price breaks above the immediate resistance level following the double bottom formation. Alternatively, you can enter when the indicator confirms the bullish signal, such as the RSI crossing above 30 or the MACD line crossing above the signal line.
- Stop Loss: You should place a stop loss slightly below the recent low of the double bottom pattern. This protects your trade from unexpected market movements and false breakouts.
- Profit Taking: You can set a profit target based on the next significant resistance level. You can also use a trailing stop to lock in profits as the price moves in your favor, allowing you to capture more gains if the bullish trend continues.
Trading Bearish Exaggerated Divergences
- Identify the Pattern: First, you need to Look for instances where the price forms equal highs, creating a double top pattern, while the chosen technical indicator forms lower highs. This setup suggests a potential bearish reversal.
- Confirm with Volume: After that Verify the divergence with trading volume. A bearish exaggerated divergence is more reliable if the volume decreases as the price forms the double top. This indicates that the buying pressure is fading.
- Entry Point: You need to enter the trade when the price breaks below the immediate support level following the double top formation. Alternatively, you can enter when the indicator confirms the bearish signal, such as the RSI crossing below 70 or the MACD line crossing below the signal line.
- Stop Loss: You should place a stop loss slightly above the recent high of the double top pattern. This safeguards your trade against sudden market movements and false breakouts. If you’re new or cannot implement these then you can consult with ParadiseTeam Professional Traders.
- Profit Taking: You need to set a profit target based on the next significant support level. You can also use a trailing stop to lock in profits as the price moves in your favor, ensuring you capture more gains if the bearish trend continues.
The beginners and professional crypto traders with the ambition of consistent growth can join ParadiseFamilyVIP🎖️.
Additional Tips for Trading Exaggerated Divergences
Following are some additional tips for trading exaggerated divergences:
- Use Multiple Time Frames: You need to confirm divergences on higher time frames (e.g., daily charts) and execute trades on lower time frames (e.g., hourly charts) to filter out false signals.
- Combine with Other Indicators: You can also use other technical indicators, such as moving averages, Bollinger Bands, or Fibonacci retracements, to confirm divergence signals and enhance trade accuracy.
- Stay Disciplined: Always adhere to your trading plan and avoid emotional trading. You should set predefined entry and exit points, and stick to them.
- Backtest Your Strategy: Before implementing any new strategy in a live market, backtest it using historical data to ensure its effectiveness. If you’re new, then you can consult with ParadiseTeam Professional Traders.
By following these steps and incorporating additional tips, you can trade exaggerated divergences with greater confidence and precision. This strategy will ultimately improve your trading performance and profitability.
Final Thoughts:
Now that you’ve learned how to identify and trade Exaggerated Bullish & Bearish Divergences, you can leverage this powerful strategy to elevate your trading skills. By using technical indicators like MACD and RSI, even novice traders can detect these pivotal signals and make more informed market entries and exits. You can begin implementing this strategy to see its benefits.
The technical knowledge you’ve gained from this article is valuable, but it’s only one part of the equation for long-term trading success. While it can provide an edge, achieving consistent profitability over the next 3+ years requires combining it with proper trading strategies and tactics.
At ParadiseFamilyVIP 🎖️, we use a powerful mix of technical analysis, on-chain data, sentiment monitoring, and whale psychology to deliver the most accurate crypto signals and portfolio management strategies. These tools, combined with proven tactics, help ensure sustainable profitability.
👉To check availability in ParadiseFamilyVIP 🎖️(Click it)
If you’re ready to elevate your skills, joining our inner circle is the best step forward. Seats are limited, so join the waiting list if needed.