


Chart Patterns Explained
In short
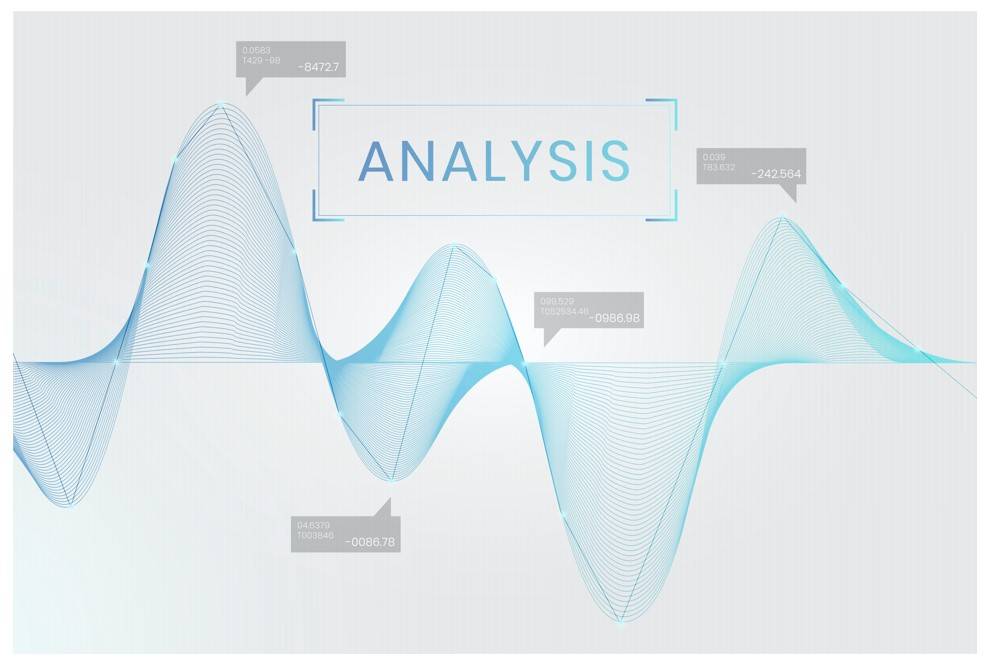
Crypto trading patterns are visual representations on charts that help investors and traders understand potential market directions and dynamics. Each pattern is unique in its functionality and influence within the market. Recognizing these patterns is crucial for interpreting market movements and making informed trading decisions.
If you have the slightest experience of trading you must have encountered different charts and patterns. In the world of trading charts and patterns are the language investors and day traders speak to make sense of where the market is headed. These charts and patterns indicate an array of different directions a trading market can go towards. These charts and patterns acts as good crypto graph patterns helping users understand market dynamics, where each graph pattern is unique to its functionality and influence in the respective market or circumstance.
Unfortunately not all patterns are easy to understand especially for novice investors. Crypto markets are tricky the markets undergo various fluctuations that create avenues and opportunities for smart traders to capitalise. Without the knowledge of the right pattern to follow novice investors loose these golden opportunities.
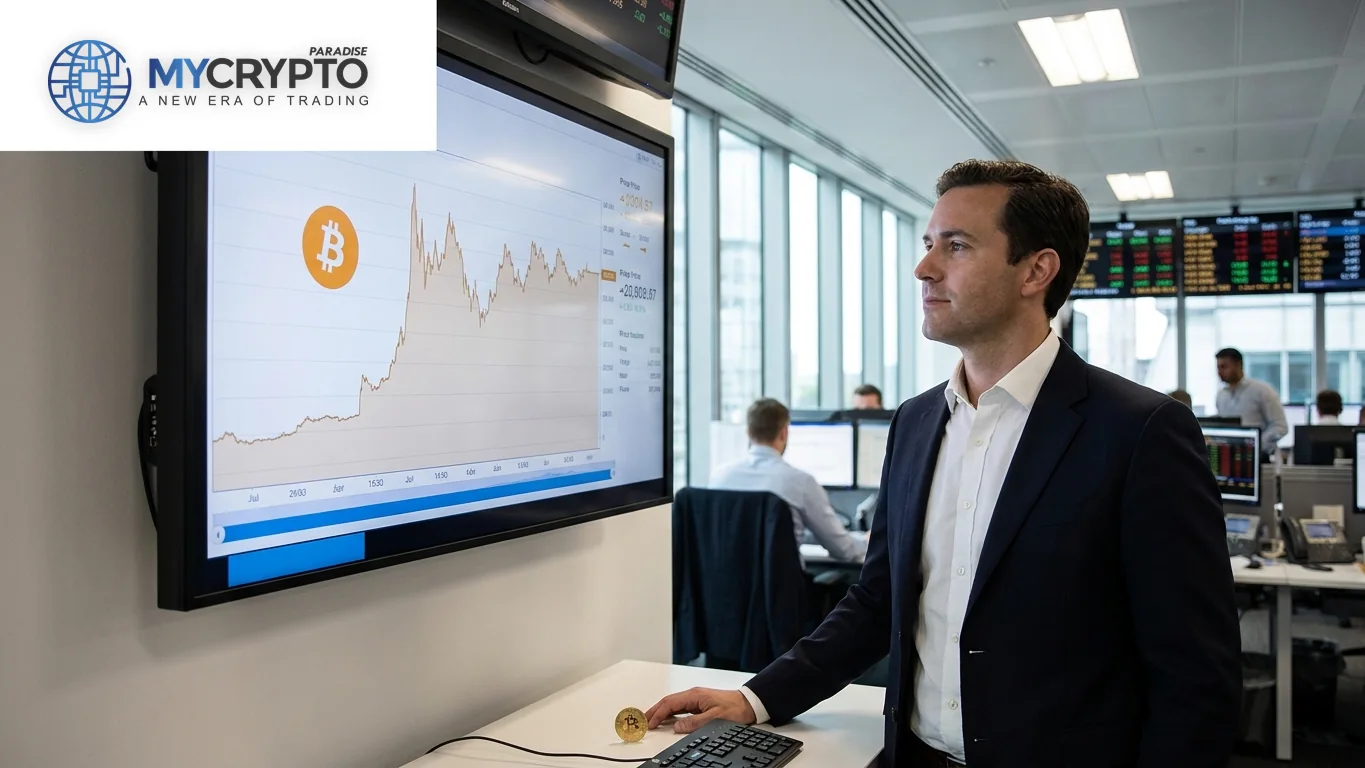
At MyCryptoParadise, we take the responsibility of educating our investors very seriously. Therefore today we are going to discuss the Top 8 Crypto Trading Patterns an investor must follow in order to make profitable gains.
Interested to learn more ? Just keep reading…
Support and Resistance
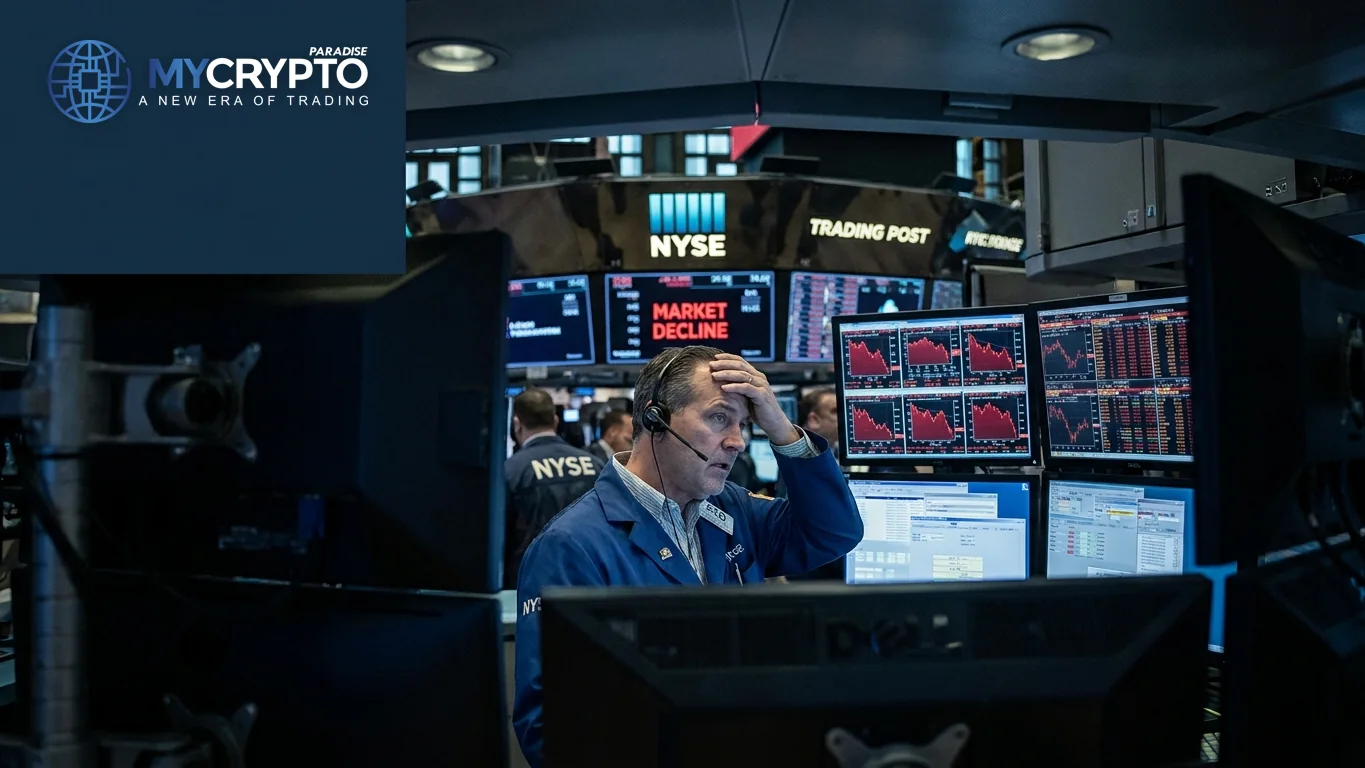
The support level often indicates the level at which an asset will inherently stop falling. Assets, especially crypto assets, go through many fluctuations throughout the day. The volatile nature of cryptocurrencies has primarily allowed traders and investors to evolve their perceptions of gaining an income; therefore, it’s crucial to understand the fundamentals.
Contrarily, Resistance levels indicate the peak of the price movement. Support and Resistance levels denote the balance system between buyers and sellers of an asset, in this case, cryptocurrencies. The shift in balance is often countered with an equal but opposite turn.
The price movement manipulated by demand or supply of an asset can be a notable example in dissecting Support and Resistance levels. Now that we’ve grasped the concept of support and resistance levels and the factors affecting it lets dive into the set of different charting patterns we use at MyCryptoParadise.
-
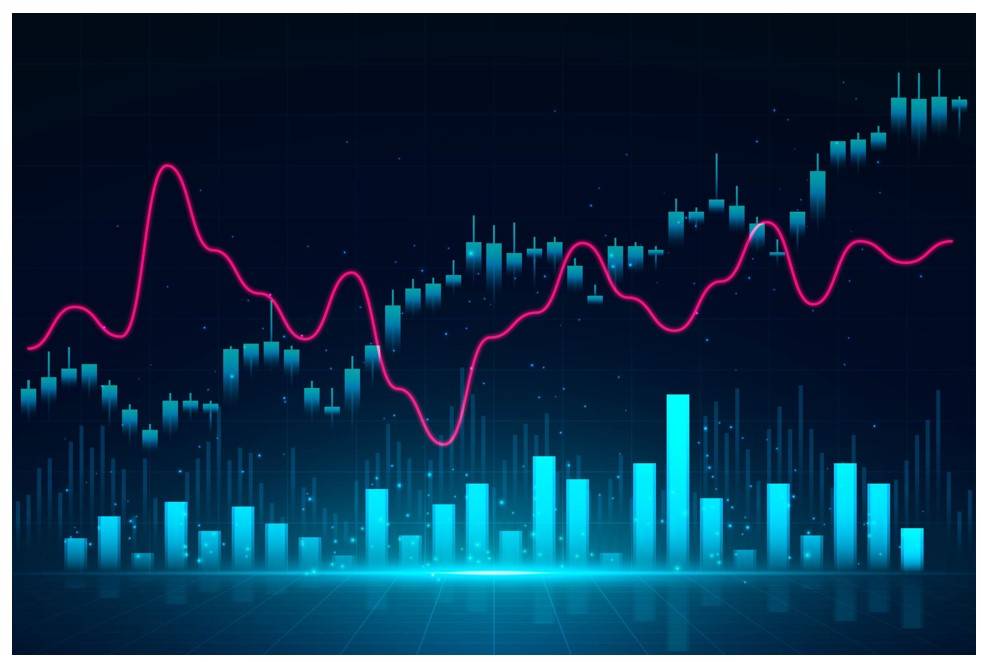
Chart Patterns
As mentioned above, there is an array of diverse chart patterns unique to their functionality and emphasis on certain factors in the market. While there isn’t one best chart pattern, seasoned traders often utilize multiple chart patterns to gain an insight into the Market.
There are different categories of Chart Patterns, these include Bilateral Patterns, Continuation Patterns & Reversal Patterns. Continuation Patterns illustrate the present nature of trends, such as if an ongoing trend will continue.
Reversal Patterns predict the potential nature of trends, such as if an ongoing trend will change directions. In contrast, Bilateral Trends suggest the destination of price movements, especially in highly volatile markets.
To accurately utilize the patterns mentioned above, it is essential to comprehend CFD’s importance. CFD’s are pivotal in allowing traders and investors to accurately predict potential market trends and manipulate them towards profitable gains.
At MyCryptoParadise, we advocate some of the best crypto trading patterns in our technical analysis. Our cryptocurrency trading strategies involve the use of sophisticated tools and solid fundamentals.
Here are some of the best Trading Patterns we use
-
Head and Shoulders
Head and Shoulders is a chart pattern that comprises various peaks of different sizes. Each peak in the Head and Shoulder’s chart pattern is primarily followed by a smaller peak right next to it. Traders comprehend these patterns to identify bearish and bullish trends.
-
Double Top
The double top is a chart pattern common among many traders worldwide. Traders and investors actively monitor these patterns to identify trend reversals of an asset. It takes a deeper understanding of the support and resistance levels to comprehend the Double top chart pattern’s crest and troughs.
-
Double Bottom
Double Bottom enables traders and investors to denote periods of selling and the potential direction of an asset. Double Bottom chart patterns have allowed traders to identify price drops or surges to illustrate bullish reversal patterns in the market accurately.
-
Rounding Bottom
The Rounding Bottom can often be categorized between continuation patterns and reversal patterns. Traders utilize the Rounding Bottom chart pattern in their cryptocurrency trading strategy to emphasize bullish continuations or bullish reversals. Skilled traders often capitalize on specific models shown through Rounding Bottom chart patterns by buying at particular trends and selling on others.
-
Cup and Handle
Cup and Handle chart patterns is one of the most profitable and frequent patterns traders resort to. This pattern basically illustrates the continuation of bullish pattern by showcasing the internal of bearish sentiments for an asset before it goes up again towards the bullish trend. The ‘Cups’ and ‘Handles’ in the pattern suggests potential retracement of assets or continuation towards bullish trends.
-
Wedges
Wedges identify an asset’s price movement by implementing trend lines, falling or rising, to represent support or resistance levels. Traders identify rising or falling wedges to predict if the decline or rise of an asset’s price. Rising and Falling wedges are often categorized as reversal patterns that indicate bearish or bullish markets.
8. Symmetrical Triangles
These patterns are mostly showcase bearish or bullish trends. It is often categorized as a continuation pattern because the Symmetrical Triangle Pattern accurately illustrates the potential direction of ongoing trends.
Interestingly Symmetrical Triangles also connotes the convergence and divergence of price movements of an asset. The Symmetrical triangle pattern also represents a bilateral pattern because they are used to accurately predict the direction of an asset’s price without any clear indication.
Conclusion
Comprehending and utilizing multiple chart patterns can be pivotal in predicting and capitalizing on the avenue of opportunities in the cryptocurrency market. We at My Crypto Paradise advocate the use of numerous sophisticated indicators to form our technical analysis.
Our strategies tailored with statistical models and technical indicators to comprehend, predict, and manipulate asset prices. Some indicators, such as Hammer and shooting stars Candlestick patterns, are aggregated into our fundamental strategies to deliver the best Binance crypto signals, Bitmex crypto signals, and Bybit crypto signals.
Join our Paradise VIP membership or experience what it is like to be a VIP member through our Free crypto signals on telegram.
What is different here
Most guides stop at the theory. The MyCryptoParadise team shares the live trades, and the reasoning behind each one, inside ParadiseFamilyVIP. Everything here is education, not financial advice.
Crypto trading involves substantial risk and is not suitable for everyone. Nothing here is financial advice; it is education only. Never risk more than you can afford to lose.


Join the discussion 3
This makes it even easier to interpret the crypto signals when I receive them! This is the best crypto calls group for me.
I actually had to write down these Crypto trading patterns as this is a wealth of information which I really appreciate you publishing and including here. What a great source of information! Thank you mycryptoparadise!
Accurately read technical analyisis = crypto signals. These patterns need to be read, studied and repeatedly practiced. It's easy to try to understand a signal of an already formed trend. But where it gets interesting is being able to analyze it as the pattern actively forms.